U.S. Economic Performance (1971 - 2011)
•Download as PPT, PDF•
0 likes•193 views

Analysis of America's economic growth, compared to the OECD's economic growth, with focus on performance of each of the past 8 presidents.

Recommended
Recommended
More Related Content
Recently uploaded
Recently uploaded (20)
Featured
Featured (20)
U.S. Economic Performance (1971 - 2011)
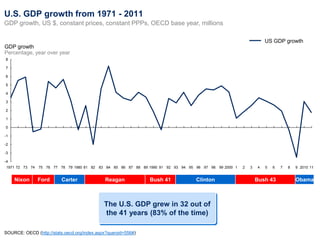
- 1. U.S. GDP growth from 1971 - 2011 GDP growth, US $, constant prices, constant PPPs, OECD base year, millions US GDP growth GDP growth Percentage, year over year 8 7 6 5 4 3 2 1 0 -1 -2 -3 -4 1971 72 73 74 75 76 77 78 79 1980 81 82 83 84 85 86 87 88 89 1990 91 92 93 94 95 96 97 98 99 2000 1 2 3 4 5 6 7 8 9 2010 11 Nixon Ford Carter Reagan Bush 41 Clinton Bush 43 Obama The U.S. GDP grew in 32 out of the 41 years (83% of the time) SOURCE: OECD (http://stats.oecd.org/index.aspx?queryid=556#)
- 2. U.S. economic growth compared to the growth in the rest of the OECD GDP growth, US $, constant prices, constant PPPs, OECD base year, millions US GDP growth GDP growth Percentage, year over year Rest of 8 OECD GDP1 growth 7 6 5 4 3 2 1 0 -1 -2 -3 -4 1971 72 73 74 75 76 77 78 79 1980 81 82 83 84 85 86 87 88 89 1990 91 92 93 94 95 96 97 98 99 2000 1 2 3 4 5 6 7 8 9 2010 11 Nixon Ford Carter Reagan Bush 41 Clinton Bush 43 Obama U.S. GDP is strongly correlated with OECD GDP (r2 = .55) 1 Rest of OECD GDP = OECD GDP – US GDP SOURCE: OECD (http://stats.oecd.org/index.aspx?queryid=556#)
- 3. The difference in American economic growth and the rest of the OECD’s economic growth GDP growth, US $, constant prices, constant PPPs, OECD base year, millions US GDP growth – rest of OECD GDP growth GDP growth Percentage, year over year 4,0 3,5 3,0 2,5 2,0 1,5 1,0 0,5 0 -0,5 -1,0 -1,5 -2,0 -2,5 -3,0 -3,5 1971 72 73 74 75 76 77 78 79 1980 81 82 83 84 85 86 87 88 89 1990 91 92 93 94 95 96 97 98 99 2000 1 2 3 4 5 6 7 8 9 2010 11 Nixon Ford Carter Reagan Bush 41 Clinton Bush 43 Obama The U.S. outperformed the rest of the OECD on GDP growth in 23 of the past 41 years (56% of the time) SOURCE: OECD (http://stats.oecd.org/index.aspx?queryid=556#)
- 4. Difference in US and rest of OECD GDP growth, split by presidential term GDP growth, US $, constant prices, constant PPPs, OECD base year, millions Difference in U.S. GDP growth and the rest of the OECD’s GDP growth Percentage, year over year, by years of presidency Average GDP difference with OECD 4.0% Entire term First 3 years 3.5% 3.0% #1: Clinton 1.35% 1.27% 2.5% 2.0% #2: Reagan 0.44% -0.05% 1.5% #3: Obama 0.01% 0.01% 1.0% 0.5% #4: Bush 43 -0.06% -0.05% 0% -0.5% #5: Carter -0.06% 0.71% -1.0% #6: Bush 41 -0.74% -1.59% -1.5% -2.0% #7: Ford -0.90% -0.90% -2.5% -3.0% #8: Nixon1 -0.92% -0.40% -3.5% Year 1 Year 2 Year 3 Year 4 Year 5 Year 6 Year 7 Year 8 Obama ranks 3rd among Year in office the past 8 presidents 1 Data is from 1971 – 2011 only; therefore, first 2 years of Nixon presidency not included in calculation SOURCE: OECD (http://stats.oecd.org/index.aspx?queryid=556#)