Developing a Customizable Panel of Real-time qPCR Assays on Microfluidic TaqMan™ Array Cards ® for Respiratory Tract Pathogen Detection
•
1 like•495 views

Here we describe development of the new application customized qPCR research panels for any subset of the targets can be built on either Applied Biosystems™ TaqMan™ Array Cards®. A novel set of TaqMan™ real-time qPCR Assays was developed to over 40 distinct respiratory pathogen targets, including bacteria, DNA viruses, RNA viruses, and fungi. We identified unique gene targets that are species-specific and designed TaqManTM assays using the proprietary assay design pipeline.
Recommended

Recommended
More Related Content
More from Thermo Fisher Scientific
More from Thermo Fisher Scientific (20)
Recently uploaded
Recently uploaded (20)
Developing a Customizable Panel of Real-time qPCR Assays on Microfluidic TaqMan™ Array Cards ® for Respiratory Tract Pathogen Detection
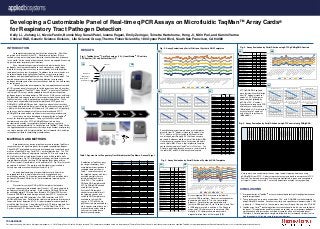
- 1. Kelly Li, Jisheng Li, Nicole Fantin, Bonnie Moy, Sunali Patel, Ioanna Pagani, Emily Zeringer, Toinette Hartshorne, Hong Ji, Nitin Puri, and Kamini Varma Clinical R&D, Genetic Science Division, Life Science Group, Thermo Fisher Scientific, 180 Oyster Point Blvd, South San Francisco, CA 94080 Developing a Customizable Panel of Real-time qPCR Assays on Microfluidic TaqMan™ Array Cards® for Respiratory Tract Pathogen Detection INTRODUCTION Uncomplicated respiratory tract infection account for ~25 million physician visits annually in the U.S. Respiratory infections (RI) are ranked as the greatest single contributor to the overall burden of disease in the world. A wide variety of bacteria and viruses are capable of causing upper and lower respiratory tract infections. Panel based testing using molecular methods to identify these pathogens has clear advantages over non-molecular or single target molecular testing. However, many current methods are limited to either fixed panels or have low throughput. To address these unmet needs, we have developed a large collection of TaqMan assays for respiratory pathogens and leveraged TaqManTM Array Card (TAC) technologies. The combination presents a robust research application for respiratory pathogen detection and allows customization of both the size and content of the test panel. Here we describe development of the new application customized qPCR research panels for any subset of the targets can be built on either Applied Biosystems™ TaqMan™ Array Cards®. A novel set of TaqMan™ real-time qPCR Assays was developed to over 40 distinct respiratory pathogen targets, including bacteria, DNA viruses, RNA viruses, and fungi. We identified unique gene targets that are species-specific and designed TaqManTM assays using the proprietary assay design pipeline. These assays were evaluated with plasmid templates and ATCC genomic DNA/gRNA (gDNA/gRNA) controls. Linearity and analytical sensitivity was studied and revealed that at least 5 log linear dynamic range (with R2 >0.99) with limit of detection (LOD) down to 1-10 copies/ul. For specificity, each assay was tested against all the rest of plasmids and ATCC gDNA/gRNA controls and no significant cross-reactivity was observed In summary, we have developed a large collection of TaqManTM assays for respiratory pathogens. Using synthetic DNA and RNA templates and as well as ATCC gDNA/gRNA controls, we have demonstrated excellent assay performance of accuracy, sensitivity, specificity, and reproducibility. In conjunction with TaqMan™ Array Cards, the application enables researchers to study a large number of respiratory in a single reaction with a simple workflow, fast turnaround time, and high throughput yet flexible sample/target combinations. . MATERIALS AND METHODS A proprietary assay design pipeline was used to design TaqManTM research assays for signature genes for targeted respiratory pathogens. These FAM™ dye-labeled assays were pre-loaded and lyophilized onto wells on a TaqMan® Array Card (TAC), a microfluidic device. The TAC platform offers a 384-well, single-plate real-time PCR in an 8 sample by 48-well format with a single target tested in each of 48 available wells (including controls, Fig 1A). Microfluidic technology distributes the sample into individual wells and real-time PCR detection takes place within a qPCR instrument (QuantStudio 7 or QuantStudio 12K, Fig 1B) with results generated in one hour. The process and individual steps involved in setting up a card are schematically outlined in Fig 1C. An oligo pool containing a large multiplex set of primers was developed for use in a single tube reverse transcription and pre- amplification reaction. This reaction generates cDNA and amplifies both genomic DNA and cDNA for the full set of microbiota targeted by the qPCR assays. Plasmids for synthetic DNA or RNAs templates that contain amplicon sequences were ordered from GeneArt. IVT was performed to generate synthetic RNA templates. Both synthetic DNA and RNA were quantified by digital PCR using QuantStudioTM 3D Digital PCR System. Genomic DNA/RNA controls were purchased from ATCC. Assays were first evaluated with DNA templates, then RNA templates and ATCC gDNAs/gRNA controls. Serial dilution studies were performed for dynamic range and limit of detection (LOD). A robust protocol was developed to using TaqMan Fast Virus 1-step Master Mix for RT-PreAmp step and Fast Advanced Master Mix on QuantStudioTM 7 or 12K Real Time PCR SystemTM for qPCR. Manufacture recommended conditions are followed. RESULTS A collection of TaqMan assays that target respiratory tract microbiota was designed and validated (data not shown). Table 1 summarizes some of the targeted species with their available controls that are tested on TaqMan ArrayTM Card (TAC). The synthetic DNA and RNA templates and ATCC gDNA/gRNA controls used for their testing. Synthetic DNA template controls are available for all the targeted species and synthetic RNA templates are available for all the RNA viruses. ATCC gDNA and gRNA controls are available for most species except those that are uncultured and or hard to culture or restricted due to biosafety consideration. Table 1. Species List of Respiratory Tract Microbiota that TaqManTM Assays Target Fig. 1. TaqMan ArrayTM Card Technology (1A), QuantStudioTM 7 Real-time PCR System (1B) and Its Workflow (1C) Fig. 2. Assay Evaluation by Serial Dilution of Synthetic DNA Templates Fig. 3. Assay Evaluation by Serial Dilution of Synthetic RNA Templates ATCC gDNA/RNA controls were tested with serial dilution from 104 copies/ml stock to 1 copies/ml. RT-PreAmp was done and then followed by qPCR on TAC. Excellent linear dynamic range and PCR efficiency are summarized (4A) plotted. LOD of all tested assays close to 1 copies/ul with at least 5 logs linearity (4B and 4C). Fig. 4. Assay Evaluation by Serial Dilution using ATCC gDNA/gRNA Controls CONCLUSIONS 1. A large collection of TaqManTM assays was developed for high throughput detection of respiratory pathogen. 2. These research assays were evaluated on TAC with DNA/RNA synthetic templates and gDNA/gRNA controls. Excellent sensitivity and specificity are demonstrated- LOD) is down to ~1-10 copies/ul (in the sample) and at least 5 logs of linearity with R2 >0.99. 3. TaqMan array CardTM technology allows customization of both the size and content of the panel. This application enables researchers to study many respiratory pathogens simultaneously and test various numbers of samples with a customizable panel. Therefore, it not only provides a simple workflow and fast turnaround time but is also high throughput with flexible sample/target combinations. B. Concentration calculation (copies/ml) Fill port Vent port Fill reservoir Main channel Feeder channel Reaction well (~1.5 ml) Load Spin Seal Run 10 15 20 25 30 35 10^1 10^2 10^3 10^4 10^5 10^6 y = -3.3936x +34.542 R² = 0.99911 0 5 10 15 20 25 30 35 0 2 4 6 8 Flu_A_H1_2009 y = -3.3361x +34.993 R² = 0.99973 0 5 10 15 20 25 30 35 0 2 4 6 8 Flu_A_H3 y = -3.3859x +33.642 R² = 0.99988 0 5 10 15 20 25 30 35 0 2 4 6 8 Flu_A_pan y = -3.2487x + 34.134 R² = 0.99981 0 5 10 15 20 25 30 35 0 2 4 6 8 Flu_B y = -3.3506x +34.995 R² = 0.9999 0 5 10 15 20 25 30 35 0 2 4 6 8 RSV_A y = -3.4199x +35.096 R² = 0.99939 0 5 10 15 20 25 30 35 0 2 4 6 8 RSV_B Serial dilution was performed with a multi templates plasmid from 106 copies/ml stock to 10 copies/ml on TAC. Volume of 10ul of synthetic DNA control was used in each port. Roughly 3.3 Ct differences were observed in adjacent dilution cross all the targets (2A). Linear dynamic range of these assays was plotted in scatter plots (2B), X-axis is log10 of plasmid template concentration (copies/ml) and Y axis is Ct values. The R square and slope for each assay are summarized in the table (2C) and PCR efficiency are calculated . Organism Name Multi Target Synthetic Plasmid In Vitro Transcript (IVT) Product ATCC Samples Bocavirus ü ü Human Coronavirus 229E ü ü ü Human Coronavirus HKU1 ü ü Human Coronavirus NL63 ü ü Human Coronavirus OC43 ü ü ü Human enterovirus ü ü ü Human enterovirus D68 strain ü ü ü Human Metapneumovirus ü ü Human Parainfluenza virus 1 ü ü ü Human Parainfluenza virus 2 ü ü ü Human Parainfluenza virus 3 ü ü ü Human Parainfluenza virus 4 ü ü ü Human Parechovirus v2 ü ü Human Rhinovirus A ü ü ü Human Rhinovirus B/C ü ü Influenza A H1 seasonal ü ü ü Influenza A H3 ü ü ü Influenza A ü ü ü Influenza B ü ü ü Measles virus ü ü ü MERS ü ü Mumps virus ü ü ü RSVA specific ü ü ü RSVB specific ü ü ü SARS ü ü Adenovirus ü ü Bordetella bronchiseptica/parapertussis/pertussis ü ü Bordetella holmesii ü ü Bordetella pertussis ü ü Chlamydophila pneumoniae ü ü Coxiella burnetii ü Haemophilus influenzae ü ü HHV3 (VZV) ü ü HHV4 (EBV) ü HHV6 ü Legionella pneumophila ü ü Moraxella catarrhalis ü ü Mycoplasma pneumoniae ü ü Pneumocystis jirovecii ü Staphylococcus aureus ü ü Streptococcus pneumoniae ü ü 1A 1B 1C 10 15 20 25 30 35 10^0 10^1 10^2 10^3 10^4 Assay R2 Slope PCR efficiency Adenovirus_pan_1 0.9994 -3.21 105.1% Adenovirus_pan_2 0.9989 -3.39 97.1% Mycoplasma pneumoniae 0.999 -3.26 102.8% Cytomegalovirus 0.9994 -3.28 101.9% Bordetella_pan 0.9962 -3.30 100.8% Bordetella_holm 0.9985 -3.09 110.8% Bordetella_pert 0.9994 -3.21 105.1% Legionella_pneum 0.998 -3.29 101.3% VZV 0.9963 -3.52 92.2% M_catarrhalis 0.9991 -3.29 101.4% Strep_pneumoniae 0.9995 -3.32 100.1% Haemo_Influenzae 0.9997 -3.31 100.6% Staph_aureus 0.9997 -3.16 107.1% Coronavirus_229E 0.9959 -3.60 89.6% Enterovirus_D68 0.9993 -3.33 99.9% Flu_A_pan 0.9998 -3.34 99.4% Flu_A_H1_2009 0.999 -3.30 100.9% Parainfluenza_1 0.9997 -3.21 104.9% Parainfluenza_2 0.9999 -3.39 97.2% Parainfluenza_4 0.9999 -3.29 101.3% Assays R 2 Slope PCR Efficiency Adenovirus_pan_1 0.9993 -3.37 98.1% Adenovirus_pan_2 0.9996 -3.30 100.8% Bocavirus 0.9997 -3.36 98.4% Bordetella_holm 0.9997 -3.29 101.3% Bordetella_pan 0.9998 -3.35 99.0% Bordetella_pert 1.0000 -3.33 99.6% Chlamyd_pneumoniae 1.0000 -3.34 99.3% Coronavirus_229E 0.9999 -3.35 98.8% Coronavirus_HKU1 0.9999 -3.44 95.2% Coronavirus_NL63 0.9997 -3.42 96.2% Coronavirus_OC43 0.9999 -3.40 97.0% Coxiella_burneti 0.9993 -3.39 97.3% Cytomegalovirus 0.9999 -3.35 98.9% Enterovirus_D68 0.9997 -3.37 98.1% Enterovirus_pan 0.9999 -3.35 98.9% Epstein-Barr 0.9993 -3.34 99.3% Flu_A_H1_2009 0.9991 -3.39 97.1% Flu_A_H3 0.9997 -3.34 99.4% Flu_A_pan 0.9999 -3.39 97.4% Flu_B 0.9998 -3.25 103.1% Haemophilus Influenzae 0.9996 -3.41 96.4% HHV-6 0.9999 -3.43 95.7% hMPV 0.9994 -3.33 99.5% Legionella_pneumoniae 0.9997 -3.32 100.0% M_catarrhalis 0.9999 -3.41 96.5% Measles 0.9989 -3.41 96.3% MERS-CoV 0.9987 -3.39 97.3% Mumps 0.9999 -3.31 100.6% Mycoplas_pneumoniae 0.9988 -3.33 99.7% Parainfluenza_1 1.0000 -3.31 100.4% Parainfluenza_2 1.0000 -3.34 99.4% Parainfluenza_3 0.9994 -3.35 99.0% Parainfluenza_4 0.9999 -3.24 103.7% Parechovirus 0.9998 -3.25 102.9% Pneumocystis jirovecii 0.9998 -3.35 99.0% Rhinovirus_A 0.9998 -3.30 100.8% Rhinovirus_B_C 0.9996 -3.29 101.5% RSV_A 0.9999 -3.35 98.8% RSV_B 0.9994 -3.42 96.1% SARS 0.9999 -3.37 98.1% Staphylococcus aureus 0.9993 -3.34 99.4% Strep_pneumoniae 1.0000 -3.35 98.7% VZV 0.9996 -3.35 98.9% 2C2B 2A Assays targeting RNA viruses were tested with synthetic RNA templates. Reverse transcription was performed with these IVT (in vitro transcription) products. Serial dilution was performed with synthetic RNA pool from 105 to 10 copies/ml and. 10ul of RNA pool was used in each port. The R square, slope and PCR efficiency are summarized (3A). Roughly 3.3 Ct differences were observed in adjacent dilution cross all the targets (3B). 5 10 15 20 25 30 35 10^5 10^4 10^3 10^2 10^1 10^0 No. Assay R2 Slope PCR Efficiency 1 Coronavirus_229E 1.000 3.337 99% 2 Coronavirus_HKU1 1.000 3.317 100% 3 Coronavirus_NL63 1.000 3.363 98% 4 Coronavirus_OC43 0.997 3.546 91% 5 Enterovirus_D68 1.000 3.271 102% 6 Enterovirus_pan 1.000 3.22 104% 7 Flu_A_H1_2009 0.999 3.254 103% 8 Flu_A_H3 1.000 3.283 102% 9 Flu_A_pan 0.999 3.229 104% 10 Flu_B 0.995 3.08 111% 11 hMPV 0.993 3.089 111% 12 Measles 1.000 3.311 100% 13 MERS-CoV 0.998 3.471 94% 14 Mumps 1.000 3.283 102% 15 Parainfluenza_1 0.999 3.334 99% 16 Parainfluenza_2 0.994 3.483 94% 17 Parainfluenza_3 0.999 3.377 98% 18 Parainfluenza_4 0.997 3.36 98% 19 Parechovirus 1.000 3.309 101% 20 Rhinovirus_A 1.000 3.303 101% 21 Rhinovirus_B_C 0.998 3.226 104% 22 RSV_A 1.000 3.36 98% 23 RSV_B 0.996 3.566 91% 24 SARS 1.000 3.331 100% 3B3A Humanadenovirus2 Humanadenovirus7 Humanadenovirus12 Bordetellabronchisepetica Bordetellaparapertussis Bordetellaholmesii Bordetellapertussis Chlamydophilapneumoniae(CM1) Chlamydophilapneumoniae(AR39) Humancoronavirus229E Betacoronavirus1(strainOC43) HumanHerpesvirus5HCMVstrainAD-169 EnterovirusD68(US/KY/14-18953) EnterovirusD68(US/MO/14-18947) Haemophilusinfluenzae InfluenzaAvirus(H1N1)strainA/Virginia/ATCC1/2009 InfluenzaAvirus(H3N2) InfluenzaBvirus Kiebsiellapneumoniae Legionellapneumophila Measlesvirus Moraxellacatarrhalis Mumpsvirus Mycoplasmapneumoniae ParainfluenzaPIV-1 ParainfluenzaPIV-2 ParainfluenzaPIV-3 ParainfluenzaPIV-4 HumanrespiratorySyncytialVirusRSV-A HumanrespiratorySyncytialVirusRSV-B Humanrhinovirus17 Staphylococcusaureus Streptococcuspneumoniae Humanherpesvirus3 Adenovirus_pan_1 21.8 20.4 Adenovirus_pan_2 20.7 21.0 Bordetella_pan 23.9 22.7 22.4 B_holmesii 22.6 B_pertussis 22.6 C_pneumoniae 22.3 20.2 Coronavirus_229E 22.6 Coronavirus_OC43 21.7 HHV5_CMV 20.1 Enterovirus_D68 23.6 23.6 Enterovirus_pan 28.4 H_influenzae 19.7 Influenza_A_H1 23.2 Influenza_A_pan 20.7 22.6 Influenza_B 21.6 K_ pneumoniae 20.1 L_pneumophila 20.8 Measles 21.6 M_catarrhalis 20.9 Mumps 23.0 M_pneumoniae 20.7 PIV_1 22.0 PIV_2 22.1 PIV_3 21.4 PIV_4 20.4 RSVA 20.0 RSVB 28.5 21.8 Rhinovirus_pan_1 25.5 S_aureus 20.1 S_pneumoniae 19.0 HHV3_VZV 20.7 TRADEMARKS For research use only. Not for use in diagnostic procedures. © 2018 Thermo Fisher Scientific. All rights reserved. The trademarks mentioned herein are the property of Thermo Fisher Scientific and its subsidiaries unless otherwise specified. TaqMan is a registered trademark of Roche Molecular Systems, Inc., used under permission and license. Fig. 5. Assay Evaluation by Serial Dilution using ATCC controls of gDNA/gRNA 4C 4B4A Assays were also evaluated for their on-target and off-target performance using gDNA/gRNA from ATCC. Columns represent assay tested and rows represent ATCC controls. The desired on-target Ct values were highlighted in green and unexpected off-target Ct values are in red. The result demonstrate excellent assay specificity. y = -3.32x + 27.267 R² = 0.99947 0 5 10 15 20 25 30 0 1 2 3 4 5 6 Strep_pneumoniae y = -3.1629x + 26.59 R² = 0.99975 0 5 10 15 20 25 30 0 1 2 3 4 5 6 Staph_aureus y = -3.2057x + 27.114 R² = 0.99945 0 5 10 15 20 25 30 0 1 2 3 4 5 6 Adenovirus_pan_1 y = -3.3943x + 28.386 R² = 0.99891 0 5 10 15 20 25 30 0 1 2 3 4 5 6 Adenovirus_pan_2 y = -3.2771x + 26.743 R² = 0.99941 0 5 10 15 20 25 30 0 1 2 3 4 5 6 Cytomegalovirus y = -3.3086x + 28.538 R² = 0.99965 0 5 10 15 20 25 30 0 1 2 3 4 5 6 Haemo_Influenzae