SlideShare a Scribd company logo
1 of 2
Download to read offline
© 2017 Jones Lang LaSalle IP, Inc. All rights reserved. All information contained herein is from sources deemed reliable; however, no representation or warranty is made to the accuracy thereof.
Q1 2017
Pittsburgh
Office Insight
A more specialized form of technology is emerging quickly in Pittsburgh:
robotics. Carnegie Mellon University (CMU), located in the Oakland / East End
submarket, has been home to the Robotics Institute since 1979. However, the
latest flurry of activity from Uber, Amazon, and the recently funded Argo
(Ford), continue to make the point that being close to the robotics research
coming from CMU is key. Being one of the top 10 universities in the world for
technology, and ranking number one in the nation for computer science
graduate studies, CMU has helped build technology company office demand
in the region. The technology job sector in Pittsburgh is now the fastest
growing industry at 4.3 percent year-over-year from 2015, outpacing the
United States at just 3.4 percent. The growth in technology jobs has attracted
a younger demographic as well. The ten year period from 2005 to 2015 in
Pittsburgh showed an increase in the population of 25 to 34 year olds at 20.2
percent, reversing the previously lamented “brain drain.”
Law firms and financial institutions occupy the majority of space in the CBD,
but the Fringe has quickly transformed into the technology submarket, with
over 240,000 square feet of office space taken by technology firms in 2016.
Outlook
Leasing activity is primarily focused on Class A space and the need for quality
space is driving redevelopment. In the urban submarkets, as office buildings
trade, aggressive underwriting will continue to increase rental rates. The
increasing rental rates were slightly outpaced by overall vacancy rates at the
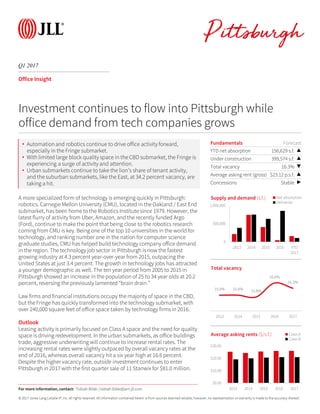
end of 2016, whereas overall vacancy hit a six year high at 16.6 percent.
Despite the higher vacancy rate, outside investment continues to enter
Pittsburgh in 2017 with the first quarter sale of 11 Stanwix for $81.0 million.
Fundamentals Forecast
YTD net absorption 156,629 s.f. ▲
Under construction 399,574 s.f. ▲
Total vacancy 16.3% ▼
Average asking rent (gross) $23.12 p.s.f. ▲
Concessions Stable ▶
0
500,000
1,000,000
2013 2014 2015 2016 YTD
2017
Supply and demand (s.f.) Net absorption
Deliveries
Investment continues to flow into Pittsburgh while
office demand from tech companies grows
15.9% 15.9% 15.8%
16.6%
16.3%
2013 2014 2015 2016 2017
Total vacancy
$0.00
$10.00
$20.00
$30.00
2013 2014 2015 2016 2017
Average asking rents ($/s.f.) Class A
Class B
For more information, contact: Tobiah Bilski | tobiah.bilski@am.jll.com
• Automation and robotics continue to drive office activity forward,
especially in the Fringe submarket.
• With limited large block quality space in the CBD submarket, the Fringe is
experiencing a surge of activity and attention.
• Urban submarkets continue to take the lion’s share of tenant activity,
and the suburban submarkets, like the East, at 34.2 percent vacancy, are
taking a hit.
© 2017 Jones Lang LaSalle IP, Inc. All rights reserved. All information contained herein is from sources deemed reliable; however, no representation or warranty is made to the accuracy thereof.
Q1 2017
Pittsburgh
Office Statistics
For more information, contact: Tobiah Bilski | tobiah.bilski@am.jll.com
Class Inventory (s.f.)
Total net
absorption
(s.f.)
YTD total net
absorption
(s.f.)
YTD total net
absorption (%)
Direct vacancy
(%)
Total vacancy
(%)
Average direct
asking rent ($
p.s.f.)
YTD
completions
(s.f.)
Under
construction
(s.f.)
CBD Totals 18,928,135 -116,857 -116,857 -0.6% 12.9% 14.6% $26.03 0 0
Fringe Totals 7,526,595 151,822 151,822 2.0% 10.7% 11.5% $23.26 105,000 37,500
Oakland/East End Totals 1,993,356 61,037 61,037 3.1% 5.1% 5.3% $33.16 0 0
Urban Totals 28,448,086 96,002 96,002 0.3% 11.8% 13.1% $25.52 105,000 37,500
North Totals 3,417,734 -58,539 -58,539 -1.7% 10.7% 11.3% $21.35 0 193,000
Northern I-79/Cranberry Totals 3,442,781 39,042 39,042 1.1% 10.6% 15.4% $23.97 0 89,074
East Totals 3,045,135 55,960 55,960 1.8% 32.4% 34.2% $20.22 0 0
South Totals 2,267,259 -45,344 -45,344 -2.0% 10.7% 12.4% $20.41 0 80,000
Southpointe Totals 2,822,107 34,480 34,480 1.2% 22.5% 26.4% $22.75 0 0
West Totals 6,912,426 35,028 35,028 0.5% 20.0% 21.3% $21.05 0 0
Suburban Totals 21,907,442 60,627 60,627 0.3% 18.1% 20.3% $21.30 0 362,074
Pittsburgh Totals 50,355,528 156,629 156,629 0.3% 14.5% 16.3% $23.12 105,000 399,574
CBD A 13,102,880 -33,301 -33,301 -0.3% 9.9% 12.2% $29.22 0 0
Fringe A 1,905,907 -17,682 -17,682 -0.9% 4.0% 6.5% $24.07 105,000 0
Oakland/East End A 969,243 47,227 47,227 4.9% 8.8% 9.2% $34.97 0 0
Urban A 15,978,030 -3,756 -3,756 0.0% 9.1% 11.3% $29.25 105,000 0
North A 706,347 -32,557 -32,557 -4.6% 11.6% 14.0% $24.61 0 193,000
Northern I-79/Cranberry A 2,766,249 -11,888 -11,888 -0.4% 10.0% 14.1% $24.66 0 0
East A 1,580,784 68,911 68,911 4.4% 28.5% 29.8% $22.42 0 0
South A 0 0 0 0.0% 0.0% 0.0% $0.00 0 80,000
Southpointe A 1,759,754 19,045 19,045 1.1% 15.0% 19.7% $23.64 0 0
West A 3,767,504 -6,443 -6,443 -0.2% 17.4% 19.8% $22.78 0 0
Suburban A 10,580,638 37,068 37,068 0.4% 16.3% 19.4% $23.40 0 273,000
Pittsburgh A 26,558,668 33,312 33,312 0.1% 12.0% 14.5% $25.98 105,000 273,000
CBD B 5,825,255 -83,556 -83,556 -1.4% 19.5% 20.1% $22.05 0 0
Fringe B 5,620,688 169,504 169,504 3.0% 13.0% 13.2% $23.17 0 37,500
Oakland/East End B 1,024,113 13,810 13,810 1.3% 1.6% 1.6% $23.86 0 0
Urban B 12,470,056 99,758 99,758 0.8% 15.1% 15.4% $22.53 0 37,500
North B 2,711,387 -25,982 -25,982 -1.0% 10.5% 10.6% $18.21 0 0
Northern I-79/Cranberry B 676,532 50,930 50,930 7.5% 12.9% 20.7% $21.73 0 89,074
East B 1,464,351 -12,951 -12,951 -0.9% 36.6% 38.9% $18.36 0 0
South B 2,267,259 -45,344 -45,344 -2.0% 10.7% 12.4% $20.41 0 0
Southpointe B 1,062,353 15,435 15,435 1.5% 35.1% 37.5% $22.12 0 0
West B 3,144,922 41,471 41,471 1.3% 23.0% 23.1% $19.43 0 0
Suburban B 11,326,804 23,559 23,559 0.2% 19.8% 21.2% $19.72 0 89,074
Pittsburgh B 23,796,860 123,317 123,317 0.5% 17.4% 18.2% $20.91 0 126,574

More Related Content

What's hot

JLL Grand Rapids Office Insight & Statistics - Q1 2019
JLL Grand Rapids Office Insight & Statistics - Q1 2019JLL Grand Rapids Office Insight & Statistics - Q1 2019
JLL Grand Rapids Office Insight & Statistics - Q1 2019Harrison West
 
JLL Cleveland Office Outlook: Q4 2018
JLL Cleveland Office Outlook: Q4 2018JLL Cleveland Office Outlook: Q4 2018
JLL Cleveland Office Outlook: Q4 2018Andrew Batson
 
JLL Detroit Office Insight & Statistics – Q2 2016
JLL Detroit Office Insight & Statistics – Q2 2016JLL Detroit Office Insight & Statistics – Q2 2016
JLL Detroit Office Insight & Statistics – Q2 2016Aaron Moore
 
Pittsburgh Office Insight & Stats Q1 2022
Pittsburgh Office Insight & Stats Q1 2022Pittsburgh Office Insight & Stats Q1 2022
Pittsburgh Office Insight & Stats Q1 2022Tobiah Bilski
 
St. Louis Office Insight
St. Louis Office InsightSt. Louis Office Insight
St. Louis Office InsightBlaise Tomazic
 
Asia Pacific Real Estate Market Outlook 2019
Asia Pacific Real Estate Market Outlook 2019Asia Pacific Real Estate Market Outlook 2019
Asia Pacific Real Estate Market Outlook 2019Đoàn Trọng Hiếu
 
St. Louis Office Insight
St. Louis Office InsightSt. Louis Office Insight
St. Louis Office InsightBlaise Tomazic
 
JLL Detroit Industrial Insight & Statistics - Q1 2017
JLL Detroit Industrial Insight & Statistics - Q1 2017JLL Detroit Industrial Insight & Statistics - Q1 2017
JLL Detroit Industrial Insight & Statistics - Q1 2017Harrison West
 
2016 Salary Survey
2016 Salary Survey2016 Salary Survey
2016 Salary SurveyMark Heald
 
Cushman & Wakefield's Canadian Office Statistical Summary Q4 2018
Cushman & Wakefield's Canadian Office Statistical Summary Q4 2018Cushman & Wakefield's Canadian Office Statistical Summary Q4 2018
Cushman & Wakefield's Canadian Office Statistical Summary Q4 2018Guy Masse
 
2017 Law Firm office market overview
2017 Law Firm office market overview2017 Law Firm office market overview
2017 Law Firm office market overviewJLL
 
Software and Technology Services - 2021 M&A Summary
Software and Technology Services - 2021 M&A SummarySoftware and Technology Services - 2021 M&A Summary
Software and Technology Services - 2021 M&A SummaryAlps Venture Partners
 
Industrial development driving prosperity in a market where the pipeline has ...
Industrial development driving prosperity in a market where the pipeline has ...Industrial development driving prosperity in a market where the pipeline has ...
Industrial development driving prosperity in a market where the pipeline has ...Jacob Attaway
 
JLL Dayton Office Report Summer 2020
JLL Dayton Office Report Summer 2020JLL Dayton Office Report Summer 2020
JLL Dayton Office Report Summer 2020Abby Armbruster
 
Glasgow City Region - Enhancing Productivity
Glasgow City Region - Enhancing ProductivityGlasgow City Region - Enhancing Productivity
Glasgow City Region - Enhancing ProductivityMartin Jack
 
JLL West Michigan Industrial Insight & Statistics - Q1 2020
JLL West Michigan Industrial Insight & Statistics - Q1 2020JLL West Michigan Industrial Insight & Statistics - Q1 2020
JLL West Michigan Industrial Insight & Statistics - Q1 2020Harrison West
 
JLL Detroit Office Insight & Statistics - Q4 2018
JLL Detroit Office Insight & Statistics - Q4 2018JLL Detroit Office Insight & Statistics - Q4 2018
JLL Detroit Office Insight & Statistics - Q4 2018Harrison West
 

What's hot (20)

JLL Grand Rapids Office Insight & Statistics - Q1 2019
JLL Grand Rapids Office Insight & Statistics - Q1 2019JLL Grand Rapids Office Insight & Statistics - Q1 2019
JLL Grand Rapids Office Insight & Statistics - Q1 2019
 
JLL Cleveland Office Outlook: Q4 2018
JLL Cleveland Office Outlook: Q4 2018JLL Cleveland Office Outlook: Q4 2018
JLL Cleveland Office Outlook: Q4 2018
 
JLL Detroit Office Insight & Statistics – Q2 2016
JLL Detroit Office Insight & Statistics – Q2 2016JLL Detroit Office Insight & Statistics – Q2 2016
JLL Detroit Office Insight & Statistics – Q2 2016
 
Pittsburgh Office Insight & Stats Q1 2022
Pittsburgh Office Insight & Stats Q1 2022Pittsburgh Office Insight & Stats Q1 2022
Pittsburgh Office Insight & Stats Q1 2022
 
St. Louis Office Insight
St. Louis Office InsightSt. Louis Office Insight
St. Louis Office Insight
 
Q3 2019 | Austin Office | Research & Forecast Report
Q3 2019 | Austin Office | Research & Forecast ReportQ3 2019 | Austin Office | Research & Forecast Report
Q3 2019 | Austin Office | Research & Forecast Report
 
Asia Pacific Real Estate Market Outlook 2019
Asia Pacific Real Estate Market Outlook 2019Asia Pacific Real Estate Market Outlook 2019
Asia Pacific Real Estate Market Outlook 2019
 
St. Louis Office Insight
St. Louis Office InsightSt. Louis Office Insight
St. Louis Office Insight
 
St.
St. St.
St.
 
JLL Detroit Industrial Insight & Statistics - Q1 2017
JLL Detroit Industrial Insight & Statistics - Q1 2017JLL Detroit Industrial Insight & Statistics - Q1 2017
JLL Detroit Industrial Insight & Statistics - Q1 2017
 
2016 Salary Survey
2016 Salary Survey2016 Salary Survey
2016 Salary Survey
 
Cushman & Wakefield's Canadian Office Statistical Summary Q4 2018
Cushman & Wakefield's Canadian Office Statistical Summary Q4 2018Cushman & Wakefield's Canadian Office Statistical Summary Q4 2018
Cushman & Wakefield's Canadian Office Statistical Summary Q4 2018
 
2017 Law Firm office market overview
2017 Law Firm office market overview2017 Law Firm office market overview
2017 Law Firm office market overview
 
Software and Technology Services - 2021 M&A Summary
Software and Technology Services - 2021 M&A SummarySoftware and Technology Services - 2021 M&A Summary
Software and Technology Services - 2021 M&A Summary
 
Q2 2019 | Austin Office | Research & Forecast Report
Q2 2019 | Austin Office | Research & Forecast ReportQ2 2019 | Austin Office | Research & Forecast Report
Q2 2019 | Austin Office | Research & Forecast Report
 
Industrial development driving prosperity in a market where the pipeline has ...
Industrial development driving prosperity in a market where the pipeline has ...Industrial development driving prosperity in a market where the pipeline has ...
Industrial development driving prosperity in a market where the pipeline has ...
 
JLL Dayton Office Report Summer 2020
JLL Dayton Office Report Summer 2020JLL Dayton Office Report Summer 2020
JLL Dayton Office Report Summer 2020
 
Glasgow City Region - Enhancing Productivity
Glasgow City Region - Enhancing ProductivityGlasgow City Region - Enhancing Productivity
Glasgow City Region - Enhancing Productivity
 
JLL West Michigan Industrial Insight & Statistics - Q1 2020
JLL West Michigan Industrial Insight & Statistics - Q1 2020JLL West Michigan Industrial Insight & Statistics - Q1 2020
JLL West Michigan Industrial Insight & Statistics - Q1 2020
 
JLL Detroit Office Insight & Statistics - Q4 2018
JLL Detroit Office Insight & Statistics - Q4 2018JLL Detroit Office Insight & Statistics - Q4 2018
JLL Detroit Office Insight & Statistics - Q4 2018
 

Similar to JLL Pittsburgh Office Insight & Statistics - Q1 2017

JLL Pittsburgh Office Insight & Statistics - Q1 2018
JLL Pittsburgh Office Insight & Statistics - Q1 2018JLL Pittsburgh Office Insight & Statistics - Q1 2018
JLL Pittsburgh Office Insight & Statistics - Q1 2018Tobiah Bilski
 
JLL Pittsburgh Office Insight & Statistics - Q4 2017
JLL Pittsburgh Office Insight & Statistics - Q4 2017JLL Pittsburgh Office Insight & Statistics - Q4 2017
JLL Pittsburgh Office Insight & Statistics - Q4 2017Tobiah Bilski
 
JLL Pittsburgh Office Insight & Statistics - Q4 2019
JLL Pittsburgh Office Insight & Statistics - Q4 2019JLL Pittsburgh Office Insight & Statistics - Q4 2019
JLL Pittsburgh Office Insight & Statistics - Q4 2019Tobiah Bilski
 
JLL Pittsburgh Office Insight & Statistics - Q3 2018
JLL Pittsburgh Office Insight & Statistics - Q3 2018JLL Pittsburgh Office Insight & Statistics - Q3 2018
JLL Pittsburgh Office Insight & Statistics - Q3 2018Tobiah Bilski
 
JLL Louisville Office Outlook - Q2 2018
JLL Louisville Office Outlook - Q2 2018JLL Louisville Office Outlook - Q2 2018
JLL Louisville Office Outlook - Q2 2018Alex Westcott
 
JLL Pittsburgh Office Insight & Statistics - Q1 2019
JLL Pittsburgh Office Insight & Statistics - Q1 2019JLL Pittsburgh Office Insight & Statistics - Q1 2019
JLL Pittsburgh Office Insight & Statistics - Q1 2019Tobiah Bilski
 
JLL Pittsburgh Office Insight & Statistics - Q3 2021
JLL Pittsburgh Office Insight & Statistics - Q3 2021JLL Pittsburgh Office Insight & Statistics - Q3 2021
JLL Pittsburgh Office Insight & Statistics - Q3 2021Tobiah Bilski
 
Pittsburgh Office Insight & Stats Q4 2021
Pittsburgh Office Insight & Stats Q4 2021Pittsburgh Office Insight & Stats Q4 2021
Pittsburgh Office Insight & Stats Q4 2021Tobiah Bilski
 
JLL Pittsburgh Industrial Insight & Statistics - Q1 2018
JLL Pittsburgh Industrial Insight & Statistics - Q1 2018JLL Pittsburgh Industrial Insight & Statistics - Q1 2018
JLL Pittsburgh Industrial Insight & Statistics - Q1 2018Tobiah Bilski
 
JLL Pittsburgh Office Insight & Statistics - Q2 2021
JLL Pittsburgh Office Insight & Statistics - Q2 2021JLL Pittsburgh Office Insight & Statistics - Q2 2021
JLL Pittsburgh Office Insight & Statistics - Q2 2021Tobiah Bilski
 
JLL Grand Rapids Office Insight & Statistics - Q2 2018
JLL Grand Rapids Office Insight & Statistics - Q2 2018JLL Grand Rapids Office Insight & Statistics - Q2 2018
JLL Grand Rapids Office Insight & Statistics - Q2 2018Harrison West
 
JLL Cleveland Office Outlook: Q1 2017
JLL Cleveland Office Outlook: Q1 2017JLL Cleveland Office Outlook: Q1 2017
JLL Cleveland Office Outlook: Q1 2017Andrew Batson
 
JLL Pittsburgh Industrial Insight & Statistics - Q3 2018
JLL Pittsburgh Industrial Insight & Statistics - Q3 2018JLL Pittsburgh Industrial Insight & Statistics - Q3 2018
JLL Pittsburgh Industrial Insight & Statistics - Q3 2018Tobiah Bilski
 
JLL Grand Rapids Office Insight & Statistics - Q3 2018
JLL Grand Rapids Office Insight & Statistics - Q3 2018JLL Grand Rapids Office Insight & Statistics - Q3 2018
JLL Grand Rapids Office Insight & Statistics - Q3 2018Harrison West
 
JLL Louisville Office Outlook Q4 2017
JLL Louisville Office Outlook Q4 2017JLL Louisville Office Outlook Q4 2017
JLL Louisville Office Outlook Q4 2017Alex Westcott
 
JLL Cleveland Office Outlook: Q4 2017
JLL Cleveland Office Outlook: Q4 2017JLL Cleveland Office Outlook: Q4 2017
JLL Cleveland Office Outlook: Q4 2017Andrew Batson
 
JLL Cleveland Office Outlook: Q4 2020
JLL Cleveland Office Outlook: Q4 2020JLL Cleveland Office Outlook: Q4 2020
JLL Cleveland Office Outlook: Q4 2020Andrew Batson
 
JLL Columbus Office Outlook: Q2 2016
JLL Columbus Office Outlook: Q2 2016JLL Columbus Office Outlook: Q2 2016
JLL Columbus Office Outlook: Q2 2016Peter McStravick
 
JLL Pittsburgh Industrial Insight & Statistics - Q2 2018
JLL Pittsburgh Industrial Insight & Statistics - Q2 2018JLL Pittsburgh Industrial Insight & Statistics - Q2 2018
JLL Pittsburgh Industrial Insight & Statistics - Q2 2018Tobiah Bilski
 

Similar to JLL Pittsburgh Office Insight & Statistics - Q1 2017 (20)

JLL Pittsburgh Office Insight & Statistics - Q1 2018
JLL Pittsburgh Office Insight & Statistics - Q1 2018JLL Pittsburgh Office Insight & Statistics - Q1 2018
JLL Pittsburgh Office Insight & Statistics - Q1 2018
 
JLL Pittsburgh Office Insight & Statistics - Q4 2017
JLL Pittsburgh Office Insight & Statistics - Q4 2017JLL Pittsburgh Office Insight & Statistics - Q4 2017
JLL Pittsburgh Office Insight & Statistics - Q4 2017
 
JLL Pittsburgh Office Insight & Statistics - Q4 2019
JLL Pittsburgh Office Insight & Statistics - Q4 2019JLL Pittsburgh Office Insight & Statistics - Q4 2019
JLL Pittsburgh Office Insight & Statistics - Q4 2019
 
JLL Pittsburgh Office Insight & Statistics - Q3 2018
JLL Pittsburgh Office Insight & Statistics - Q3 2018JLL Pittsburgh Office Insight & Statistics - Q3 2018
JLL Pittsburgh Office Insight & Statistics - Q3 2018
 
JLL Louisville Office Outlook - Q2 2018
JLL Louisville Office Outlook - Q2 2018JLL Louisville Office Outlook - Q2 2018
JLL Louisville Office Outlook - Q2 2018
 
JLL Pittsburgh Office Insight & Statistics - Q1 2019
JLL Pittsburgh Office Insight & Statistics - Q1 2019JLL Pittsburgh Office Insight & Statistics - Q1 2019
JLL Pittsburgh Office Insight & Statistics - Q1 2019
 
JLL Pittsburgh Office Insight & Statistics - Q3 2021
JLL Pittsburgh Office Insight & Statistics - Q3 2021JLL Pittsburgh Office Insight & Statistics - Q3 2021
JLL Pittsburgh Office Insight & Statistics - Q3 2021
 
Pittsburgh Office Insight & Stats Q4 2021
Pittsburgh Office Insight & Stats Q4 2021Pittsburgh Office Insight & Stats Q4 2021
Pittsburgh Office Insight & Stats Q4 2021
 
JLL Pittsburgh Industrial Insight & Statistics - Q1 2018
JLL Pittsburgh Industrial Insight & Statistics - Q1 2018JLL Pittsburgh Industrial Insight & Statistics - Q1 2018
JLL Pittsburgh Industrial Insight & Statistics - Q1 2018
 
JLL Pittsburgh Office Insight & Statistics - Q2 2021
JLL Pittsburgh Office Insight & Statistics - Q2 2021JLL Pittsburgh Office Insight & Statistics - Q2 2021
JLL Pittsburgh Office Insight & Statistics - Q2 2021
 
JLL Grand Rapids Office Insight & Statistics - Q2 2018
JLL Grand Rapids Office Insight & Statistics - Q2 2018JLL Grand Rapids Office Insight & Statistics - Q2 2018
JLL Grand Rapids Office Insight & Statistics - Q2 2018
 
JLL Cleveland Office Outlook: Q1 2017
JLL Cleveland Office Outlook: Q1 2017JLL Cleveland Office Outlook: Q1 2017
JLL Cleveland Office Outlook: Q1 2017
 
JLL Pittsburgh Industrial Insight & Statistics - Q3 2018
JLL Pittsburgh Industrial Insight & Statistics - Q3 2018JLL Pittsburgh Industrial Insight & Statistics - Q3 2018
JLL Pittsburgh Industrial Insight & Statistics - Q3 2018
 
Q3 SV Office
Q3 SV OfficeQ3 SV Office
Q3 SV Office
 
JLL Grand Rapids Office Insight & Statistics - Q3 2018
JLL Grand Rapids Office Insight & Statistics - Q3 2018JLL Grand Rapids Office Insight & Statistics - Q3 2018
JLL Grand Rapids Office Insight & Statistics - Q3 2018
 
JLL Louisville Office Outlook Q4 2017
JLL Louisville Office Outlook Q4 2017JLL Louisville Office Outlook Q4 2017
JLL Louisville Office Outlook Q4 2017
 
JLL Cleveland Office Outlook: Q4 2017
JLL Cleveland Office Outlook: Q4 2017JLL Cleveland Office Outlook: Q4 2017
JLL Cleveland Office Outlook: Q4 2017
 
JLL Cleveland Office Outlook: Q4 2020
JLL Cleveland Office Outlook: Q4 2020JLL Cleveland Office Outlook: Q4 2020
JLL Cleveland Office Outlook: Q4 2020
 
JLL Columbus Office Outlook: Q2 2016
JLL Columbus Office Outlook: Q2 2016JLL Columbus Office Outlook: Q2 2016
JLL Columbus Office Outlook: Q2 2016
 
JLL Pittsburgh Industrial Insight & Statistics - Q2 2018
JLL Pittsburgh Industrial Insight & Statistics - Q2 2018JLL Pittsburgh Industrial Insight & Statistics - Q2 2018
JLL Pittsburgh Industrial Insight & Statistics - Q2 2018
 

More from Tobiah Bilski

JLL Pittsburgh Industrial Insight & Statistics - Q4 2021
JLL Pittsburgh Industrial Insight & Statistics - Q4 2021JLL Pittsburgh Industrial Insight & Statistics - Q4 2021
JLL Pittsburgh Industrial Insight & Statistics - Q4 2021Tobiah Bilski
 
JLL Pittsburgh Industrial Insight & Statistics - Q3 2021
JLL Pittsburgh Industrial Insight & Statistics - Q3 2021JLL Pittsburgh Industrial Insight & Statistics - Q3 2021
JLL Pittsburgh Industrial Insight & Statistics - Q3 2021Tobiah Bilski
 
JLL Pittsburgh Industrial Insight & Statistics - Q2 2021
JLL Pittsburgh Industrial Insight & Statistics - Q2 2021JLL Pittsburgh Industrial Insight & Statistics - Q2 2021
JLL Pittsburgh Industrial Insight & Statistics - Q2 2021Tobiah Bilski
 
JLL Pittsburgh Industrial Insight & Statistics - Q1 2021
JLL Pittsburgh Industrial Insight & Statistics - Q1 2021JLL Pittsburgh Industrial Insight & Statistics - Q1 2021
JLL Pittsburgh Industrial Insight & Statistics - Q1 2021Tobiah Bilski
 
JLL Pittsburgh Office Insight & Statistics - Q1 2021
JLL Pittsburgh Office Insight & Statistics - Q1 2021JLL Pittsburgh Office Insight & Statistics - Q1 2021
JLL Pittsburgh Office Insight & Statistics - Q1 2021Tobiah Bilski
 
JLL Pittsburgh Industrial Insight & Statistics - Q4 2020
JLL Pittsburgh Industrial Insight & Statistics - Q4 2020JLL Pittsburgh Industrial Insight & Statistics - Q4 2020
JLL Pittsburgh Industrial Insight & Statistics - Q4 2020Tobiah Bilski
 
JLL Pittsburgh Industrial Insight & Statistics - Q3 2020
JLL Pittsburgh Industrial Insight & Statistics - Q3 2020JLL Pittsburgh Industrial Insight & Statistics - Q3 2020
JLL Pittsburgh Industrial Insight & Statistics - Q3 2020Tobiah Bilski
 
JLL Pittsburgh Industrial Insight & Statistics - Q2 2020
JLL Pittsburgh Industrial Insight & Statistics - Q2 2020JLL Pittsburgh Industrial Insight & Statistics - Q2 2020
JLL Pittsburgh Industrial Insight & Statistics - Q2 2020Tobiah Bilski
 
JLL Pittsburgh Industrial Insight & Statistics - Q1 2020
JLL Pittsburgh Industrial Insight & Statistics - Q1 2020JLL Pittsburgh Industrial Insight & Statistics - Q1 2020
JLL Pittsburgh Industrial Insight & Statistics - Q1 2020Tobiah Bilski
 
JLL Pittsburgh Industrial Insight & Statistics - Q4 2019
JLL Pittsburgh Industrial Insight & Statistics - Q4 2019JLL Pittsburgh Industrial Insight & Statistics - Q4 2019
JLL Pittsburgh Industrial Insight & Statistics - Q4 2019Tobiah Bilski
 
JLL Pittsburgh Industrial Insight & Statistics - Q3 2019
JLL Pittsburgh Industrial Insight & Statistics - Q3 2019JLL Pittsburgh Industrial Insight & Statistics - Q3 2019
JLL Pittsburgh Industrial Insight & Statistics - Q3 2019Tobiah Bilski
 
JLL Pittsburgh Industrial Insight & Statistics - Q2 2019
JLL Pittsburgh Industrial Insight & Statistics - Q2 2019JLL Pittsburgh Industrial Insight & Statistics - Q2 2019
JLL Pittsburgh Industrial Insight & Statistics - Q2 2019Tobiah Bilski
 
JLL Pittsburgh Industrial Insight & Statistics - Q1 2019
JLL Pittsburgh Industrial Insight & Statistics - Q1 2019JLL Pittsburgh Industrial Insight & Statistics - Q1 2019
JLL Pittsburgh Industrial Insight & Statistics - Q1 2019Tobiah Bilski
 
JLL Pittsburgh Industrial Insight & Statistics - Q4 2018
JLL Pittsburgh Industrial Insight & Statistics - Q4 2018JLL Pittsburgh Industrial Insight & Statistics - Q4 2018
JLL Pittsburgh Industrial Insight & Statistics - Q4 2018Tobiah Bilski
 

More from Tobiah Bilski (14)

JLL Pittsburgh Industrial Insight & Statistics - Q4 2021
JLL Pittsburgh Industrial Insight & Statistics - Q4 2021JLL Pittsburgh Industrial Insight & Statistics - Q4 2021
JLL Pittsburgh Industrial Insight & Statistics - Q4 2021
 
JLL Pittsburgh Industrial Insight & Statistics - Q3 2021
JLL Pittsburgh Industrial Insight & Statistics - Q3 2021JLL Pittsburgh Industrial Insight & Statistics - Q3 2021
JLL Pittsburgh Industrial Insight & Statistics - Q3 2021
 
JLL Pittsburgh Industrial Insight & Statistics - Q2 2021
JLL Pittsburgh Industrial Insight & Statistics - Q2 2021JLL Pittsburgh Industrial Insight & Statistics - Q2 2021
JLL Pittsburgh Industrial Insight & Statistics - Q2 2021
 
JLL Pittsburgh Industrial Insight & Statistics - Q1 2021
JLL Pittsburgh Industrial Insight & Statistics - Q1 2021JLL Pittsburgh Industrial Insight & Statistics - Q1 2021
JLL Pittsburgh Industrial Insight & Statistics - Q1 2021
 
JLL Pittsburgh Office Insight & Statistics - Q1 2021
JLL Pittsburgh Office Insight & Statistics - Q1 2021JLL Pittsburgh Office Insight & Statistics - Q1 2021
JLL Pittsburgh Office Insight & Statistics - Q1 2021
 
JLL Pittsburgh Industrial Insight & Statistics - Q4 2020
JLL Pittsburgh Industrial Insight & Statistics - Q4 2020JLL Pittsburgh Industrial Insight & Statistics - Q4 2020
JLL Pittsburgh Industrial Insight & Statistics - Q4 2020
 
JLL Pittsburgh Industrial Insight & Statistics - Q3 2020
JLL Pittsburgh Industrial Insight & Statistics - Q3 2020JLL Pittsburgh Industrial Insight & Statistics - Q3 2020
JLL Pittsburgh Industrial Insight & Statistics - Q3 2020
 
JLL Pittsburgh Industrial Insight & Statistics - Q2 2020
JLL Pittsburgh Industrial Insight & Statistics - Q2 2020JLL Pittsburgh Industrial Insight & Statistics - Q2 2020
JLL Pittsburgh Industrial Insight & Statistics - Q2 2020
 
JLL Pittsburgh Industrial Insight & Statistics - Q1 2020
JLL Pittsburgh Industrial Insight & Statistics - Q1 2020JLL Pittsburgh Industrial Insight & Statistics - Q1 2020
JLL Pittsburgh Industrial Insight & Statistics - Q1 2020
 
JLL Pittsburgh Industrial Insight & Statistics - Q4 2019
JLL Pittsburgh Industrial Insight & Statistics - Q4 2019JLL Pittsburgh Industrial Insight & Statistics - Q4 2019
JLL Pittsburgh Industrial Insight & Statistics - Q4 2019
 
JLL Pittsburgh Industrial Insight & Statistics - Q3 2019
JLL Pittsburgh Industrial Insight & Statistics - Q3 2019JLL Pittsburgh Industrial Insight & Statistics - Q3 2019
JLL Pittsburgh Industrial Insight & Statistics - Q3 2019
 
JLL Pittsburgh Industrial Insight & Statistics - Q2 2019
JLL Pittsburgh Industrial Insight & Statistics - Q2 2019JLL Pittsburgh Industrial Insight & Statistics - Q2 2019
JLL Pittsburgh Industrial Insight & Statistics - Q2 2019
 
JLL Pittsburgh Industrial Insight & Statistics - Q1 2019
JLL Pittsburgh Industrial Insight & Statistics - Q1 2019JLL Pittsburgh Industrial Insight & Statistics - Q1 2019
JLL Pittsburgh Industrial Insight & Statistics - Q1 2019
 
JLL Pittsburgh Industrial Insight & Statistics - Q4 2018
JLL Pittsburgh Industrial Insight & Statistics - Q4 2018JLL Pittsburgh Industrial Insight & Statistics - Q4 2018
JLL Pittsburgh Industrial Insight & Statistics - Q4 2018
 

Recently uploaded

Greater Vancouver Realtors Statistics Package April 2024
Greater Vancouver Realtors Statistics Package April 2024Greater Vancouver Realtors Statistics Package April 2024
Greater Vancouver Realtors Statistics Package April 2024VickyAulakh1
 
call girls in ganesh nagar Delhi 8264348440 ✅ call girls ❤️
call girls in ganesh nagar Delhi 8264348440 ✅ call girls ❤️call girls in ganesh nagar Delhi 8264348440 ✅ call girls ❤️
call girls in ganesh nagar Delhi 8264348440 ✅ call girls ❤️soniya singh
 
Mahindra Happinest Tathawade Pune Brochure.pdf
Mahindra Happinest Tathawade Pune Brochure.pdfMahindra Happinest Tathawade Pune Brochure.pdf
Mahindra Happinest Tathawade Pune Brochure.pdfBabyrudram
 
Kohinoor Hinjewadi Phase 2 Pune E-Brochure.pdf
Kohinoor Hinjewadi Phase 2 Pune  E-Brochure.pdfKohinoor Hinjewadi Phase 2 Pune  E-Brochure.pdf
Kohinoor Hinjewadi Phase 2 Pune E-Brochure.pdfManishSaxena95
 
Call Girls in laxmi Nagar Delhi 💯Call Us 🔝 9582086666🔝 South Delhi Escorts Se...
Call Girls in laxmi Nagar Delhi 💯Call Us 🔝 9582086666🔝 South Delhi Escorts Se...Call Girls in laxmi Nagar Delhi 💯Call Us 🔝 9582086666🔝 South Delhi Escorts Se...
Call Girls in laxmi Nagar Delhi 💯Call Us 🔝 9582086666🔝 South Delhi Escorts Se...delhimodel235
 
Premium Villa Projects in Sarjapur Road Bengaluru
Premium Villa Projects in Sarjapur Road BengaluruPremium Villa Projects in Sarjapur Road Bengaluru
Premium Villa Projects in Sarjapur Road BengaluruShivaSeo3
 
Girls in Kalyanpuri }Delhi↫8447779280↬Escort Service. In Delhi NCR
Girls in Kalyanpuri }Delhi↫8447779280↬Escort Service. In Delhi NCRGirls in Kalyanpuri }Delhi↫8447779280↬Escort Service. In Delhi NCR
Girls in Kalyanpuri }Delhi↫8447779280↬Escort Service. In Delhi NCRasmaqueen5
 
Call Girls In Chand Nagar (Delhi)+918447779280 Welcome To Vip Women Seeking M...
Call Girls In Chand Nagar (Delhi)+918447779280 Welcome To Vip Women Seeking M...Call Girls In Chand Nagar (Delhi)+918447779280 Welcome To Vip Women Seeking M...
Call Girls In Chand Nagar (Delhi)+918447779280 Welcome To Vip Women Seeking M...asmaqueen5
 
Shapoorji Pallonji Joyville Vista Pune | Spend Your Family Time Together
Shapoorji Pallonji Joyville Vista Pune | Spend Your Family Time TogetherShapoorji Pallonji Joyville Vista Pune | Spend Your Family Time Together
Shapoorji Pallonji Joyville Vista Pune | Spend Your Family Time Togetheraidasheikh47
 
Call Girls In Laxmi Nagar Delhi +91-8447779280! !Best Woman Seeking Man Escor...
Call Girls In Laxmi Nagar Delhi +91-8447779280! !Best Woman Seeking Man Escor...Call Girls In Laxmi Nagar Delhi +91-8447779280! !Best Woman Seeking Man Escor...
Call Girls In Laxmi Nagar Delhi +91-8447779280! !Best Woman Seeking Man Escor...asmaqueen5
 
Call Girls in Noida Sector 13 Noida 💯Call Us 🔝 9582086666 🔝 South Delhi Escor...
Call Girls in Noida Sector 13 Noida 💯Call Us 🔝 9582086666 🔝 South Delhi Escor...Call Girls in Noida Sector 13 Noida 💯Call Us 🔝 9582086666 🔝 South Delhi Escor...
Call Girls in Noida Sector 13 Noida 💯Call Us 🔝 9582086666 🔝 South Delhi Escor...delhimodel235
 
BDSM⚡Call Girls in Sector 57 Noida Escorts >༒8448380779 Escort Service
BDSM⚡Call Girls in Sector 57 Noida Escorts >༒8448380779 Escort ServiceBDSM⚡Call Girls in Sector 57 Noida Escorts >༒8448380779 Escort Service
BDSM⚡Call Girls in Sector 57 Noida Escorts >༒8448380779 Escort ServiceDelhi Call girls
 
9990771857 Call Girls in Dwarka Sector 6 Delhi (Call Girls) Delhi
9990771857 Call Girls in Dwarka Sector 6 Delhi (Call Girls) Delhi9990771857 Call Girls in Dwarka Sector 6 Delhi (Call Girls) Delhi
9990771857 Call Girls in Dwarka Sector 6 Delhi (Call Girls) Delhidelhimodel235
 
M3M The Line Brochure - Premium Investment Opportunity for Commercial Ventures
M3M The Line Brochure - Premium Investment Opportunity for Commercial VenturesM3M The Line Brochure - Premium Investment Opportunity for Commercial Ventures
M3M The Line Brochure - Premium Investment Opportunity for Commercial Venturessheltercareglobal
 
Call Girls In Mayur Vihar Delhi ☆↫8447779280 ❤Escorts Service In Delhi
Call Girls In Mayur Vihar Delhi ☆↫8447779280 ❤Escorts Service In DelhiCall Girls In Mayur Vihar Delhi ☆↫8447779280 ❤Escorts Service In Delhi
Call Girls In Mayur Vihar Delhi ☆↫8447779280 ❤Escorts Service In Delhiasmaqueen5
 
Majestique Viman Nagar Pune Brochure.pdf
Majestique Viman Nagar Pune Brochure.pdfMajestique Viman Nagar Pune Brochure.pdf
Majestique Viman Nagar Pune Brochure.pdfBabyrudram
 
Telibagh & Call Girls Lucknow - 450+ Call Girl Cash Payment 🎂 8923113531 🎪 Ne...
Telibagh & Call Girls Lucknow - 450+ Call Girl Cash Payment 🎂 8923113531 🎪 Ne...Telibagh & Call Girls Lucknow - 450+ Call Girl Cash Payment 🎂 8923113531 🎪 Ne...
Telibagh & Call Girls Lucknow - 450+ Call Girl Cash Payment 🎂 8923113531 🎪 Ne...gurkirankumar98700
 
Properties for Sale in Istanbul with Schools and Parks | Antalya Development
Properties for Sale in Istanbul with Schools and Parks | Antalya DevelopmentProperties for Sale in Istanbul with Schools and Parks | Antalya Development
Properties for Sale in Istanbul with Schools and Parks | Antalya DevelopmentAntalya Development
 
Kohinoor Flats In Hinjewadi Phase 2 | Homes Built To Suit Your Needs
Kohinoor Flats In Hinjewadi Phase 2 | Homes Built To Suit Your NeedsKohinoor Flats In Hinjewadi Phase 2 | Homes Built To Suit Your Needs
Kohinoor Flats In Hinjewadi Phase 2 | Homes Built To Suit Your Needsaidasheikh47
 
M3M 129 E Brochure Noida Expressway, Sector 129, Noida
M3M 129 E Brochure Noida Expressway, Sector 129, NoidaM3M 129 E Brochure Noida Expressway, Sector 129, Noida
M3M 129 E Brochure Noida Expressway, Sector 129, Noidasarak0han45400
 

Recently uploaded (20)

Greater Vancouver Realtors Statistics Package April 2024
Greater Vancouver Realtors Statistics Package April 2024Greater Vancouver Realtors Statistics Package April 2024
Greater Vancouver Realtors Statistics Package April 2024
 
call girls in ganesh nagar Delhi 8264348440 ✅ call girls ❤️
call girls in ganesh nagar Delhi 8264348440 ✅ call girls ❤️call girls in ganesh nagar Delhi 8264348440 ✅ call girls ❤️
call girls in ganesh nagar Delhi 8264348440 ✅ call girls ❤️
 
Mahindra Happinest Tathawade Pune Brochure.pdf
Mahindra Happinest Tathawade Pune Brochure.pdfMahindra Happinest Tathawade Pune Brochure.pdf
Mahindra Happinest Tathawade Pune Brochure.pdf
 
Kohinoor Hinjewadi Phase 2 Pune E-Brochure.pdf
Kohinoor Hinjewadi Phase 2 Pune  E-Brochure.pdfKohinoor Hinjewadi Phase 2 Pune  E-Brochure.pdf
Kohinoor Hinjewadi Phase 2 Pune E-Brochure.pdf
 
Call Girls in laxmi Nagar Delhi 💯Call Us 🔝 9582086666🔝 South Delhi Escorts Se...
Call Girls in laxmi Nagar Delhi 💯Call Us 🔝 9582086666🔝 South Delhi Escorts Se...Call Girls in laxmi Nagar Delhi 💯Call Us 🔝 9582086666🔝 South Delhi Escorts Se...
Call Girls in laxmi Nagar Delhi 💯Call Us 🔝 9582086666🔝 South Delhi Escorts Se...
 
Premium Villa Projects in Sarjapur Road Bengaluru
Premium Villa Projects in Sarjapur Road BengaluruPremium Villa Projects in Sarjapur Road Bengaluru
Premium Villa Projects in Sarjapur Road Bengaluru
 
Girls in Kalyanpuri }Delhi↫8447779280↬Escort Service. In Delhi NCR
Girls in Kalyanpuri }Delhi↫8447779280↬Escort Service. In Delhi NCRGirls in Kalyanpuri }Delhi↫8447779280↬Escort Service. In Delhi NCR
Girls in Kalyanpuri }Delhi↫8447779280↬Escort Service. In Delhi NCR
 
Call Girls In Chand Nagar (Delhi)+918447779280 Welcome To Vip Women Seeking M...
Call Girls In Chand Nagar (Delhi)+918447779280 Welcome To Vip Women Seeking M...Call Girls In Chand Nagar (Delhi)+918447779280 Welcome To Vip Women Seeking M...
Call Girls In Chand Nagar (Delhi)+918447779280 Welcome To Vip Women Seeking M...
 
Shapoorji Pallonji Joyville Vista Pune | Spend Your Family Time Together
Shapoorji Pallonji Joyville Vista Pune | Spend Your Family Time TogetherShapoorji Pallonji Joyville Vista Pune | Spend Your Family Time Together
Shapoorji Pallonji Joyville Vista Pune | Spend Your Family Time Together
 
Call Girls In Laxmi Nagar Delhi +91-8447779280! !Best Woman Seeking Man Escor...
Call Girls In Laxmi Nagar Delhi +91-8447779280! !Best Woman Seeking Man Escor...Call Girls In Laxmi Nagar Delhi +91-8447779280! !Best Woman Seeking Man Escor...
Call Girls In Laxmi Nagar Delhi +91-8447779280! !Best Woman Seeking Man Escor...
 
Call Girls in Noida Sector 13 Noida 💯Call Us 🔝 9582086666 🔝 South Delhi Escor...
Call Girls in Noida Sector 13 Noida 💯Call Us 🔝 9582086666 🔝 South Delhi Escor...Call Girls in Noida Sector 13 Noida 💯Call Us 🔝 9582086666 🔝 South Delhi Escor...
Call Girls in Noida Sector 13 Noida 💯Call Us 🔝 9582086666 🔝 South Delhi Escor...
 
BDSM⚡Call Girls in Sector 57 Noida Escorts >༒8448380779 Escort Service
BDSM⚡Call Girls in Sector 57 Noida Escorts >༒8448380779 Escort ServiceBDSM⚡Call Girls in Sector 57 Noida Escorts >༒8448380779 Escort Service
BDSM⚡Call Girls in Sector 57 Noida Escorts >༒8448380779 Escort Service
 
9990771857 Call Girls in Dwarka Sector 6 Delhi (Call Girls) Delhi
9990771857 Call Girls in Dwarka Sector 6 Delhi (Call Girls) Delhi9990771857 Call Girls in Dwarka Sector 6 Delhi (Call Girls) Delhi
9990771857 Call Girls in Dwarka Sector 6 Delhi (Call Girls) Delhi
 
M3M The Line Brochure - Premium Investment Opportunity for Commercial Ventures
M3M The Line Brochure - Premium Investment Opportunity for Commercial VenturesM3M The Line Brochure - Premium Investment Opportunity for Commercial Ventures
M3M The Line Brochure - Premium Investment Opportunity for Commercial Ventures
 
Call Girls In Mayur Vihar Delhi ☆↫8447779280 ❤Escorts Service In Delhi
Call Girls In Mayur Vihar Delhi ☆↫8447779280 ❤Escorts Service In DelhiCall Girls In Mayur Vihar Delhi ☆↫8447779280 ❤Escorts Service In Delhi
Call Girls In Mayur Vihar Delhi ☆↫8447779280 ❤Escorts Service In Delhi
 
Majestique Viman Nagar Pune Brochure.pdf
Majestique Viman Nagar Pune Brochure.pdfMajestique Viman Nagar Pune Brochure.pdf
Majestique Viman Nagar Pune Brochure.pdf
 
Telibagh & Call Girls Lucknow - 450+ Call Girl Cash Payment 🎂 8923113531 🎪 Ne...
Telibagh & Call Girls Lucknow - 450+ Call Girl Cash Payment 🎂 8923113531 🎪 Ne...Telibagh & Call Girls Lucknow - 450+ Call Girl Cash Payment 🎂 8923113531 🎪 Ne...
Telibagh & Call Girls Lucknow - 450+ Call Girl Cash Payment 🎂 8923113531 🎪 Ne...
 
Properties for Sale in Istanbul with Schools and Parks | Antalya Development
Properties for Sale in Istanbul with Schools and Parks | Antalya DevelopmentProperties for Sale in Istanbul with Schools and Parks | Antalya Development
Properties for Sale in Istanbul with Schools and Parks | Antalya Development
 
Kohinoor Flats In Hinjewadi Phase 2 | Homes Built To Suit Your Needs
Kohinoor Flats In Hinjewadi Phase 2 | Homes Built To Suit Your NeedsKohinoor Flats In Hinjewadi Phase 2 | Homes Built To Suit Your Needs
Kohinoor Flats In Hinjewadi Phase 2 | Homes Built To Suit Your Needs
 
M3M 129 E Brochure Noida Expressway, Sector 129, Noida
M3M 129 E Brochure Noida Expressway, Sector 129, NoidaM3M 129 E Brochure Noida Expressway, Sector 129, Noida
M3M 129 E Brochure Noida Expressway, Sector 129, Noida
 

JLL Pittsburgh Office Insight & Statistics - Q1 2017

  • 1. © 2017 Jones Lang LaSalle IP, Inc. All rights reserved. All information contained herein is from sources deemed reliable; however, no representation or warranty is made to the accuracy thereof. Q1 2017 Pittsburgh Office Insight A more specialized form of technology is emerging quickly in Pittsburgh: robotics. Carnegie Mellon University (CMU), located in the Oakland / East End submarket, has been home to the Robotics Institute since 1979. However, the latest flurry of activity from Uber, Amazon, and the recently funded Argo (Ford), continue to make the point that being close to the robotics research coming from CMU is key. Being one of the top 10 universities in the world for technology, and ranking number one in the nation for computer science graduate studies, CMU has helped build technology company office demand in the region. The technology job sector in Pittsburgh is now the fastest growing industry at 4.3 percent year-over-year from 2015, outpacing the United States at just 3.4 percent. The growth in technology jobs has attracted a younger demographic as well. The ten year period from 2005 to 2015 in Pittsburgh showed an increase in the population of 25 to 34 year olds at 20.2 percent, reversing the previously lamented “brain drain.” Law firms and financial institutions occupy the majority of space in the CBD, but the Fringe has quickly transformed into the technology submarket, with over 240,000 square feet of office space taken by technology firms in 2016. Outlook Leasing activity is primarily focused on Class A space and the need for quality space is driving redevelopment. In the urban submarkets, as office buildings trade, aggressive underwriting will continue to increase rental rates. The increasing rental rates were slightly outpaced by overall vacancy rates at the end of 2016, whereas overall vacancy hit a six year high at 16.6 percent. Despite the higher vacancy rate, outside investment continues to enter Pittsburgh in 2017 with the first quarter sale of 11 Stanwix for $81.0 million. Fundamentals Forecast YTD net absorption 156,629 s.f. ▲ Under construction 399,574 s.f. ▲ Total vacancy 16.3% ▼ Average asking rent (gross) $23.12 p.s.f. ▲ Concessions Stable ▶ 0 500,000 1,000,000 2013 2014 2015 2016 YTD 2017 Supply and demand (s.f.) Net absorption Deliveries Investment continues to flow into Pittsburgh while office demand from tech companies grows 15.9% 15.9% 15.8% 16.6% 16.3% 2013 2014 2015 2016 2017 Total vacancy $0.00 $10.00 $20.00 $30.00 2013 2014 2015 2016 2017 Average asking rents ($/s.f.) Class A Class B For more information, contact: Tobiah Bilski | tobiah.bilski@am.jll.com • Automation and robotics continue to drive office activity forward, especially in the Fringe submarket. • With limited large block quality space in the CBD submarket, the Fringe is experiencing a surge of activity and attention. • Urban submarkets continue to take the lion’s share of tenant activity, and the suburban submarkets, like the East, at 34.2 percent vacancy, are taking a hit.
  • 2. © 2017 Jones Lang LaSalle IP, Inc. All rights reserved. All information contained herein is from sources deemed reliable; however, no representation or warranty is made to the accuracy thereof. Q1 2017 Pittsburgh Office Statistics For more information, contact: Tobiah Bilski | tobiah.bilski@am.jll.com Class Inventory (s.f.) Total net absorption (s.f.) YTD total net absorption (s.f.) YTD total net absorption (%) Direct vacancy (%) Total vacancy (%) Average direct asking rent ($ p.s.f.) YTD completions (s.f.) Under construction (s.f.) CBD Totals 18,928,135 -116,857 -116,857 -0.6% 12.9% 14.6% $26.03 0 0 Fringe Totals 7,526,595 151,822 151,822 2.0% 10.7% 11.5% $23.26 105,000 37,500 Oakland/East End Totals 1,993,356 61,037 61,037 3.1% 5.1% 5.3% $33.16 0 0 Urban Totals 28,448,086 96,002 96,002 0.3% 11.8% 13.1% $25.52 105,000 37,500 North Totals 3,417,734 -58,539 -58,539 -1.7% 10.7% 11.3% $21.35 0 193,000 Northern I-79/Cranberry Totals 3,442,781 39,042 39,042 1.1% 10.6% 15.4% $23.97 0 89,074 East Totals 3,045,135 55,960 55,960 1.8% 32.4% 34.2% $20.22 0 0 South Totals 2,267,259 -45,344 -45,344 -2.0% 10.7% 12.4% $20.41 0 80,000 Southpointe Totals 2,822,107 34,480 34,480 1.2% 22.5% 26.4% $22.75 0 0 West Totals 6,912,426 35,028 35,028 0.5% 20.0% 21.3% $21.05 0 0 Suburban Totals 21,907,442 60,627 60,627 0.3% 18.1% 20.3% $21.30 0 362,074 Pittsburgh Totals 50,355,528 156,629 156,629 0.3% 14.5% 16.3% $23.12 105,000 399,574 CBD A 13,102,880 -33,301 -33,301 -0.3% 9.9% 12.2% $29.22 0 0 Fringe A 1,905,907 -17,682 -17,682 -0.9% 4.0% 6.5% $24.07 105,000 0 Oakland/East End A 969,243 47,227 47,227 4.9% 8.8% 9.2% $34.97 0 0 Urban A 15,978,030 -3,756 -3,756 0.0% 9.1% 11.3% $29.25 105,000 0 North A 706,347 -32,557 -32,557 -4.6% 11.6% 14.0% $24.61 0 193,000 Northern I-79/Cranberry A 2,766,249 -11,888 -11,888 -0.4% 10.0% 14.1% $24.66 0 0 East A 1,580,784 68,911 68,911 4.4% 28.5% 29.8% $22.42 0 0 South A 0 0 0 0.0% 0.0% 0.0% $0.00 0 80,000 Southpointe A 1,759,754 19,045 19,045 1.1% 15.0% 19.7% $23.64 0 0 West A 3,767,504 -6,443 -6,443 -0.2% 17.4% 19.8% $22.78 0 0 Suburban A 10,580,638 37,068 37,068 0.4% 16.3% 19.4% $23.40 0 273,000 Pittsburgh A 26,558,668 33,312 33,312 0.1% 12.0% 14.5% $25.98 105,000 273,000 CBD B 5,825,255 -83,556 -83,556 -1.4% 19.5% 20.1% $22.05 0 0 Fringe B 5,620,688 169,504 169,504 3.0% 13.0% 13.2% $23.17 0 37,500 Oakland/East End B 1,024,113 13,810 13,810 1.3% 1.6% 1.6% $23.86 0 0 Urban B 12,470,056 99,758 99,758 0.8% 15.1% 15.4% $22.53 0 37,500 North B 2,711,387 -25,982 -25,982 -1.0% 10.5% 10.6% $18.21 0 0 Northern I-79/Cranberry B 676,532 50,930 50,930 7.5% 12.9% 20.7% $21.73 0 89,074 East B 1,464,351 -12,951 -12,951 -0.9% 36.6% 38.9% $18.36 0 0 South B 2,267,259 -45,344 -45,344 -2.0% 10.7% 12.4% $20.41 0 0 Southpointe B 1,062,353 15,435 15,435 1.5% 35.1% 37.5% $22.12 0 0 West B 3,144,922 41,471 41,471 1.3% 23.0% 23.1% $19.43 0 0 Suburban B 11,326,804 23,559 23,559 0.2% 19.8% 21.2% $19.72 0 89,074 Pittsburgh B 23,796,860 123,317 123,317 0.5% 17.4% 18.2% $20.91 0 126,574