SlideShare a Scribd company logo
1 of 6
Download to read offline
ERP differences in facial familiarity processing: early and late components
Introduction
Throughout the advanced history of EEG research, facial perception has become one of the
biggest (and potentially exceptionally important) areas of EEG research. This is likely due to the
usefulness and everyday applicability of facial recognition and analysis amongst human entities. In
particular, the face fusiform area (FFA) within the ventral anterior temporal lobes (near and around EEG1
sites P9 and P10) has been found to react differently to specific types of faces and/or facial orientation
(e.g. inverted faces, animal faces, facial beauty, etc.). Amongst these neural reactions are manipulations2 3 4
in latency and amplitude; one notable early processing component that has been found to change given
different facial stimuli is the N170 component. This is a peak in negative voltage that occurs
approximately 170 milliseconds (ms) after the onset of stimulus. It can, however, change in latency and
amplitude depending on stimuli manipulations and content.
One such content manipulation has been to compare familiar faces with unfamiliar faces. One
study that explored this in a fair amount of detail (Caharel et al. 2002) analyzed N170 differences to the
passive observation of familiar faces, unfamiliar faces, famous faces, and the subject’s own face. Their
results succeeded in showing a familiarity effect 170 ms after stimulus onset (N170) with larger
amplitudes observed for both of the familiar faces in comparison to unfamiliar faces. There were also
other noticeable component differences 250 ms after stimulus onset (P2), where the subject’s own face is
smaller in amplitude to a famous face and even smaller still to unfamiliar faces. The results reported from
their study demonstrate that the human brain (particularly around electrode site P10) takes in facial
stimuli and can encode and modulate internal representations of familiarity, responds to such stimuli (i.e.
familiarity) in a neurally noticeable and observational way, and (overall) that these acquired facial
representations are due to our environment and experiences. Since then, however, many studies , claim5 6
that the N170 component at lateral posterior electrodes is not affected by face familiarity; rather, it is later
components (components approximately 250 ms and onward) where higher cognitive functioning has
been found to occur.
Although a wide range of experimenters are adamant that the N170 component is too early in
facial perceptual processing for higher order mechanisms (i.e. face familiarity) to occur, our experimental
design (similar to that of Caharel et al.) seem to prove otherwise. A familiarity effect was expected when
all of the ERPs elicited from each face were compared; that is, when participants observe a face they are
familiar with, they evoke an N170 with a larger amplitude than when participants observe an unfamiliar
face. Our stimuli consisted of an unknown face, a famous face (familiar), our instructor’s face (familiar),
and the subject’s own face (as viewed from a third person perspective). These stimuli were used in our
first experiment (Exp. 1) and analyzed accordingly. Our experimental design differed from Caharel et al.
however in one crucial way: we used the famous face (President of the U.S.) as a target and asked the
participants to click a button whenever they saw the President’s face (active attention), which differs from
Caharel et al.’s non-interactive viewing design. This study design was used for multiple reasons, but some
of the most important reasons for using such being that this type of design has shown to lead to better
data, as well as to control for attention/awareness issues; that is, if participants are just observing stimuli
passively, it’s difficult to know if or when participants are paying attention to the faces themselves, or
even if their attention is directed at the faces in the first place.
Collins & Olson (2014)1
Sadeh & Yovel (2010)2
Rousselet et al. (2004)3
Schacht et al. (2008)4
Eimer (2000a)5
Eimer (2000b)6
ERP differences in facial familiarity processing: early and late components
Methods
2.1 Subjects
This experiment was a class project for an EEG lab course at Indiana University. All participants
were all students that were registered and were presently taking this course (n=23). The average age for
each subject is around 21 years (a rough range between 20-22 years) with fourteen females and nine
males in total.
2.2. Procedure
ERP data was recorded after the presentation of stimuli, consisting of either an unknown face, a
familiar face, or the subject’s own face. All images were calibrated in a grey scale with an 8cm x 8cm
format. The images were also calibrated in contrast and luminance using Photoshop software. The
participant was placed so that they are four feet from the stimulus display and stimuli displayed in random
order for 1 second after presentation of a fixation cross for 500 ms. An empty grey screen will then be
shown for a 500 ms duration prior to the next fixation onset (a total interstimulus interval of 1 second).
We implemented a ‘passive viewing’ experimental design in order to permit face recognition in a
condition that occurs as naturally as possible, and thereby be ecologically valid, without being subject to
influence from task-related factors that are hard to control.
2.3 Data Acquisition and Analysis
Data was collected from three active Ag/AgCl electrodes applied at the Pz, P9, and P10 scalp
positions using the international 10-20 method of electrode placement. We relied on P9 and P10 (RH)
rather than P7 and P8 (LH) because they have been reported to evoke a larger N170 component. In
addition, a reference electrode was placed on the nose (Nz) and a ground electrode placed on the forehead
(Fz). Prior to placement of the electrodes, alcohol was used to cleanse each electrode site and the skin
surface will be lightly abraded with an abrasive gel in order to reduce impedance of the electrode-skin
contact. The impedances on all electrodes were measured and determined to be less than or equal to 15.0
kΩ before testing. EEG was recorded and analyzed using a Biopac Systems MP36 recording system,
paired with their Acknowledge 4.3 analysis software (Biopac Systems Inc., Goleta, CA). Stimuli were
delivered using a customized script and software package: Presentation, version 16.3 (Neurobehavioral
Systems Inc., Albany, CA) on a Windows PC. Data was recorded in two blocks of five minutes each at a
sampling rate of 1000 Hz, a gain of 10,000, and a band pass filter of 0.5-250 Hz (for the purposes of
detecting muscle artifact). We collected 300 stimuli (roughly 100 presentation of each stimulus). Data was
collected 250 ms pre-stimulus and 1000 ms (1s) post-stimulus. A 48 Hz cutoff digital LP filter was
applied post-recording and artifact rejection was used to skip epochs contaminated by artifact (as
indicated by values greater than 50 µV or less than -50 µV).
Results
Due to the similarity in experimental goals, we adopted a similar experimental design as Caharel
et al. (2002). The researchers in this study presented their participants with 3 different faces: the
participant’s own face (self), the familiar face (the French President - since it was a study done in France),
and an unfamiliar face. The two familiar faces evoked larger N170 amplitudes in comparison to the
unfamiliar face. Along with these changes in early temporal components, later component changes were
also found (P2). Our study also focused on these same temporal regions (N170, P250). There were a few
‘outliers’ within our group (participants that were fairly significantly different in amplitude and/or
latencies), but through graphical and qualitative analysis we concluded that the inclusion of these
individuals would not drastically change the grand average of all 23 participants. Therefore, all
participants’ data were included in our analysis.
ERP differences in facial familiarity processing: early and late components
(A)
(B)
(C)
Figure 1. (A) Graph representing average ERPs for each condition (Self, Fam, Unfam, and
(familiar) Target). (B) Tables displaying average ERP amplitudes across Self, Fam, and Unfam
conditions for each participant. The left four columns display average ERP amplitudes between
150-200 ms (N170 range); the right four columns display average ERP amplitudes between 200-300 ms
(P250 range). SD = standard deviation. (C) Table displaying p-value comparisons between Self &
Fam, Self & Unfam, and Fam &Unfam conditions within temporal regions of interest (N170 and
P250 ranges).
N1
P2
ERP differences in facial familiarity processing: early and late components
3.1 Experiment 1
The first experiment participants engaged in was with stimuli of familiar faces: their own face
(self), a familiar face (our instructor), an unfamiliar face, and a familiar target face (the President). The
grand average ERP amplitudes for each condition across all participants are as follows: Self - 1.30 µV,
Familiar - 1.50 µV, Unfamiliar - 1.70 µV, and Familiar target - 1.12 µV (see Figure 1A for graph and 1B
for individual average ERPs, as well as the mean averages, for each condition). For statistical comparison
between conditions (see Figure 1C), we used a one-way within-subjects ANOVA was conducted to
compare the effect of stimulus condition on ERP amplitude in both 150-200 ms latency and 200-300 ms
latency. There was a significant effect of stimulus condition on amplitude at the p<.05 level for the three
conditions [F(2,19) = 4.67, p = 0.015] in the 150-200 ms range, and even more significant in the 200-300
ms range [F(2,19) = 10.41, p = 0.00025]. A paired samples t-test was also conducted to compare mean
ERP amplitudes in both 150-200 ms as well as 200-300 ms latency range obtained in Self, Fam, and
Unfam conditions. The Familiar condition was not associated with significantly different negative
amplitudes than Unfamiliar condition [t(19) = -2.58, p = 0.056], although it was close to be being so at the
p<.05 threshold. There was, however, a significant effect of Self amplitude with Unfam amplitude at the
p<.05 level for the three conditions [F(2,19) = 4.67. p = 0.001] in the 150-200 ms latency range. In the
200-300 ms latency range, both Self-Fam [t(19) = -2.70, p = 0.042] and Self-Unfam [t(19) = -4.21, p =
0.001] were associated with significantly different amplitudes. All t-Test statistics reported were adjusted
by a scaling factors of three (Bonferroni correction) to compensate for multiple comparisons.
3.2. Experiment 2
In the second experiment, the only difference made was switching the target from a famous
familiar face (the President) to an unfamiliar stranger of the participants’ gender (i.e. male participants
actively looked for and pressed a button for an unfamiliar male face; female participants for an unfamiliar
female face). The graph (Figure 2) shows the average ERPs for each condition (Self, Fam, Unfam, and
(Unfam) Target). This experiment was done so that we could qualitatively analyze the differences in target
data and possible attentional differences. The grand average ERP amplitudes for each condition across all
participants are as follows: Self - 1.39 µV, Familiar - 1.96 µV, Unfamiliar - 1.88 µV, and Unfamiliar target
- 1.26 µV, making the difference between the Familiar target and the unfamiliar target 0.14 µV, it being
more negative in the Familiar target.
Figure 2. Graph representing average ERPs for each condition (Self, Fam, Unfam, and
(unfamiliar) Target). Noteworthy findings include the similarity in amplitude of Target faces between
the two experiments at and around 250 ms range, N170 amplitude differences, as well as amplitude
similarity in and around the 250 ms range between Fam and Unfam.
ERP differences in facial familiarity processing: early and late components
Discussion
Our goal was to test for, and hopefully observe, a familiarity effect across multiple temporal
regions. Our experimental design allows for this due to our chosen stimuli (familiar, unfamiliar, and self)
as well as our active-participant role that each subject was involved in for both experiments. Our results
are similar to that of Caharel et al.: we observed more negative amplitudes in faces with familiarity (see
Figures 1A and 2) with unknown faces having a more positive amplitude (exempting the unknown target
in Exp. 2). Our Exp. 1 data seem to mimic that of Caharel et al. insofar as which presented face issued a
more positive and/or negative amplitude response; if anything, our data seems to be more higher quality
(bigger amplitude differences between each condition) and show a more explicit difference between
conditions.
In Expts 1 and 2, the participants also did a continuous performance target detection task. In the
first task, participants were asked to ‘look for’ the face of the President (classified as a ‘familiar’ face) and
to press a button whenever they saw his face appear on the screen. Recorded data (Figure 1A) showed
that this was the face that provoked the one of the most negative in amplitudes around the N170
component (N1), but especially so around the P250 range (P2). This may seem interesting/unusual by
itself - since one would expect the Self image (the participants’ own face) to give the most ‘familiar’
response (i.e. evoke the most negative response in amplitude) - but when we compare this finding to our
findings in Exp. 2, a different conclusion can be drawn. Although the targets in each Expt. differed in
familiarity, they both had similar ERP components (being most negative in and around P2) and the most
negativity because of the fact that they were targets. We would expect participants to have a similar
reaction to Target faces given the fact that both were being actively ‘searched’ for. Subjects’ reactions to
both were comparable because both familiar and unfamiliar targets elicited similar (for lack of a better
term) ’eureka’ moment once target face was found. In order to clean up this ambiguity in interpretation,
future experiments regarding familiarity should be conducted where target faces include not just a
familiar or unfamiliar face, but have a third experiment where participants are targeting their own face
(Self). If we observe similar negativity as we have in both of our targets within this study, the
aforementioned conclusions increase in their validity.
Overall our findings were successful. We succeeded in finding early component familiarity
effects (Figure 1A, N1) as well as later components (Figure 1A, P2). Although some researchers don’t
find these early component effects on familiarity, I hypothesize that these are merely due to differences in
experimental design. Our design seems to put some strong weight on the relevance of early ERP
components and their involvement in facial recognition and familiarity processing. Early facial processing
components appear to have important beginnings in the categorization of familiarity (i.e. early familiarity
categorization begins roughly around 170 ms) whilst later components (Figure 1A, P2) classify
familiarity differences in much more detail.
ERP differences in facial familiarity processing: early and late components
References
Caharel, S., Poiroux, S., & Bernard, C. (2002). “ERPs associated with familiarity and degree of
familiarity during face recognition.” International Journal of Neuroscience, Vol. 112: pp
1499-1512. DOI: 10.1080/00207450290158368
Collins, Jessica A. & Olson, Ingrid R. (2014). “Beyond the FFA: The role of the ventral anterior temporal
lobes in face processing.” Neuropsychologia, Vol. 61: pp 65-79.
DOI: 10.1016/j.neuropsychologia.2014.06.005
Eimer, Martin (2000a). “Even-related brain potentials distinguish processing stages involved in face
perception and recognition.” Clinical Neuroscience, Vol. 111(4): pp 694-705. DOI: 10.1016/
S1388-2457(99)00285-0
Eimer, Martin (2000b). “Effects of face inversion on the structural encoding and recognition of faces:
Evidence from event-related brain potentials.” Cognitive Brain Research, Vol. 10(1-2): pp
145-58. DOI: 10.1016/S0926-6410(00)00038-0
Rousselet, G. A., Macé, M. J.-M., & Fabre-Thorpe, M. (2004). “Animal and human faces in natural
scenes: How specific to human faces is the N170 ERP component?” Journal of Vision, Vol. 4(1)
DOI: 10.1167/4.1.2
Sadeh, B. & Yovel, G. (2010). “Why is the N170 enhanced for inverted faces? An ERP competition
experiment.” NeuroImage, Vol. 53(2): pp 782-89. DOI: 10.1016/j.neuroimage.2010.06.029
Schacht, A., Werheid, K., & Sommer, W. (2008). “The appraisal of facial beauty if rapid but not
mandatory.” Cognitive, Affective, & Behavioral Neuroscience, Vol. 8(2): pp 132-42. DOI:
10.3758/CABN.8.2.132

More Related Content

Similar to ERP Differences in Early and Late Components for Facial Familiarity Processing

Technique for the Analysis of Evoked and Background EEG Activity applied to Y...
Technique for the Analysis of Evoked and Background EEG Activity applied to Y...Technique for the Analysis of Evoked and Background EEG Activity applied to Y...
Technique for the Analysis of Evoked and Background EEG Activity applied to Y...Craig Goodman, PhD.
 
POWER SPECTRAL ANALYSIS OF EEG AS A POTENTIAL MARKER IN THE DIAGNOSIS OF SPAS...
POWER SPECTRAL ANALYSIS OF EEG AS A POTENTIAL MARKER IN THE DIAGNOSIS OF SPAS...POWER SPECTRAL ANALYSIS OF EEG AS A POTENTIAL MARKER IN THE DIAGNOSIS OF SPAS...
POWER SPECTRAL ANALYSIS OF EEG AS A POTENTIAL MARKER IN THE DIAGNOSIS OF SPAS...ijbesjournal
 
Eva BONDA et al. (1995) Neural correlates of mental transformations of the bo...
Eva BONDA et al. (1995) Neural correlates of mental transformations of the bo...Eva BONDA et al. (1995) Neural correlates of mental transformations of the bo...
Eva BONDA et al. (1995) Neural correlates of mental transformations of the bo...Dr Eva Bonda, PhD
 
INHIBITION AND SET-SHIFTING TASKS IN CENTRAL EXECUTIVE FUNCTION OF WORKING ME...
INHIBITION AND SET-SHIFTING TASKS IN CENTRAL EXECUTIVE FUNCTION OF WORKING ME...INHIBITION AND SET-SHIFTING TASKS IN CENTRAL EXECUTIVE FUNCTION OF WORKING ME...
INHIBITION AND SET-SHIFTING TASKS IN CENTRAL EXECUTIVE FUNCTION OF WORKING ME...sipij
 
Brain research journal regional differences nova
Brain research journal regional differences   nova Brain research journal regional differences   nova
Brain research journal regional differences nova Vladimír Krajča
 
Beta EEG increased during tDCS
Beta EEG increased during tDCSBeta EEG increased during tDCS
Beta EEG increased during tDCSKyongsik Yun
 
1019 Yijung
1019 Yijung1019 Yijung
1019 YijungSally Wu
 
ANALYSIS OF BRAIN COGNITIVE STATE FOR ARITHMETIC TASK AND MOTOR TASK USING EL...
ANALYSIS OF BRAIN COGNITIVE STATE FOR ARITHMETIC TASK AND MOTOR TASK USING EL...ANALYSIS OF BRAIN COGNITIVE STATE FOR ARITHMETIC TASK AND MOTOR TASK USING EL...
ANALYSIS OF BRAIN COGNITIVE STATE FOR ARITHMETIC TASK AND MOTOR TASK USING EL...sipij
 
Vlastos, D., Kyritsis, M., Papaioannou-Spiroulia, A., & Varela V.-A. (2017). ...
Vlastos, D., Kyritsis, M., Papaioannou-Spiroulia, A., & Varela V.-A. (2017). ...Vlastos, D., Kyritsis, M., Papaioannou-Spiroulia, A., & Varela V.-A. (2017). ...
Vlastos, D., Kyritsis, M., Papaioannou-Spiroulia, A., & Varela V.-A. (2017). ...Dimitris Vlastos
 
EXAMINATION OF THE SKIN CONDUCTANCE LEVEL (SCL) AS AN INDEX OF THE ACTIVITY O...
EXAMINATION OF THE SKIN CONDUCTANCE LEVEL (SCL) AS AN INDEX OF THE ACTIVITY O...EXAMINATION OF THE SKIN CONDUCTANCE LEVEL (SCL) AS AN INDEX OF THE ACTIVITY O...
EXAMINATION OF THE SKIN CONDUCTANCE LEVEL (SCL) AS AN INDEX OF THE ACTIVITY O...ijbesjournal
 
Mc intosh 2003
Mc intosh 2003Mc intosh 2003
Mc intosh 2003Jacob Sheu
 
A NALYSIS OF P AIN H EMODYNAMIC R ESPONSE U SING N EAR -I NFRARED S PECTROSCOPY
A NALYSIS OF P AIN H EMODYNAMIC R ESPONSE U SING N EAR -I NFRARED S PECTROSCOPYA NALYSIS OF P AIN H EMODYNAMIC R ESPONSE U SING N EAR -I NFRARED S PECTROSCOPY
A NALYSIS OF P AIN H EMODYNAMIC R ESPONSE U SING N EAR -I NFRARED S PECTROSCOPYijma
 
Can Illusory Deviant Stimuli Be Used As Attentional Distractors To Record V M...
Can Illusory Deviant Stimuli Be Used As Attentional Distractors To Record V M...Can Illusory Deviant Stimuli Be Used As Attentional Distractors To Record V M...
Can Illusory Deviant Stimuli Be Used As Attentional Distractors To Record V M...guest5e4294
 
Positron-emission tomography studies of cross-modality inhibition in selectiv...
Positron-emission tomography studies of cross-modality inhibition in selectiv...Positron-emission tomography studies of cross-modality inhibition in selectiv...
Positron-emission tomography studies of cross-modality inhibition in selectiv...Dr Brendan O'Sullivan
 
StefaniaButaPoster_48X36_3col_black
StefaniaButaPoster_48X36_3col_blackStefaniaButaPoster_48X36_3col_black
StefaniaButaPoster_48X36_3col_blackCandice Jaimungal
 

Similar to ERP Differences in Early and Late Components for Facial Familiarity Processing (20)

Technique for the Analysis of Evoked and Background EEG Activity applied to Y...
Technique for the Analysis of Evoked and Background EEG Activity applied to Y...Technique for the Analysis of Evoked and Background EEG Activity applied to Y...
Technique for the Analysis of Evoked and Background EEG Activity applied to Y...
 
The human thalamus is crucially involved in executive control operations
The human thalamus is crucially involved in executive control operationsThe human thalamus is crucially involved in executive control operations
The human thalamus is crucially involved in executive control operations
 
Stefan_Dukic
Stefan_DukicStefan_Dukic
Stefan_Dukic
 
POWER SPECTRAL ANALYSIS OF EEG AS A POTENTIAL MARKER IN THE DIAGNOSIS OF SPAS...
POWER SPECTRAL ANALYSIS OF EEG AS A POTENTIAL MARKER IN THE DIAGNOSIS OF SPAS...POWER SPECTRAL ANALYSIS OF EEG AS A POTENTIAL MARKER IN THE DIAGNOSIS OF SPAS...
POWER SPECTRAL ANALYSIS OF EEG AS A POTENTIAL MARKER IN THE DIAGNOSIS OF SPAS...
 
Eva BONDA et al. (1995) Neural correlates of mental transformations of the bo...
Eva BONDA et al. (1995) Neural correlates of mental transformations of the bo...Eva BONDA et al. (1995) Neural correlates of mental transformations of the bo...
Eva BONDA et al. (1995) Neural correlates of mental transformations of the bo...
 
INHIBITION AND SET-SHIFTING TASKS IN CENTRAL EXECUTIVE FUNCTION OF WORKING ME...
INHIBITION AND SET-SHIFTING TASKS IN CENTRAL EXECUTIVE FUNCTION OF WORKING ME...INHIBITION AND SET-SHIFTING TASKS IN CENTRAL EXECUTIVE FUNCTION OF WORKING ME...
INHIBITION AND SET-SHIFTING TASKS IN CENTRAL EXECUTIVE FUNCTION OF WORKING ME...
 
Brain research journal regional differences nova
Brain research journal regional differences   nova Brain research journal regional differences   nova
Brain research journal regional differences nova
 
Beta EEG increased during tDCS
Beta EEG increased during tDCSBeta EEG increased during tDCS
Beta EEG increased during tDCS
 
Z4101154159
Z4101154159Z4101154159
Z4101154159
 
1019 Yijung
1019 Yijung1019 Yijung
1019 Yijung
 
ANALYSIS OF BRAIN COGNITIVE STATE FOR ARITHMETIC TASK AND MOTOR TASK USING EL...
ANALYSIS OF BRAIN COGNITIVE STATE FOR ARITHMETIC TASK AND MOTOR TASK USING EL...ANALYSIS OF BRAIN COGNITIVE STATE FOR ARITHMETIC TASK AND MOTOR TASK USING EL...
ANALYSIS OF BRAIN COGNITIVE STATE FOR ARITHMETIC TASK AND MOTOR TASK USING EL...
 
Vlastos, D., Kyritsis, M., Papaioannou-Spiroulia, A., & Varela V.-A. (2017). ...
Vlastos, D., Kyritsis, M., Papaioannou-Spiroulia, A., & Varela V.-A. (2017). ...Vlastos, D., Kyritsis, M., Papaioannou-Spiroulia, A., & Varela V.-A. (2017). ...
Vlastos, D., Kyritsis, M., Papaioannou-Spiroulia, A., & Varela V.-A. (2017). ...
 
EXAMINATION OF THE SKIN CONDUCTANCE LEVEL (SCL) AS AN INDEX OF THE ACTIVITY O...
EXAMINATION OF THE SKIN CONDUCTANCE LEVEL (SCL) AS AN INDEX OF THE ACTIVITY O...EXAMINATION OF THE SKIN CONDUCTANCE LEVEL (SCL) AS AN INDEX OF THE ACTIVITY O...
EXAMINATION OF THE SKIN CONDUCTANCE LEVEL (SCL) AS AN INDEX OF THE ACTIVITY O...
 
Mc intosh 2003
Mc intosh 2003Mc intosh 2003
Mc intosh 2003
 
poster
posterposter
poster
 
A NALYSIS OF P AIN H EMODYNAMIC R ESPONSE U SING N EAR -I NFRARED S PECTROSCOPY
A NALYSIS OF P AIN H EMODYNAMIC R ESPONSE U SING N EAR -I NFRARED S PECTROSCOPYA NALYSIS OF P AIN H EMODYNAMIC R ESPONSE U SING N EAR -I NFRARED S PECTROSCOPY
A NALYSIS OF P AIN H EMODYNAMIC R ESPONSE U SING N EAR -I NFRARED S PECTROSCOPY
 
Can Illusory Deviant Stimuli Be Used As Attentional Distractors To Record V M...
Can Illusory Deviant Stimuli Be Used As Attentional Distractors To Record V M...Can Illusory Deviant Stimuli Be Used As Attentional Distractors To Record V M...
Can Illusory Deviant Stimuli Be Used As Attentional Distractors To Record V M...
 
Can Illusory Deviant Stimuli Be Used As Attentional Distractors To Record V M...
Can Illusory Deviant Stimuli Be Used As Attentional Distractors To Record V M...Can Illusory Deviant Stimuli Be Used As Attentional Distractors To Record V M...
Can Illusory Deviant Stimuli Be Used As Attentional Distractors To Record V M...
 
Positron-emission tomography studies of cross-modality inhibition in selectiv...
Positron-emission tomography studies of cross-modality inhibition in selectiv...Positron-emission tomography studies of cross-modality inhibition in selectiv...
Positron-emission tomography studies of cross-modality inhibition in selectiv...
 
StefaniaButaPoster_48X36_3col_black
StefaniaButaPoster_48X36_3col_blackStefaniaButaPoster_48X36_3col_black
StefaniaButaPoster_48X36_3col_black
 

ERP Differences in Early and Late Components for Facial Familiarity Processing

  • 1. ERP differences in facial familiarity processing: early and late components Introduction Throughout the advanced history of EEG research, facial perception has become one of the biggest (and potentially exceptionally important) areas of EEG research. This is likely due to the usefulness and everyday applicability of facial recognition and analysis amongst human entities. In particular, the face fusiform area (FFA) within the ventral anterior temporal lobes (near and around EEG1 sites P9 and P10) has been found to react differently to specific types of faces and/or facial orientation (e.g. inverted faces, animal faces, facial beauty, etc.). Amongst these neural reactions are manipulations2 3 4 in latency and amplitude; one notable early processing component that has been found to change given different facial stimuli is the N170 component. This is a peak in negative voltage that occurs approximately 170 milliseconds (ms) after the onset of stimulus. It can, however, change in latency and amplitude depending on stimuli manipulations and content. One such content manipulation has been to compare familiar faces with unfamiliar faces. One study that explored this in a fair amount of detail (Caharel et al. 2002) analyzed N170 differences to the passive observation of familiar faces, unfamiliar faces, famous faces, and the subject’s own face. Their results succeeded in showing a familiarity effect 170 ms after stimulus onset (N170) with larger amplitudes observed for both of the familiar faces in comparison to unfamiliar faces. There were also other noticeable component differences 250 ms after stimulus onset (P2), where the subject’s own face is smaller in amplitude to a famous face and even smaller still to unfamiliar faces. The results reported from their study demonstrate that the human brain (particularly around electrode site P10) takes in facial stimuli and can encode and modulate internal representations of familiarity, responds to such stimuli (i.e. familiarity) in a neurally noticeable and observational way, and (overall) that these acquired facial representations are due to our environment and experiences. Since then, however, many studies , claim5 6 that the N170 component at lateral posterior electrodes is not affected by face familiarity; rather, it is later components (components approximately 250 ms and onward) where higher cognitive functioning has been found to occur. Although a wide range of experimenters are adamant that the N170 component is too early in facial perceptual processing for higher order mechanisms (i.e. face familiarity) to occur, our experimental design (similar to that of Caharel et al.) seem to prove otherwise. A familiarity effect was expected when all of the ERPs elicited from each face were compared; that is, when participants observe a face they are familiar with, they evoke an N170 with a larger amplitude than when participants observe an unfamiliar face. Our stimuli consisted of an unknown face, a famous face (familiar), our instructor’s face (familiar), and the subject’s own face (as viewed from a third person perspective). These stimuli were used in our first experiment (Exp. 1) and analyzed accordingly. Our experimental design differed from Caharel et al. however in one crucial way: we used the famous face (President of the U.S.) as a target and asked the participants to click a button whenever they saw the President’s face (active attention), which differs from Caharel et al.’s non-interactive viewing design. This study design was used for multiple reasons, but some of the most important reasons for using such being that this type of design has shown to lead to better data, as well as to control for attention/awareness issues; that is, if participants are just observing stimuli passively, it’s difficult to know if or when participants are paying attention to the faces themselves, or even if their attention is directed at the faces in the first place. Collins & Olson (2014)1 Sadeh & Yovel (2010)2 Rousselet et al. (2004)3 Schacht et al. (2008)4 Eimer (2000a)5 Eimer (2000b)6
  • 2. ERP differences in facial familiarity processing: early and late components Methods 2.1 Subjects This experiment was a class project for an EEG lab course at Indiana University. All participants were all students that were registered and were presently taking this course (n=23). The average age for each subject is around 21 years (a rough range between 20-22 years) with fourteen females and nine males in total. 2.2. Procedure ERP data was recorded after the presentation of stimuli, consisting of either an unknown face, a familiar face, or the subject’s own face. All images were calibrated in a grey scale with an 8cm x 8cm format. The images were also calibrated in contrast and luminance using Photoshop software. The participant was placed so that they are four feet from the stimulus display and stimuli displayed in random order for 1 second after presentation of a fixation cross for 500 ms. An empty grey screen will then be shown for a 500 ms duration prior to the next fixation onset (a total interstimulus interval of 1 second). We implemented a ‘passive viewing’ experimental design in order to permit face recognition in a condition that occurs as naturally as possible, and thereby be ecologically valid, without being subject to influence from task-related factors that are hard to control. 2.3 Data Acquisition and Analysis Data was collected from three active Ag/AgCl electrodes applied at the Pz, P9, and P10 scalp positions using the international 10-20 method of electrode placement. We relied on P9 and P10 (RH) rather than P7 and P8 (LH) because they have been reported to evoke a larger N170 component. In addition, a reference electrode was placed on the nose (Nz) and a ground electrode placed on the forehead (Fz). Prior to placement of the electrodes, alcohol was used to cleanse each electrode site and the skin surface will be lightly abraded with an abrasive gel in order to reduce impedance of the electrode-skin contact. The impedances on all electrodes were measured and determined to be less than or equal to 15.0 kΩ before testing. EEG was recorded and analyzed using a Biopac Systems MP36 recording system, paired with their Acknowledge 4.3 analysis software (Biopac Systems Inc., Goleta, CA). Stimuli were delivered using a customized script and software package: Presentation, version 16.3 (Neurobehavioral Systems Inc., Albany, CA) on a Windows PC. Data was recorded in two blocks of five minutes each at a sampling rate of 1000 Hz, a gain of 10,000, and a band pass filter of 0.5-250 Hz (for the purposes of detecting muscle artifact). We collected 300 stimuli (roughly 100 presentation of each stimulus). Data was collected 250 ms pre-stimulus and 1000 ms (1s) post-stimulus. A 48 Hz cutoff digital LP filter was applied post-recording and artifact rejection was used to skip epochs contaminated by artifact (as indicated by values greater than 50 µV or less than -50 µV). Results Due to the similarity in experimental goals, we adopted a similar experimental design as Caharel et al. (2002). The researchers in this study presented their participants with 3 different faces: the participant’s own face (self), the familiar face (the French President - since it was a study done in France), and an unfamiliar face. The two familiar faces evoked larger N170 amplitudes in comparison to the unfamiliar face. Along with these changes in early temporal components, later component changes were also found (P2). Our study also focused on these same temporal regions (N170, P250). There were a few ‘outliers’ within our group (participants that were fairly significantly different in amplitude and/or latencies), but through graphical and qualitative analysis we concluded that the inclusion of these individuals would not drastically change the grand average of all 23 participants. Therefore, all participants’ data were included in our analysis.
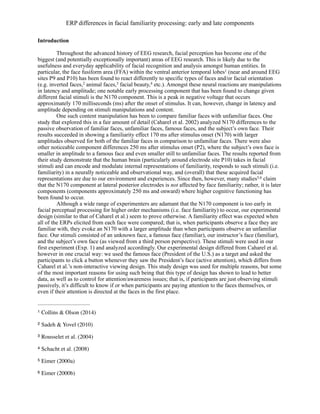
  • 3. ERP differences in facial familiarity processing: early and late components (A) (B) (C) Figure 1. (A) Graph representing average ERPs for each condition (Self, Fam, Unfam, and (familiar) Target). (B) Tables displaying average ERP amplitudes across Self, Fam, and Unfam conditions for each participant. The left four columns display average ERP amplitudes between 150-200 ms (N170 range); the right four columns display average ERP amplitudes between 200-300 ms (P250 range). SD = standard deviation. (C) Table displaying p-value comparisons between Self & Fam, Self & Unfam, and Fam &Unfam conditions within temporal regions of interest (N170 and P250 ranges). N1 P2
  • 4. ERP differences in facial familiarity processing: early and late components 3.1 Experiment 1 The first experiment participants engaged in was with stimuli of familiar faces: their own face (self), a familiar face (our instructor), an unfamiliar face, and a familiar target face (the President). The grand average ERP amplitudes for each condition across all participants are as follows: Self - 1.30 µV, Familiar - 1.50 µV, Unfamiliar - 1.70 µV, and Familiar target - 1.12 µV (see Figure 1A for graph and 1B for individual average ERPs, as well as the mean averages, for each condition). For statistical comparison between conditions (see Figure 1C), we used a one-way within-subjects ANOVA was conducted to compare the effect of stimulus condition on ERP amplitude in both 150-200 ms latency and 200-300 ms latency. There was a significant effect of stimulus condition on amplitude at the p<.05 level for the three conditions [F(2,19) = 4.67, p = 0.015] in the 150-200 ms range, and even more significant in the 200-300 ms range [F(2,19) = 10.41, p = 0.00025]. A paired samples t-test was also conducted to compare mean ERP amplitudes in both 150-200 ms as well as 200-300 ms latency range obtained in Self, Fam, and Unfam conditions. The Familiar condition was not associated with significantly different negative amplitudes than Unfamiliar condition [t(19) = -2.58, p = 0.056], although it was close to be being so at the p<.05 threshold. There was, however, a significant effect of Self amplitude with Unfam amplitude at the p<.05 level for the three conditions [F(2,19) = 4.67. p = 0.001] in the 150-200 ms latency range. In the 200-300 ms latency range, both Self-Fam [t(19) = -2.70, p = 0.042] and Self-Unfam [t(19) = -4.21, p = 0.001] were associated with significantly different amplitudes. All t-Test statistics reported were adjusted by a scaling factors of three (Bonferroni correction) to compensate for multiple comparisons. 3.2. Experiment 2 In the second experiment, the only difference made was switching the target from a famous familiar face (the President) to an unfamiliar stranger of the participants’ gender (i.e. male participants actively looked for and pressed a button for an unfamiliar male face; female participants for an unfamiliar female face). The graph (Figure 2) shows the average ERPs for each condition (Self, Fam, Unfam, and (Unfam) Target). This experiment was done so that we could qualitatively analyze the differences in target data and possible attentional differences. The grand average ERP amplitudes for each condition across all participants are as follows: Self - 1.39 µV, Familiar - 1.96 µV, Unfamiliar - 1.88 µV, and Unfamiliar target - 1.26 µV, making the difference between the Familiar target and the unfamiliar target 0.14 µV, it being more negative in the Familiar target. Figure 2. Graph representing average ERPs for each condition (Self, Fam, Unfam, and (unfamiliar) Target). Noteworthy findings include the similarity in amplitude of Target faces between the two experiments at and around 250 ms range, N170 amplitude differences, as well as amplitude similarity in and around the 250 ms range between Fam and Unfam.
  • 5. ERP differences in facial familiarity processing: early and late components Discussion Our goal was to test for, and hopefully observe, a familiarity effect across multiple temporal regions. Our experimental design allows for this due to our chosen stimuli (familiar, unfamiliar, and self) as well as our active-participant role that each subject was involved in for both experiments. Our results are similar to that of Caharel et al.: we observed more negative amplitudes in faces with familiarity (see Figures 1A and 2) with unknown faces having a more positive amplitude (exempting the unknown target in Exp. 2). Our Exp. 1 data seem to mimic that of Caharel et al. insofar as which presented face issued a more positive and/or negative amplitude response; if anything, our data seems to be more higher quality (bigger amplitude differences between each condition) and show a more explicit difference between conditions. In Expts 1 and 2, the participants also did a continuous performance target detection task. In the first task, participants were asked to ‘look for’ the face of the President (classified as a ‘familiar’ face) and to press a button whenever they saw his face appear on the screen. Recorded data (Figure 1A) showed that this was the face that provoked the one of the most negative in amplitudes around the N170 component (N1), but especially so around the P250 range (P2). This may seem interesting/unusual by itself - since one would expect the Self image (the participants’ own face) to give the most ‘familiar’ response (i.e. evoke the most negative response in amplitude) - but when we compare this finding to our findings in Exp. 2, a different conclusion can be drawn. Although the targets in each Expt. differed in familiarity, they both had similar ERP components (being most negative in and around P2) and the most negativity because of the fact that they were targets. We would expect participants to have a similar reaction to Target faces given the fact that both were being actively ‘searched’ for. Subjects’ reactions to both were comparable because both familiar and unfamiliar targets elicited similar (for lack of a better term) ’eureka’ moment once target face was found. In order to clean up this ambiguity in interpretation, future experiments regarding familiarity should be conducted where target faces include not just a familiar or unfamiliar face, but have a third experiment where participants are targeting their own face (Self). If we observe similar negativity as we have in both of our targets within this study, the aforementioned conclusions increase in their validity. Overall our findings were successful. We succeeded in finding early component familiarity effects (Figure 1A, N1) as well as later components (Figure 1A, P2). Although some researchers don’t find these early component effects on familiarity, I hypothesize that these are merely due to differences in experimental design. Our design seems to put some strong weight on the relevance of early ERP components and their involvement in facial recognition and familiarity processing. Early facial processing components appear to have important beginnings in the categorization of familiarity (i.e. early familiarity categorization begins roughly around 170 ms) whilst later components (Figure 1A, P2) classify familiarity differences in much more detail.
  • 6. ERP differences in facial familiarity processing: early and late components References Caharel, S., Poiroux, S., & Bernard, C. (2002). “ERPs associated with familiarity and degree of familiarity during face recognition.” International Journal of Neuroscience, Vol. 112: pp 1499-1512. DOI: 10.1080/00207450290158368 Collins, Jessica A. & Olson, Ingrid R. (2014). “Beyond the FFA: The role of the ventral anterior temporal lobes in face processing.” Neuropsychologia, Vol. 61: pp 65-79. DOI: 10.1016/j.neuropsychologia.2014.06.005 Eimer, Martin (2000a). “Even-related brain potentials distinguish processing stages involved in face perception and recognition.” Clinical Neuroscience, Vol. 111(4): pp 694-705. DOI: 10.1016/ S1388-2457(99)00285-0 Eimer, Martin (2000b). “Effects of face inversion on the structural encoding and recognition of faces: Evidence from event-related brain potentials.” Cognitive Brain Research, Vol. 10(1-2): pp 145-58. DOI: 10.1016/S0926-6410(00)00038-0 Rousselet, G. A., Macé, M. J.-M., & Fabre-Thorpe, M. (2004). “Animal and human faces in natural scenes: How specific to human faces is the N170 ERP component?” Journal of Vision, Vol. 4(1) DOI: 10.1167/4.1.2 Sadeh, B. & Yovel, G. (2010). “Why is the N170 enhanced for inverted faces? An ERP competition experiment.” NeuroImage, Vol. 53(2): pp 782-89. DOI: 10.1016/j.neuroimage.2010.06.029 Schacht, A., Werheid, K., & Sommer, W. (2008). “The appraisal of facial beauty if rapid but not mandatory.” Cognitive, Affective, & Behavioral Neuroscience, Vol. 8(2): pp 132-42. DOI: 10.3758/CABN.8.2.132