9953056974 Low Rate Call Girls In Saket, Delhi NCR
Toronto real estate market watch commercial october 2010
1. For All Media/Public
Inquiries: (416) 443-8158
For All TREB Member
Inquiries: (416) 443-8152
October 2010
0
10
20
30
40
50
60
70
80
OctSepAugJulJunMayAprMarFebJanDecNovOct
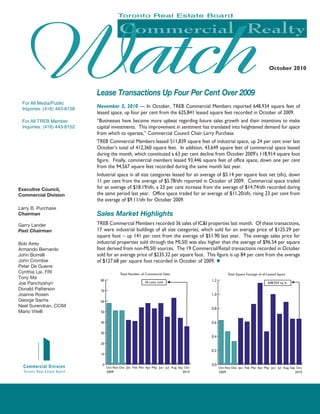
Total Number of Commercial Sales
2009 2010
36 units sold
0.0
0.2
0.4
0.6
0.8
1.0
1.2
OctSepAugJulJunMayAprMarFebJanDecNovOct
Total Square Footage of all Leased Space
2009 2010
648,934 sq. ft.
Executive Council,
Commercial Division
Larry B. Purchase
Chairman
Garry Lander
Past Chairman
Bob Airey
Armando Bernardo
John Borrelli
John Crombie
Peter De Guerre
Cynthia Lai, FRI
Tony Ma
Joe Panchyshyn
Donald Patterson
Joanne Rosen
George Sachs
Neel Surendran, CCIM
Mario Vitelli
Lease Transactions Up Four Per Cent Over 2009
November 3, 2010 — In October, TREB Commercial Members reported 648,934 square feet of
leased space, up four per cent from the 625,841 leased square feet recorded in October of 2009.
“Businesses have become more upbeat regarding future sales growth and their intentions to make
capital investments. This improvement in sentiment has translated into heightened demand for space
from which to operate,” Commercial Council Chair Larry Purchase.
TREB Commercial Members leased 511,839 square feet of industrial space, up 24 per cent over last
October’s total of 412,360 square feet. In addition, 43,649 square feet of commercial space leased
during the month, which constituted a 63 per cent decline from October 2009’s 118,914 square foot
figure. Finally, commercial members leased 93,446 square feet of office space, down one per cent
from the 94,567 square feet recorded during the same month last year.
Industrial space in all size categories leased for an average of $5.14 per square foot net (sfn), down
11 per cent from the average of $5.78/sfn reported in October of 2009. Commercial space traded
for an average of $18.19/sfn, a 23 per cent increase from the average of $14.74/sfn recorded during
the same period last year. Office space traded for an average of $11.20/sfn, rising 23 per cent from
the average of $9.11/sfn for October 2009.
Sales Market Highlights
TREB Commercial Members recorded 36 sales of IC&I properties last month. Of these transactions,
17 were industrial buildings of all size categories, which sold for an average price of $125.29 per
square foot – up 141 per cent from the average of $51.90 last year. The average sales price for
industrial properties sold through the MLS® was also higher than the average of $96.54 per square
foot derived from non-MLS® sources. The 19 Commercial/Retail transactions recorded in October
sold for an average price of $235.32 per square foot. This figure is up 84 per cent from the average
of $127.68 per square foot recorded in October of 2009. u
2. 2
$0
$25
$50
$75
$100
$125
$150
$175
OctSepAugJulJunMayAprMarFebJanDecNovOct
Sold Industrial Properties, 5,001 - 15,000 Square Fee
Dollarspersq.ft.
2009 2010
$146.04/Square Foot
SOLD INDUSTRIAL PROPERTIES
October 2010
$144.26/Square Foot
$0
$25
$50
$75
$100
$125
$150
$175
OctSepAugJulJunMayAprMarFebJanDecNovOct
Sold Industrial Properties, 0 - 5,000 Square Feet
Dollarspersq.ft.
20102009
Area Sales Total Sold Av. Price
Toronto
E07 1 2,000 $174.00
W01 1 4,000 $115.00
W05 1 1,852 $180.35
Total: 3 7,852 $145.44
East
E14 1 2,768 $92.85
Total: 1 2,768 $92.85
West
W20 1 4,286 $145.01
W21 1 2,100 $152.38
W24 1 1,750 $128.57
W28 1 1,250 $152.00
Total: 4 9,386 $144.52
North
N08 3 6,184 $155.72
N10 2 3,450 $161.59
Total: 5 9,634 $157.83
Grand Total: 13 29,640 $144.26
0 - 5,000 SQ. FT.
Area Sales Total Sold Av. Price
Toronto
E08 1 10,000 $112.00
W07 1 5,463 $156.51
Total: 2 15,463 $127.72
North
N11 1 8,674 $178.69
Total: 1 8,674 $178.69
Grand Total: 3 24,137 $146.04
5,001 - 15,000 SQ. FT.
8. $0.0
$7.5
$15.0
$22.5
$30.0
OctSepAugJulJunMayAprMarFebJanDecNovOct
Leased Commercial/Retail Space, 0 - 5,000 Square Feet
Dollarspersq.ft.
2009 2010
$19.51/sfn
8
October 2010
Leased COMMERCIAL/RETAIL Space
$0
$5
$10
$15
$20
$25
$30
OctSepAugJulJunMayAprMarFebJanDecNovOct
Leased Commercial/Retail Space, 5,001 - 15,000 Square Feet
Dollarspersq.ft.
2009 2010
$15.00/sfn
N/A N/A N/A N/AN/A
Area Leased Total Leased Av. Price
Toronto
C01 2 5,414 $23.36
C02 1 814 $41.28
C04 1 1,100 $23.00
C08 1 1,500 $19.20
C12 1 1,000 $33.60
E02 1 800 $24.00
E05 1 428 $27.00
W04 2 2,150 $18.42
Total: 10 13,206 $24.09
East
E14 1 700 $12.00
Total: 1 700 $12.00
West
W14 1 1,650 $13.00
W21 1 1,196 $25.00
W27 1 1,080 $15.56
W28 1 1,752 $20.55
Total: 4 5,678 $18.34
North
N06 1 1,150 $14.00
N07 1 1,889 $22.00
N08 1 2,100 $12.50
N10 1 4,819 $9.28
N11 2 1,331 $32.41
Total: 6 11,289 $15.22
Grand Total: 21 30,873 $19.51
0 - 5,000 SQ. FT.
Area Leased Total Leased Av. Price
West
E07 1 12,776 $15.00
Total: 1 12,776 $15.00
Grand Total: 1 12,776 $15.00
5,001 - 15,000 SQ. FT.
15,001 - 50,00 SQ. FT.
Area Leased Total Leased Av. Price
Grand Total: N/A N/A N/A
50,001 SQ. FT. AND OVER
Area Leased Total Leased Av. Price
Grand Total: N/A N/A N/A
9. 9
Leased Office Space
October 2010
$12.06/sfn
$0
$5
$10
$15
$20
OctSepAugJulJunMayAprMarFebJanDecNovOct
Leased Office Space, 0 - 5,000 Square Fee
Dollarspersq.ft.net
2009 2010
$0
$5
$10
$15
$20
OctSepAugJulJunMayAprMarFebJanDecNovOct
Leased Office Space, 5,001 - 15,000 Square Feet
Dollarspersq.ft.net
2009 2010
$12.15/sfn
Area Leased Total Leased Av. Price
East
E15 1 10,200 $15.87
Total: 1 10,200 $15.87
North
N03 2 12,060 $9.00
Total: 2 12,060 $9.00
Grand Total: 3 22,260 $12.15
Area Leased Total Leased Av. Price
Toronto
C01 2 4,532 $11.52
C02 1 1,000 $13.33
C06 1 120 $32.50
C07 1 1,600 $14.00
C10 1 750 $10.00
C14 1 4,922 $15.00
E09 1 780 $18.46
W02 1 5,000 $8.00
W05 1 485 $7.00
Total: 10 19,189 $12.04
East
E14 1 1,655 $12.00
Total: 1 1,655 $12.00
West
W14 1 469 $8.00
W15 1 819 $16.50
W17 2 1,401 $11.02
W21 1 890 $16.18
W24 1 750 $11.20
Total: 6 4,329 $12.82
North
N01 1 1,350 $14.00
N08 2 3,020 $10.02
N10 1 968 $8.25
N11 3 3,474 $13.31
N12 1 494 $12.15
Total: 8 9,306 $11.76
Grand Total: 25 34,479 $12.06
5,001 - 15,000 SQ. FT.
Area Leased Total Leased Av. Price
Grand Total: N/A N/A N/A
0 - 5,000 SQ. FT.
50,001 SQ. FT. AND OVER
15,001 - 50,000 SQ. FT.
Area Leased Total Leased Av. Price
Toronto
W06 1 16,579 $7.75
Total: 1 16,579 $7.75
North
N03 1 20,128 $11.50
Total: 1 20,128 $11.50
Grand Total: 2 36,707 $9.81
10. Area Sales Total Sold Av. Price Total Acre Av. Price
Grand
Total: N/A N/A N/A N/A N/A
10
sold land
October 2010
Area Sales Total Sold Av. Price Total Acre Av. Price
West
W21 1 16,000 $63.13 0.37 $2,729,729.73
Total: 1 16,000 $63.13 0.37 $2,729,729.73
North
N14 1 21,164 $37.09 0.49 $1,602,040.82
N22 1 118,048 $8.17 2.71 $355,902.21
Total: 2 139,212 $12.57 3.20 $546,717.19
Grand
Total: 3 155,212 $17.78 3.57 $772,967.79
130,001 SQ. FT. AND OVER0 - 130,000 SQ. FT.
11. 11
HumberRiver
5thConcessionBrimleyRd.
HaltonHills/MiltonTownline
Durham-VictoriaLine
Brock/Scugog Townline
Durham/NorthumberlandLine
401
Hwy.
35/115
Taunton Rd.
Townline Rd.
Taunton Rd.4th Concession
Lawrence
Midland
KennedyRd.
St. Clair
DonValleyParkw
a y
Dufferin
VictoriaPark
Yonge
Eglinton
Leslie
401
Bayview
Danforth Ave.
AllenRd.
St. Clair
Bloor
409
Eglinton
Bloor
Q.E.W.
Steeles
Newmarket
Hwy. 407
Major Mackenzie Dr.
Gamble Rd.
Bloomington Rd.
Newmarket
YongeSt.
Hwy.404
Steeles
Hwy. 407
Whitchurch/Stouffville
Davis Drive
York-DurhamLine
Durham23
Hwy. 9
Orangeville
PeelTownline
WinstonChurchill
(17th Sideroad)
Mayfield Rd.
HeartLakeRd.
Wellington Townline
Hwy.50
York-PeelTownline
Brampton
Mississauga
Hwy.427EtobicokeCreek
Hwy.6
WellingtonTownline
BellSchoolLine
NinthLine
Dundas
BurlOakRd.
Cre
d
itRiver
Bloor
St. Clair
Bayview
Eglinton
401
DonR
iv
er
C1
C2
C3
C8
C9
C10
C11
W1
W2
W3
W4
W5
C4
C6
C7 C14
C15
C13
C12
W6
W7
W8
W9
W10
Cawthra
2nd
Line
Burlington
Milton/Oakville Line
Winston
Churchill
Hamilton/Wentworth
Townline
Burlington
Oakville
Milton
North
Halton Hills
Milton
W25
W26
W27
W22
W21
W13
W12
W16
W15
W14
W19
W17
W20
Derry Rd.
Brampton
Caledon
W23
W24
W28
19th Avenue
Aurora
N02 N01
N03
N04
N05
N06
N07
Markham
MarkhamUnionville
N10
N11
N12
N13
Regional30
East Gwillimbury
N15
Uxbridge
N16
Lake Simcoe
Georgina
N17
Rou
ge Riv
er
PickeringTownline
Durham23
401
6th Concession
Townline
Durham23
E12
AjaxPickering
Pickering
Whitby
Oshawa
E13
E18
E14 E15
E19
E16
Scugog
Brock
E21
N24
Lake Scugog
Scugog
Island
NewcastleBowmanville
E17 E20
Morningside
Coxwell
Lake Ontario
Lake Ontario
E1
E6
E3
E2
E4
E5 E7 E11
E10
E8
E9
Toronto Real Estate Board
Toronto
N
W18
Regional38
East Gwillimbury
Regional 32
401
Pickering-Ajax
MarkhamRd.
Credit Ri
ver
Mavis
Hwy. 9
Hwy.27
Dufferin/SimcoeLine
Regional15
Sunnidale Townline Vespra
Hwy. 9
Steeles
Bathurst
King/Vaughan
NewTecumseth-AdjalaLine
NewTecumseth/Bradford-WestGwillimburyTownline
Vaughan
King
N08
N14
New Tecumseth Bradford
West GwillimburyN19
N18
Hwy. 89
Bradford-West Gwillimbury/Innisfil
Hwy. 89
Regional2
Regional2
Hwy. 9
Townline
Adjala
N20
Tosorontio
N21
Essa
N22
Innisfil
N23
Hwy. 90
410
Township Line
W29
Average Square Foot Net:
The trimmed average of all Net Leases in a particular MLS® district or
Area expressed on a per square foot basis. (ie: total $ volume for a
district or area ÷ total square footage for the district or area)
Commercial/Retail:
Commercial or Retail space for user, excluding Offices and Office
Buildings.
Industrial:
Industrial buildings or space for user.
Net Lease:
A Leasing agreement whereby the tenant pays the rent and certain
expenses connected with the leased premises. All information
contained in the Commercial Insight concerns Net agreements.
Office:
Office space for lease (the Commercial Realty Watch contains no sold
information for office buildings).
Total Leased/Total Sold/Sold (space):
The amount, expressed in square feet, of space actually leased in a
particular MLS® district or Area.
Note: When making use of the figures contained in this report, please be advised that the sold and leased properties reported on are only those listed through the TREB
MLS® system. There are transactions that take place outside the purview of this system and therefore cannot not be captured in this report.
Toronto Real Estate Board Service Areas
October 2010
Glossary of Terms