Victoria Real Estate Board Statistics December 2022 with charts and graphs. The 2022 Victoria real estate market year in review. A total of 320 properties sold in the Victoria Real Estate Board region this December, 26.9 per cent fewer than the 438 properties sold in December 2021 and a 16.7 per cent decrease from November 2022. Sales of condominiums were down 38.2 per cent from December 2021 with 94 units sold. Sales of single family homes decreased 24.6 per cent from December 2021 with 156 sold.
1. The 2022 Victoria real estate market year in review
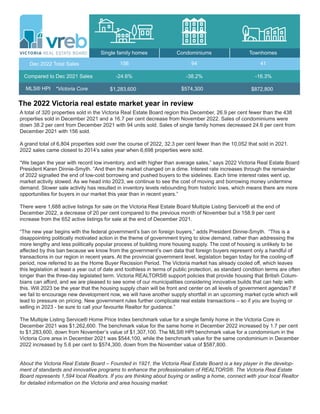
A total of 320 properties sold in the Victoria Real Estate Board region this December, 26.9 per cent fewer than the 438
properties sold in December 2021 and a 16.7 per cent decrease from November 2022. Sales of condominiums were
down 38.2 per cent from December 2021 with 94 units sold. Sales of single family homes decreased 24.6 per cent from
December 2021 with 156 sold.
A grand total of 6,804 properties sold over the course of 2022, 32.3 per cent fewer than the 10,052 that sold in 2021.
2022 sales came closest to 2014’s sales year when 6,698 properties were sold.
“We began the year with record low inventory, and with higher than average sales,” says 2022 Victoria Real Estate Board
President Karen Dinnie-Smyth. “And then the market changed on a dime. Interest rate increases through the remainder
of 2022 signalled the end of low-cost borrowing and pushed buyers to the sidelines. Each time interest rates went up,
market activity slowed. As we head into 2023, we continue to see the cost of moving and borrowing money undermine
demand. Slower sale activity has resulted in inventory levels rebounding from historic lows, which means there are more
opportunities for buyers in our market this year than in recent years.”
There were 1,688 active listings for sale on the Victoria Real Estate Board Multiple Listing Service® at the end of
December 2022, a decrease of 20 per cent compared to the previous month of November but a 158.9 per cent
increase from the 652 active listings for sale at the end of December 2021.
“The new year begins with the federal government’s ban on foreign buyers,” adds President Dinnie-Smyth. “This is a
disappointing politically motivated action in the theme of government trying to slow demand, rather than addressing the
more lengthy and less politically popular process of building more housing supply. The cost of housing is unlikely to be
affected by this ban because we know from the government’s own data that foreign buyers represent only a handful of
transactions in our region in recent years. At the provincial government level, legislation began today for the cooling-off
period, now referred to as the Home Buyer Recission Period. The Victoria market has already cooled off, which leaves
this legislation at least a year out of date and toothless in terms of public protection, as standard condition terms are often
longer than the three-day legislated term. Victoria REALTORS® support policies that provide housing that British Colum-
bians can afford, and we are pleased to see some of our municipalities considering innovative builds that can help with
this. Will 2023 be the year that the housing supply chain will be front and center on all levels of government agendas? If
we fail to encourage new development now, we will have another supply shortfall in an upcoming market cycle which will
lead to pressure on pricing. New government rules further complicate real estate transactions – so if you are buying or
selling in 2023 - be sure to call your favourite Realtor for guidance.”
The Multiple Listing Service® Home Price Index benchmark value for a single family home in the Victoria Core in
December 2021 was $1,262,600. The benchmark value for the same home in December 2022 increased by 1.7 per cent
to $1,283,600, down from November’s value of $1,307,100. The MLS® HPI benchmark value for a condominium in the
Victoria Core area in December 2021 was $544,100, while the benchmark value for the same condominium in December
2022 increased by 5.6 per cent to $574,300, down from the November value of $587,800.
About the Victoria Real Estate Board – Founded in 1921, the Victoria Real Estate Board is a key player in the develop-
ment of standards and innovative programs to enhance the professionalism of REALTORS®. The Victoria Real Estate
Board represents 1,594 local Realtors. If you are thinking about buying or selling a home, connect with your local Realtor
for detailed information on the Victoria and area housing market.
Single family homes Condominiums Townhomes
Dec 2022 Total Sales
Compared to Dec 2021 Sales
MLS® HPI
156
$1,283,600
94
-24.6% -38.2%
41
-16.3%
$574,300 $872,800
*Victoria Core
2. Sales by Property Type
Single Family Greater Victoria
Single Family Other Areas
Single Family Total All Areas
Condo Apartment
Row/Townhouse
Manufactured Home
Total Residential
Total Sales
Active Listings
Units Median$
Average$
LY%
LM% LY%
LM% LY%
LM% Units Median$
Average$ Units Median$
Average$
December 2022
146
94
41
9
300
156
320
10
1,688
174
136
37
9
364
182
384
8
2,111
198
152
49
7
415
207
438
9
652
$1,259,045
$549,561
$748,795
$394,111
$1,244,484
$1,031,900
$1,050,000
$510,000
$725,000
$335,500
$1,050,000
$1,050,000
$1,186,852
$619,653
$802,912
$519,000
$1,169,441
$790,739
$1,000,000
$541,000
$737,450
$370,000
$999,900
$797,500
$1,324,154
$663,079
$822,876
$284,771
$1,330,847
$1,478,111
$1,225,000
$566,898
$770,000
$268,250
$1,215,000
$1,075,000
-16.1%
-30.9%
10.8%
0.0%
-17.6%
-14.3%
-16.7%
25.0%
-20.0%
-26.3%
-38.2%
-16.3%
28.6%
-27.7%
-24.6%
-26.9%
11.1%
158.9%
6.1%
-11.3%
-6.7%
-24.1%
6.4%
30.5%
-4.9%
-17.1%
-9.0%
38.4%
-6.5%
-30.2%
5.0%
-5.7%
-1.7%
-9.3%
5.0%
31.7%
-14.3%
-10.0%
-5.8%
25.1%
-13.6%
-2.3%
November 2022 December 2021
Legend
Units: net number of listings sold
LM%: percentage change since Last Month
LY%: percentage change since This Month Last Year
Average$: average selling price
Median$: median selling price
Total Residential: includes sales of residential property types
Total Sales: includes sales of all property types
Active Listings: total listings of all types on the market at midnight on the last day of the month
This Month Last Month
Produced: 02-Jan-2023
December 2022
Previous Periods Comparison
This Month Last Year
Page 1 of 1
Victoria Real Estate Board Multiple Listing Service ®
December 2022
Statistics Package for Media
Victoria Real Estate Board December 2022 Statistics - page 2
Previous Periods Comparison of Unit Sales, Average Prices and Median Prices
Previous Periods Comparison of MLS® HPI Benchmark Prices and MLS® HPI Index Values
3. 6DOHVWR$FWLYH/LVWLQJV5DWLR
The ratio of counts of total residential sales over total active residential listings for the last 25 months
'HFHPEHU
Produced: 02-Jan-2023
'HF
-DQ
)HE
0DU
$SU
0D
-XQ
-XO
$XJ
6HS
2FW
1RY
'HF
-DQ
)HE
0DU
$SU
0D
-XQ
-XO
$XJ
6HS
2FW
1RY
'HF
7KH6DOHVWR$FWLYH/LVWLQJV5DWLR
7KLV FKDUWWUDFNVWKHUDWLRRIWRWDOUHVLGHQWLDOVDOHVRYHUWRWDODFWLYHUHVLGHQWLDOOLVWLQJVDWPRQWKHQGIRU
HDFKRIWKHODVWPRQWKV
7KHDFWLYHOLVWLQJFRXQWDQGWKHVDOHVFRXQWFDQEHYLHZHGDVLQGLFDWRUVRIKRXVLQJVXSSODQG
GHPDQGUHVSHFWLYHO2EVHUYLQJWKHUDWLREHWZHHQWKHPFDQWKXVKHOSLQGLFDWHDEXHUV PDUNHW
ZKHUHWKHUHLVVXVWDLQHGGRZQZDUGSUHVVXUHRQSULFHVDQGDVHOOHUV PDUNHWZKHUHWKHUHLV
VXVWDLQHGXSZDUGSUHVVXUHRQSULFHV
%DVHGRQDUHJUHVVLRQDQDOVLVSHUIRUPHGEWKH(FRQRPLFV'HSDUWPHQWRIWKH%5HDO(VWDWH
$VVRFLDWLRQLQHDFKPDUNHWDUHDRIWKHSURYLQFHWKH6DOHVWR$FWLYH/LVWLQJV5DWLRIRU9LFWRULDFDQEH
LQWHUSUHWHGDVIROORZV
EHORZWKHUHLVGRZQZDUGSUHVVXUHRQSULFHV EXHUV PDUNHW
DERYHWKHUHLVXSZDUGSUHVVXUHRQSULFHV VHOOHUV PDUNHW
Sales to Active Listings Ratio
This chart tracks the ratio of total residential sales over total active residential listings at month-end for each of
the last 25 months.
The active listing count and the sales count can be viewed as indicators of housing supply and demand
respectively. Observing the ratio between them can thus help indicate a buyers' market, where there is
downward pressure on prices, and a sellers' market, where there is upward pressure on prices.
- below 10%, there is downward pressure on prices (buyers' market)
- above 25%, there is upward pressure on prices (sellers' market)
- in the 15-20% range, there is little pressure on prices either way (balanced market)
Victoria Real Estate Board December 2022 Statistics - page 3
Total new MLS® listings and total MLS® sales for entire district
4. The Victoria Real Estate Board uses the MLS® Home Price Index (MLS® HPI) to report on market
trends. The MLS® HPI uses the concept of a benchmark home, a notional home with common
attributes of typical homes in a defined area.
Through the analysis of over fifteen years of Victoria Real Estate Board MLS® sales data, the MLS®
HPI defined benchmark homes for Victoria in each category (single family homes, townhouses,
condos) and for each neighbourhood. The benchmark starting point was 2005, where each type of
property and neighbourhood was assigned an index value of 100.
*The HPI reporting herein is based on the SOLD date.
Victoria Real Estate Board December 2022 Statistics - page 4
MLS® HPI benchmark and value - Single Family Homes
5. MLS® HPI benchmark and value - Condominium / Apartments
Victoria Real Estate Board December 2022 Statistics - page 5
6. Note: Areas with insufficient sales are not included in the HPI.
Source: Victoria Real Estate Board
December 2022 1 Month Ago 3 Months Ago 6 Months Ago 12 Months Ago 3 Years Ago 5 Years Ago January 2005
Victoria REB – SF-All
Victoria – SF-All
Victoria West – SF-All
Oak Bay – SF-All
Esquimalt – SF-All
View Royal – SF-All
Saanich East – SF-All
Saanich West – SF-All
Sooke – SF-All
Langford – SF-All
Metchosin – SF-All
Colwood – SF-All
Highlands – SF-All
North Saanich – SF-All
Sidney – SF-All
Central Saanich – SF-All
ML Malahat Area –
SF-All
GI Gulf Islands – SF-All
$995,200
$991,500
$990,600
$989,700
$988,200
$974,000
$972,000
$969,600
$968,700
$967,000
$952,500
$950,700
$950,500
$938,000
$929,700
$924,200
$918,200
$913,400
$911,700
$896,400
$887,300
$885,300
$871,400
$858,700
$851,100
$845,400
$843,200
$825,000
$813,900
$811,300
$801,000
$795,700
$795,200
$767,200
$764,900
$763,500
$759,900
$748,400
$747,500
$736,500
$713,500
$706,900
$706,300
$701,300
$685,300
$673,500
$663,700
$653,500
$640,800
$630,700
$630,300
$600,100
$584,900
$579,300
$563,100
$517,000
$510,800
$491,100
$475,900
$469,000
$436,800
$417,900
$384,500
$370,800
$355,800
$336,900
$330,600
$327,600
$319,700
$303,500
$303,200
$302,700
$294,100
$288,400
$270,400
$1,990,800
$1,922,400
$1,854,400
$1,843,500 $1,701,400
$1,552,200
$1,522,700
$1,489,400
$1,472,400
$1,442,500
$1,401,800
$1,393,200
$1,386,400
$1,385,600
$1,379,500
$1,379,200
$1,373,000
$1,348,500
$1,344,000
$1,308,100
$1,301,300
$1,294,100 $1,289,800
$1,285,200
$1,281,700
$1,279,600
$1,278,300
$1,273,200
$1,249,600
$1,246,300 $1,242,700
$1,233,800
$1,218,500
$1,205,900
$1,199,000
$1,196,400
$1,194,300
$1,178,600
$1,177,400
$1,174,100
$1,164,800
$1,146,400
$1,135,600
$1,131,800
$1,127,600
$1,109,600
$1,109,000
$1,105,400
$1,103,600
$1,094,500
$1,076,600
$1,075,900
$1,073,100
$1,072,000
$1,071,200
$1,069,200
$1,066,200
$1,060,500
$1,047,700
$1,043,500
$1,042,600
$1,039,400
$1,030,500
$1,028,400
$1,025,500
$1,011,600
$1,011,600
$1,011,400
$1,002,200
Benchmark Price by Timeframe and Property Type
Value or percent change
Value
Percent change
HPI or Benchmark Price
HPI
Benchmark Price
1. Area Group
VREB District Summary
3. Area/Property Type Selection
All
2. Property Type
– Single Family-All (SF-All)
7. Note: Areas with insufficient sales are not included in the HPI.
Source: Victoria Real Estate Board
December 2022 1 Month Ago 3 Months Ago 6 Months Ago 12 Months Ago 3 Years Ago 5 Years Ago January 2005
Victoria REB – SF-All
Victoria – SF-All
Victoria West – SF-All
Oak Bay – SF-All
Esquimalt – SF-All
View Royal – SF-All
Saanich East – SF-All
Saanich West – SF-All
Sooke – SF-All
Langford – SF-All
Metchosin – SF-All
Colwood – SF-All
Highlands – SF-All
North Saanich – SF-All
Sidney – SF-All
Central Saanich – SF-All
ML Malahat Area –
SF-All
GI Gulf Islands – SF-All
378.7
375.2
367.3
366.0
365.2
364.6
356.4
356.1
354.5
350.9
350.8
346.9
346.8
344.2
340.8
340.4
338.9
338.5
336.2
335.7 334.4
334.4
334.2
333.3
331.7
331.0
330.1
328.8
328.6
328.4
328.2
328.1
326.5
324.3
324.1
323.2
323.2
322.5
321.2
321.1
320.3
320.0
319.8
319.6
319.5
318.3
318.1
316.7
316.1
314.8
314.3
314.1
313.9
313.0
312.6
311.1
309.9
309.6
309.0
308.7
308.5
307.6
307.2
307.0
306.5
306.3
305.9
305.1
304.7
304.4
304.1
303.1
301.1
300.4
300.0
297.1
296.3
295.4
295.3
292.4
291.3
289.8
286.6
283.5
282.9
274.5
268.9
268.2
262.2
252.0
246.5
240.2
233.1
231.7
227.9
226.6
226.4
225.1
222.2
222.1
221.2
219.3
218.6
215.8
215.7
215.6
214.5
214.2
209.8
209.2
208.3
208.2
208.2
204.9
202.8
202.7
200.4 197.2
194.8
192.9
192.5
190.9
181.6
179.3
174.8
168.3 100.0
100.0
100.0
100.0
100.0
100.0
100.0
100.0
100.0
100.0
100.0
100.0
100.0
100.0
100.0
100.0
100.0
100.0
HPI by Timeframe and Property Type
Value or percent change
Value
Percent change
HPI or Benchmark Price
HPI
Benchmark Price
1. Area Group
VREB District Summary
3. Area/Property Type Selection
All
2. Property Type
– Single Family-All (SF-All)
8. Note: Areas with insufficient sales are not included in the HPI.
Source: Victoria Real Estate Board
December 2022 1 Month Ago 3 Months Ago 6 Months Ago 12 Months Ago 3 Years Ago 5 Years Ago January 2005
Victoria REB – Con
Victoria – Con
Victoria West – Con
Oak Bay – Con
Esquimalt – Con
View Royal – Con
Saanich East – Con
Saanich West – Con
Sooke – Con
Langford – Con
Colwood – Con
North Saanich – Con
Sidney – Con
Central Saanich – Con
$880,400
$852,200
$832,800
$821,700
$810,000
$799,400
$769,700
$767,800
$751,200
$749,600
$731,900
$717,000
$708,300
$705,800
$690,900
$678,100 $670,400
$657,000
$653,600
$635,800
$631,000
$630,100
$627,200
$611,900
$610,400
$610,100
$609,900
$609,000
$595,200
$591,500
$590,500
$590,500
$590,400
$587,300
$584,600
$580,800
$579,400
$578,700
$569,200
$566,000 $564,100
$563,600
$561,600
$561,100 $560,800
$560,000
$559,700
$559,700
$559,000
$553,200
$551,500
$549,600
$547,700
$543,800
$537,100
$536,400
$535,500
$532,300
$530,300
$526,800
$524,200
$520,000
$514,800
$512,500
$507,800
$500,800
$496,700
$489,800
$487,400
$484,700
$476,900
$474,500
$474,000
$452,900
$449,000
$445,000
$443,000
$442,100
$440,700
$438,700
$436,500
$431,600
$426,200
$414,400
$410,700
$404,300
$384,100
$381,500
$379,300
$368,800
$361,800
$359,100
$356,600
$348,000
$341,200
$331,900
$289,400
$285,500
$266,000
$234,200
$231,100
$199,200
$195,700
$195,500
$169,900
$167,000
$159,100
$152,000
$150,200
$143,700
$131,400
$115,000
Benchmark Price by Timeframe and Property Type
Value or percent change
Value
Percent change
HPI or Benchmark Price
HPI
Benchmark Price
1. Area Group
VREB District Summary
3. Area/Property Type Selection
All
2. Property Type
– Condo Apartment (Con)
9. Note: Areas with insufficient sales are not included in the HPI.
Source: Victoria Real Estate Board
December 2022 1 Month Ago 3 Months Ago 6 Months Ago 12 Months Ago 3 Years Ago 5 Years Ago January 2005
Victoria REB – Con
Victoria – Con
Victoria West – Con
Oak Bay – Con
Esquimalt – Con
View Royal – Con
Saanich East – Con
Saanich West – Con
Sooke – Con
Langford – Con
Colwood – Con
North Saanich – Con
Sidney – Con
Central Saanich – Con
435.5
427.0 426.8
425.9
414.7
410.9
408.8
399.6
393.8
390.0
389.7
389.1
383.7
381.1
381.0
374.5
373.9
370.9
370.9
367.8
367.4
366.4
365.9
364.8
363.9
360.4
359.0
357.1
354.4
352.9
351.8
351.7
350.9
350.5
346.5
345.7
342.6
341.0
338.1
336.1
334.0
333.1
331.7
331.3
331.1
330.2
324.4
322.8
320.8
320.5
318.9
315.9
315.2
312.5
311.4
305.3
302.0
301.4
298.8
296.8
296.4
289.5
288.7
288.5
282.2
280.0
273.3
273.0
268.9
266.2
263.5
260.5
258.4
256.9
256.6
255.2
251.7
251.1
248.1
242.5
242.2
242.0
238.0
237.4
231.3
228.4
226.1
225.2
224.5
221.9
221.0
220.5
218.7
212.0
203.0
202.7
189.2
155.9
100.0
100.0
100.0
100.0
100.0
100.0
100.0
100.0
100.0
100.0
100.0
100.0
100.0
100.0
HPI by Timeframe and Property Type
Value or percent change
Value
Percent change
HPI or Benchmark Price
HPI
Benchmark Price
1. Area Group
VREB District Summary
3. Area/Property Type Selection
All
2. Property Type
– Condo Apartment (Con)
10. Note: Areas with insufficient sales are not included in the HPI.
Source: Victoria Real Estate Board
December 2022 1 Month Ago 3 Months Ago 6 Months Ago 12 Months Ago 3 Years Ago 5 Years Ago January 2005
Victoria REB – Twn
Victoria – Twn
Victoria West – Twn
Esquimalt – Twn
View Royal – Twn
Saanich East – Twn
Saanich West – Twn
Sooke – Twn
Langford – Twn
Colwood – Twn
Sidney – Twn
Central Saanich – Twn
ML Malahat Area – Twn
GI Gulf Islands – Twn
$966,400
$955,800
$941,100
$927,500
$924,800
$921,600
$916,400
$913,800
$910,200 $905,800
$903,000
$884,500
$874,100
$861,300
$858,700
$850,300
$845,200
$840,700
$840,500
$839,700
$835,200
$834,200
$824,600
$819,800
$818,800
$814,300
$813,800
$813,200
$811,400
$809,300
$805,800
$805,300
$805,200
$798,400
$790,900
$790,700
$786,500
$783,300
$783,000
$781,500
$779,100
$777,800
$767,500
$764,600
$759,400
$754,400
$752,800
$748,900
$748,400
$745,000
$740,300
$740,100
$732,300
$730,000
$729,400
$727,100
$720,700
$717,400
$714,100
$711,400
$711,300
$710,300
$705,600
$703,100
$700,900
$694,400
$687,300
$680,000
$674,900
$660,900 $655,900
$645,600
$639,500
$628,000 $599,000
$564,400
$555,700
$554,600
$550,700
$546,800
$538,600
$533,400
$521,600
$516,200
$514,000
$510,300
$503,700
$497,100
$469,200
$464,100
$461,800
$457,800
$457,000
$442,700
$433,700
$424,700
$400,000
$398,800
$321,500
$295,200
$288,500
$258,200
$254,800
$245,700
$244,300
$240,700
$232,300
$221,100
$219,500
$213,400
$212,000
$201,100
Benchmark Price by Timeframe and Property Type
Value or percent change
Value
Percent change
HPI or Benchmark Price
HPI
Benchmark Price
1. Area Group
VREB District Summary
3. Area/Property Type Selection
All
2. Property Type
– Townhouse (Twn)
11. Note: Areas with insufficient sales are not included in the HPI.
Source: Victoria Real Estate Board
December 2022 1 Month Ago 3 Months Ago 6 Months Ago 12 Months Ago 3 Years Ago 5 Years Ago January 2005
Victoria REB – Twn
Victoria – Twn
Victoria West – Twn
Esquimalt – Twn
View Royal – Twn
Saanich East – Twn
Saanich West – Twn
Sooke – Twn
Langford – Twn
Colwood – Twn
Sidney – Twn
Central Saanich – Twn
ML Malahat Area – Twn
GI Gulf Islands – Twn
435.4
417.5
411.4
410.0
398.2
393.9
380.2
380.2
380.0
372.4
370.6
365.1
364.2
362.7
362.0
360.0
352.6
350.9
345.4
344.1
341.2
339.9
336.4
336.2
335.6 335.0
332.9
331.4
331.2
329.8
329.6
329.3
326.0
324.2
322.2
320.1
318.8
318.0
317.1
317.0
316.1
314.2
313.0
312.2 309.6
309.2
307.6
307.4
306.2
306.2
305.3
302.9
300.6
296.7
295.4
294.1
293.0
292.7
288.5
288.5
287.7
283.1 281.7
280.5
280.4
277.7
271.4
267.1
265.7
263.2 253.0
249.1
240.9
231.0
227.6
225.7
223.9 222.2
221.3
220.5
218.1
217.5
214.0
213.3
210.1
204.6
202.0
200.2
198.8
198.3
197.7
195.3
189.9
186.3
184.9
180.9
176.9
176.4
100.0
100.0
100.0
100.0
100.0
100.0
100.0
100.0
100.0
100.0
100.0
100.0
100.0
100.0
HPI by Timeframe and Property Type
Value or percent change
Value
Percent change
HPI or Benchmark Price
HPI
Benchmark Price
1. Area Group
VREB District Summary
3. Area/Property Type Selection
All
2. Property Type
– Townhouse (Twn)
12. Note: Areas with insufficient sales are not included in the HPI.
Source: Victoria Real Estate Board
Victoria REB – SF-All Core – SF-All Westshore – SF-All Peninsula – SF-All
Select Date Range:
All values
Jan
2003
Jan
2005
Jan
2007
Jan
2009
Jan
2011
Jan
2013
Jan
2015
Jan
2017
Jan
2019
Jan
2021
Jan
2023
Benchmark
Price
($)
200,000
400,000
600,000
800,000
1,000,000
1,200,000
1,400,000
Benchmark Price Performance over Time
1. Area Group
VREB Area Summary
3. Area/Property Type Selection
Multiple values
2. Property Type
– Single Family-All (SF-All)
HPI or Benchmark Price
HPI
Benchmark Price
Adding labels
Hold Ctrl (Cmd) and select points on the chart to show multiple date/value labels
13. Note: Areas with insufficient sales are not included in the HPI.
Source: Victoria Real Estate Board
Victoria REB – Con Core – Con Westshore – Con Peninsula – Con
Select Date Range:
All values
Jan
2003
Jan
2005
Jan
2007
Jan
2009
Jan
2011
Jan
2013
Jan
2015
Jan
2017
Jan
2019
Jan
2021
Jan
2023
Benchmark
Price
($)
100,000
200,000
300,000
400,000
500,000
600,000
Benchmark Price Performance over Time
1. Area Group
VREB Area Summary
3. Area/Property Type Selection
All
2. Property Type
– Condo Apartment (Con)
HPI or Benchmark Price
HPI
Benchmark Price
Adding labels
Hold Ctrl (Cmd) and select points on the chart to show multiple date/value labels
14. Note: Areas with insufficient sales are not included in the HPI.
Source: Victoria Real Estate Board
Victoria REB – Twn Core – Twn Westshore – Twn Peninsula – Twn
Select Date Range:
All values
Jan
2003
Jan
2005
Jan
2007
Jan
2009
Jan
2011
Jan
2013
Jan
2015
Jan
2017
Jan
2019
Jan
2021
Jan
2023
Benchmark
Price
($)
200,000
300,000
400,000
500,000
600,000
700,000
800,000
900,000
Benchmark Price Performance over Time
1. Area Group
VREB Area Summary
3. Area/Property Type Selection
Multiple values
2. Property Type
– Townhouse (Twn)
HPI or Benchmark Price
HPI
Benchmark Price
Adding labels
Hold Ctrl (Cmd) and select points on the chart to show multiple date/value labels
15. Note: Areas with insufficient sales are not included in the HPI.
Source: Victoria Real Estate Board
Victoria REB – SF-All Victoria REB – Twn Victoria REB – Con
Select Date Range:
All values
Jan
2003
Jan
2005
Jan
2007
Jan
2009
Jan
2011
Jan
2013
Jan
2015
Jan
2017
Jan
2019
Jan
2021
Jan
2023
Benchmark
Price
($)
200,000
400,000
600,000
800,000
1,000,000
1,200,000
Benchmark Price Performance over Time
1. Area Group
VREB Area Summary
3. Area/Property Type Selection
Multiple values
2. Property Type
Multiple values
HPI or Benchmark Price
HPI
Benchmark Price
Adding labels
Hold Ctrl (Cmd) and select points on the chart to show multiple date/value labels
16. Monthly Sales Summary (Mark I)
Residential Waterfront Properties Integrated Into Their Own Districts
Units Total Volume
December 2022
District
Produced: 02-Jan-2023
Residential
Single Family Detached
l
Greater Victoria
Victoria / Victoria West 19 $21,589,400
Oak Bay 8 $16,735,000
Esquimalt 8 $10,522,500
View Royal 5 $4,350,000
Saanich East 17 $24,167,500
Saanich West 13 $10,953,000
Central Saanich 6 $7,965,000
North Saanich 11 $21,299,000
Sidney 3 $6,080,000
Colwood 10 $10,310,000
Langford 22 $25,139,299
Sooke 13 $11,549,850
Gulf Islands 11 $13,160,000
Total Greater Victoria 146 $183,820,549
Other Areas
Malahat Area 10 $10,319,000
Total Other Areas 10 $10,319,000
Total Single Family Detached 156 $194,139,549
Condo Apartment
l
Greater Victoria
Victoria / Victoria West 49 $26,088,900
Oak Bay 2 $1,937,000
Esquimalt 6 $3,172,396
View Royal 1 $432,500
Saanich East 7 $3,529,000
Saanich West 5 $2,506,000
Central Saanich 3 $2,059,900
Sidney 4 $3,036,000
Colwood 1 $785,000
Langford 16 $8,111,999
Total Greater Victoria 94 $51,658,695
Total Condo Apartment 94 $51,658,695
Page 1 of 3
Victoria Real Estate Board Multiple Listing Service ®
17. Monthly Sales Summary (Mark I)
Residential Waterfront Properties Integrated Into Their Own Districts
Units Total Volume
December 2022
District
Produced: 02-Jan-2023
Row/Townhouse
l
Greater Victoria
Victoria / Victoria West 4 $3,159,900
Esquimalt 1 $665,000
View Royal 9 $6,353,000
Saanich East 7 $5,750,000
Saanich West 1 $810,000
Central Saanich 4 $3,184,800
Sidney 3 $1,785,000
Colwood 5 $3,835,000
Langford 6 $4,497,000
Sooke 1 $660,900
Total Greater Victoria 41 $30,700,600
Total Row/Townhouse 41 $30,700,600
Manufactured Home
l
Greater Victoria
View Royal 4 $941,000
Sidney 1 $515,000
Langford 3 $1,900,000
Sooke 1 $426,000
Gulf Islands 0 ($235,000)
Total Greater Victoria 9 $3,547,000
Total Manufactured Home 9 $3,547,000
Total Residential 300 $280,045,844
Page 2 of 3
Victoria Real Estate Board Multiple Listing Service ®
18. Monthly Sales Summary (Mark I)
Residential Waterfront Properties Integrated Into Their Own Districts
Units Total Volume
December 2022
District
Produced: 02-Jan-2023
$285,256,459
320
Grand Totals
Other Property
Lots Acreage
l
Greater Victoria
Oak Bay 1 $475,000
Sooke 2 $827,750
Gulf Islands 2 $1,148,000
Total Greater Victoria 5 $2,450,750
Total Lots Acreage 5 $2,450,750
15 $2,759,865
Other Commercial Properties
l
Page 3 of 3
Victoria Real Estate Board Multiple Listing Service ®
19. Monthly Sales Summary (Mark II)
Waterfront Properties Segregated Into a 'Waterfront' District
Units Total Volume
December 2022
District
Produced: 02-Jan-2023
Residential
Single Family Detached
l
Greater Victoria
Victoria 18 $20,814,400
Victoria West 1 $775,000
Oak Bay 8 $16,735,000
Esquimalt 5 $4,132,500
View Royal 5 $4,350,000
Saanich East 16 $19,937,500
Saanich West 13 $10,953,000
Central Saanich 6 $7,965,000
North Saanich 9 $14,659,000
Sidney 1 $680,000
Colwood 10 $10,310,000
Langford 22 $25,139,299
Sooke 12 $10,654,850
Gulf Islands 9 $9,285,000
Waterfront (all districts) 11 $27,430,000
Total Greater Victoria 146 $183,820,549
Other Areas
Malahat Area 9 $8,864,000
Waterfront (all districts) 1 $1,455,000
Total Other Areas 10 $10,319,000
Total Single Family Detached 156 $194,139,549
Condo Apartment
l
Greater Victoria
Victoria 45 $23,099,500
Victoria West 2 $1,389,400
Oak Bay 2 $1,937,000
Esquimalt 6 $3,172,396
View Royal 1 $432,500
Saanich East 7 $3,529,000
Saanich West 4 $2,107,000
Central Saanich 1 $750,000
Sidney 2 $911,000
Colwood 1 $785,000
Langford 16 $8,111,999
Waterfront (all districts) 7 $5,433,900
Total Greater Victoria 94 $51,658,695
Total Condo Apartment 94 $51,658,695
Page 1 of 3
Victoria Real Estate Board Multiple Listing Service ®
20. Monthly Sales Summary (Mark II)
Waterfront Properties Segregated Into a 'Waterfront' District
Units Total Volume
December 2022
District
Produced: 02-Jan-2023
Row/Townhouse
l
Greater Victoria
Victoria 4 $3,159,900
Esquimalt 1 $665,000
View Royal 9 $6,353,000
Saanich East 7 $5,750,000
Saanich West 1 $810,000
Central Saanich 3 $1,984,800
Sidney 3 $1,785,000
Colwood 5 $3,835,000
Langford 6 $4,497,000
Waterfront (all districts) 2 $1,860,900
Total Greater Victoria 41 $30,700,600
Total Row/Townhouse 41 $30,700,600
Manufactured Home
l
Greater Victoria
View Royal 4 $941,000
Sidney 1 $515,000
Langford 3 $1,900,000
Sooke 1 $426,000
Gulf Islands 0 ($235,000)
Total Greater Victoria 9 $3,547,000
Total Manufactured Home 9 $3,547,000
Total Residential 300 $280,045,844
Page 2 of 3
Victoria Real Estate Board Multiple Listing Service ®
21. Monthly Sales Summary (Mark II)
Waterfront Properties Segregated Into a 'Waterfront' District
Units Total Volume
December 2022
District
Produced: 02-Jan-2023
$285,256,459
320
Grand Totals
Other Property
Lots Acreage
l
Greater Victoria
Oak Bay 1 $475,000
Sooke 2 $827,750
Gulf Islands 2 $1,148,000
Total Greater Victoria 5 $2,450,750
Total Lots Acreage 5 $2,450,750
15 $2,759,865
Other Commercial Properties
l
Page 3 of 3
Victoria Real Estate Board Multiple Listing Service ®
22. Sales to Active Listings Ratio
The ratio of counts of total residential sales over total active residential listings for the last 25 months
December 2022
Produced: 02-Jan-2023
10%
20%
30%
40%
50%
60%
70%
80%
90%
100%
110%
120%
Dec
2020
Jan
2021
Feb
2021
Mar
2021
Apr
2021
May
2021
Jun
2021
Jul
2021
Aug
2021
Sep
2021
Oct
2021
Nov
2021
Dec
2021
Jan
2022
Feb
2022
Mar
2022
Apr
2022
May
2022
Jun
2022
Jul
2022
Aug
2022
Sep
2022
Oct
2022
Nov
2022
Dec
2022
The Sales to Active Listings Ratio
This chart tracks the ratio of total residential sales over total active residential listings at month-end for
each of the last 25 months.
The active listing count and the sales count can be viewed as indicators of housing supply and
demand respectively. Observing the ratio between them can thus help indicate a buyers' market,
where there is sustained downward pressure on prices, and a sellers' market, where there is
sustained upward pressure on prices.
Based on a regression analysis performed by the Economics Department of the BC Real Estate
Association in each market area of the province, the Sales to Active Listings Ratio for Victoria can be
interpreted as follows:
- below 14%, there is downward pressure on prices (buyers' market)
- above 20%, there is upward pressure on prices (sellers' market)
- in the 14-20% range, there is little pressure on prices either way (balanced market)
Victoria Real Estate Board Multiple Listing Service ® Page 1 of 1
23. Monthly Comparative Activity By Property Type
Includes All MLS® Property Types
December 2022
Current Month
This Year % Change
Last Year
Year To Date
This Year % Change
Last Year
Produced: 02-Jan-2023
Single Family - Residential
Units Listed 123
Units Sold 122
Sell/List Ratio 99
Sales Dollars $142,707,049
Average Price / Unit $1,169,730
Price Ratio 95
Days To Sell 44
Active Listings at Month End 457
%
%
129
168
130
$214,742,903
$1,278,232
104
22
121
%
%
-5
-27
-34
-8
104
278
%
%
%
%
%
%
4733
2576
54
$3,286,757,412
$1,275,915
101
21
%
%
4393
3708
84
$4,294,168,818
$1,158,082
103
19
%
%
8
-31
-23
10
11
%
%
%
%
%
Single Family - Residential Waterfront
Units Listed 10
Units Sold 12
Sell/List Ratio 120
Sales Dollars $28,885,000
Average Price / Unit $2,407,083
Price Ratio 94
Days To Sell 86
Active Listings at Month End 83
%
%
8
8
100
$16,935,000
$2,116,875
97
31
35
%
%
25
50
71
14
181
137
%
%
%
%
%
%
456
179
39
$449,768,162
$2,512,671
96
45
%
%
343
246
72
$497,589,846
$2,022,723
99
48
%
%
33
-27
-10
24
-7
%
%
%
%
%
Single Family - Residential Acreage
Units Listed 10
Units Sold 10
Sell/List Ratio 100
Sales Dollars $13,173,000
Average Price / Unit $1,317,300
Price Ratio 95
Days To Sell 41
Active Listings at Month End 94
%
%
13
19
146
$34,938,000
$1,838,842
99
54
30
%
%
-23
-47
-62
-28
-25
213
%
%
%
%
%
%
533
248
47
$376,988,343
$1,520,114
98
35
%
%
459
369
80
$574,526,452
$1,556,982
100
41
%
%
16
-33
-34
-2
-15
%
%
%
%
%
Condo Apartment
Units Listed 112
Units Sold 94
Sell/List Ratio 84
Sales Dollars $51,658,695
Average Price / Unit $549,561
Price Ratio 97
Days To Sell 35
Active Listings at Month End 366
%
%
134
152
113
$100,788,047
$663,079
102
18
141
%
%
-16
-38
-49
-17
100
160
%
%
%
%
%
%
3569
2276
64
$1,463,072,978
$642,826
101
21
%
%
4003
3449
86
$1,939,213,390
$562,254
100
26
%
%
-11
-34
-25
14
-17
%
%
%
%
%
Page 1 of 8
Victoria Real Estate Board Multiple Listing Service ®
24. Monthly Comparative Activity By Property Type
Includes All MLS® Property Types
December 2022
Current Month
This Year % Change
Last Year
Year To Date
This Year % Change
Last Year
Produced: 02-Jan-2023
Row/Townhouse
Units Listed 35
Units Sold 41
Sell/List Ratio 117
Sales Dollars $30,700,600
Average Price / Unit $748,795
Price Ratio 98
Days To Sell 40
Active Listings at Month End 143
%
%
49
49
100
$40,320,916
$822,876
104
16
39
%
%
-29
-16
-24
-9
160
267
%
%
%
%
%
%
1271
759
60
$657,816,481
$866,688
102
21
%
%
1288
1134
88
$834,636,850
$736,011
102
22
%
%
-1
-33
-21
18
-6
%
%
%
%
%
Half Duplex (Up and Down)
Units Listed 0
Units Sold 0
Sell/List Ratio
Sales Dollars $0
Average Price / Unit
Price Ratio
Days To Sell
Active Listings at Month End 1
%
%
0
0
$0
2
%
%
-50
%
%
%
%
%
%
19
10
53
$12,495,000
$1,249,500
96
65
%
%
25
17
68
$17,734,200
$1,043,188
101
23
%
%
-24
-41
-30
20
186
%
%
%
%
%
Half Duplex (Side by Side)
Units Listed 10
Units Sold 8
Sell/List Ratio 80
Sales Dollars $5,965,000
Average Price / Unit $745,625
Price Ratio 98
Days To Sell 30
Active Listings at Month End 31
%
%
8
5
63
$4,320,524
$864,105
104
12
8
%
%
25
60
38
-14
145
288
%
%
%
%
%
%
309
166
54
$146,561,301
$882,899
102
23
%
%
272
241
89
$193,679,255
$803,648
103
21
%
%
14
-31
-24
10
5
%
%
%
%
%
Half Duplex (Front and Back)
Units Listed 2
Units Sold 3
Sell/List Ratio 150
Sales Dollars $2,509,500
Average Price / Unit $836,500
Price Ratio 98
Days To Sell 38
Active Listings at Month End 4
%
%
1
0
$0
1
%
%
100
300
%
%
%
%
%
%
62
29
47
$25,788,300
$889,252
100
26
%
%
40
31
78
$25,604,050
$825,937
104
18
%
%
55
-6
1
8
47
%
%
%
%
%
Page 2 of 8
Victoria Real Estate Board Multiple Listing Service ®
25. Monthly Comparative Activity By Property Type
Includes All MLS® Property Types
December 2022
Current Month
This Year % Change
Last Year
Year To Date
This Year % Change
Last Year
Produced: 02-Jan-2023
Recreational
Units Listed 2
Units Sold 0
Sell/List Ratio
Sales Dollars $0
Average Price / Unit
Price Ratio
Days To Sell
Active Listings at Month End 8
%
%
3
4
133
$232,000
$58,000
100
10
6
%
%
-33
-100
-100
33
%
%
%
%
%
%
37
20
54
$4,932,606
$246,630
95
59
%
%
36
36
100
$6,764,000
$187,889
101
172
%
%
3
-44
-27
31
-66
%
%
%
%
%
Manufactured Home
Units Listed 5
Units Sold 9
Sell/List Ratio 180
Sales Dollars $3,547,000
Average Price / Unit $394,111
Price Ratio 93
Days To Sell 71
Active Listings at Month End 40
%
%
7
7
100
$1,993,400
$284,771
100
74
26
%
%
-29
29
78
38
-4
54
%
%
%
%
%
%
267
179
67
$66,155,978
$369,586
98
39
%
%
253
180
71
$61,725,556
$342,920
99
37
%
%
6
-1
7
8
6
%
%
%
%
%
Residential Lots
Units Listed 13
Units Sold 3
Sell/List Ratio 23
Sales Dollars $1,116,750
Average Price / Unit $372,250
Price Ratio 96
Days To Sell 86
Active Listings at Month End 90
%
%
13
3
23
$1,919,000
$639,667
96
26
32
%
%
0
0
-42
-42
232
181
%
%
%
%
%
%
322
87
27
$51,639,169
$593,554
96
34
%
%
279
225
81
$120,743,329
$536,637
98
75
%
%
15
-61
-57
11
-55
%
%
%
%
%
Residential Lots - Waterfront
Units Listed 0
Units Sold 0
Sell/List Ratio
Sales Dollars $0
Average Price / Unit
Price Ratio
Days To Sell
Active Listings at Month End 15
%
%
1
1
100
$2,157,000
$2,157,000
98
25
4
%
%
-100
-100
-100
275
%
%
%
%
%
%
40
8
20
$5,108,100
$638,513
98
50
%
%
37
34
92
$23,962,700
$704,785
97
151
%
%
8
-76
-79
-9
-67
%
%
%
%
%
Page 3 of 8
Victoria Real Estate Board Multiple Listing Service ®
26. Monthly Comparative Activity By Property Type
Includes All MLS® Property Types
December 2022
Current Month
This Year % Change
Last Year
Year To Date
This Year % Change
Last Year
Produced: 02-Jan-2023
Residential Acreage
Units Listed 2
Units Sold 1
Sell/List Ratio 50
Sales Dollars $560,000
Average Price / Unit $560,000
Price Ratio 93
Days To Sell 76
Active Listings at Month End 52
%
%
5
5
100
$5,020,000
$1,004,000
99
68
20
%
%
-60
-80
-89
-44
12
160
%
%
%
%
%
%
150
48
32
$38,272,700
$797,348
95
74
%
%
118
97
82
$67,585,760
$696,760
99
93
%
%
27
-51
-43
14
-21
%
%
%
%
%
Residential Acreage - Waterfront
Units Listed 1
Units Sold 1
Sell/List Ratio 100
Sales Dollars $774,000
Average Price / Unit $774,000
Price Ratio 97
Days To Sell 55
Active Listings at Month End 20
%
%
1
1
100
$935,000
$935,000
95
160
4
%
%
0
0
-17
-17
-66
400
%
%
%
%
%
%
39
9
23
$8,202,380
$911,376
95
79
%
%
30
35
117
$38,769,900
$1,107,711
94
163
%
%
30
-74
-79
-18
-51
%
%
%
%
%
Revenue - Duplex/Triplex
Units Listed 1
Units Sold 1
Sell/List Ratio 100
Sales Dollars $900,000
Average Price / Unit $900,000
Price Ratio 95
Days To Sell 8
Active Listings at Month End 7
%
%
3
3
100
$4,317,000
$1,439,000
104
30
1
%
%
-67
-67
-79
-37
-73
600
%
%
%
%
%
%
67
37
55
$51,560,999
$1,393,541
98
19
%
%
95
61
64
$73,187,296
$1,199,792
102
20
%
%
-29
-39
-30
16
-4
%
%
%
%
%
Revenue - Multi Units
Units Listed 2
Units Sold 0
Sell/List Ratio
Sales Dollars $0
Average Price / Unit
Price Ratio
Days To Sell
Active Listings at Month End 21
%
%
0
4
$10,150,000
$2,537,500
96
62
11
%
%
-100
-100
91
%
%
%
%
%
%
91
20
22
$37,872,000
$1,893,600
101
69
%
%
71
42
59
$104,696,388
$2,492,771
96
71
%
%
28
-52
-64
-24
-2
%
%
%
%
%
Page 4 of 8
Victoria Real Estate Board Multiple Listing Service ®
27. Monthly Comparative Activity By Property Type
Includes All MLS® Property Types
December 2022
Current Month
This Year % Change
Last Year
Year To Date
This Year % Change
Last Year
Produced: 02-Jan-2023
Revenue - Apartment Block
Units Listed 0
Units Sold 0
Sell/List Ratio
Sales Dollars $0
Average Price / Unit
Price Ratio
Days To Sell
Active Listings at Month End 0
%
%
0
0
$0
0
%
%
%
%
%
%
%
%
0
0
$0
%
%
0
0
$0
%
%
%
%
%
%
%
Revenue - Commercial
Units Listed 2
Units Sold 2
Sell/List Ratio 100
Sales Dollars $1,700,000
Average Price / Unit $850,000
Price Ratio 93
Days To Sell 119
Active Listings at Month End 28
%
%
0
1
$249,900
$249,900
100
92
20
%
%
100
580
240
29
40
%
%
%
%
%
%
87
32
37
$52,780,112
$1,649,379
96
66
%
%
96
45
47
$46,003,196
$1,022,293
96
102
%
%
-9
-29
15
61
-36
%
%
%
%
%
Revenue - Industrial
Units Listed 1
Units Sold 0
Sell/List Ratio
Sales Dollars $0
Average Price / Unit
Price Ratio
Days To Sell
Active Listings at Month End 15
%
%
5
3
60
$4,900,000
$1,633,333
108
43
12
%
%
-80
-100
-100
25
%
%
%
%
%
%
41
24
59
$27,052,600
$1,127,192
99
70
%
%
38
18
47
$26,341,868
$1,463,437
100
71
%
%
8
33
3
-23
-2
%
%
%
%
%
Business with Land Building
Units Listed 0
Units Sold 0
Sell/List Ratio
Sales Dollars $0
Average Price / Unit
Price Ratio
Days To Sell
Active Listings at Month End 3
%
%
0
0
$0
3
%
%
0
%
%
%
%
%
%
7
1
14
$2,435,000
$2,435,000
84
226
%
%
7
2
29
$3,403,186
$1,701,593
85
142
%
%
0
-50
-28
43
59
%
%
%
%
%
Page 5 of 8
Victoria Real Estate Board Multiple Listing Service ®
28. Monthly Comparative Activity By Property Type
Includes All MLS® Property Types
December 2022
Current Month
This Year % Change
Last Year
Year To Date
This Year % Change
Last Year
Produced: 02-Jan-2023
Business Only
Units Listed 4
Units Sold 5
Sell/List Ratio 125
Sales Dollars $1,057,900
Average Price / Unit $211,580
Price Ratio 89
Days To Sell 99
Active Listings at Month End 57
%
%
4
0
$0
38
%
%
0
50
%
%
%
%
%
%
120
29
24
$4,199,900
$144,824
84
108
%
%
97
14
14
$3,256,500
$232,607
92
167
%
%
24
107
29
-38
-35
%
%
%
%
%
Motel/Hotel
Units Listed 0
Units Sold 0
Sell/List Ratio
Sales Dollars $0
Average Price / Unit
Price Ratio
Days To Sell
Active Listings at Month End 0
%
%
0
0
$0
0
%
%
%
%
%
%
%
%
0
0
$0
%
%
0
0
$0
%
%
%
%
%
%
%
Lease - Office
Units Listed 10
Units Sold 4
Sell/List Ratio 40
Sales Dollars $1,866
Average Price / Unit $467
Price Ratio 100
Days To Sell 97
Active Listings at Month End 70
%
%
2
2
100
$42
$21
100
64
44
%
%
400
100
4343
2121
52
59
%
%
%
%
%
%
125
31
25
$75,172
$2,425
1422
136
%
%
96
23
24
$2,181
$95
97
130
%
%
30
35
3347
2458
5
%
%
%
%
%
Lease - Retail
Units Listed 11
Units Sold 1
Sell/List Ratio 9
Sales Dollars $35
Average Price / Unit $35
Price Ratio 100
Days To Sell 11
Active Listings at Month End 51
%
%
7
0
$0
30
%
%
57
70
%
%
%
%
%
%
79
18
23
$4,303
$239
100
84
%
%
74
27
36
$353,857
$13,106
86
129
%
%
7
-33
-99
-98
-35
%
%
%
%
%
Page 6 of 8
Victoria Real Estate Board Multiple Listing Service ®
29. Monthly Comparative Activity By Property Type
Includes All MLS® Property Types
December 2022
Current Month
This Year % Change
Last Year
Year To Date
This Year % Change
Last Year
Produced: 02-Jan-2023
Lease - Warehouse
Units Listed 0
Units Sold 0
Sell/List Ratio
Sales Dollars $0
Average Price / Unit
Price Ratio
Days To Sell
Active Listings at Month End 0
%
%
0
0
$0
0
%
%
%
%
%
%
%
%
0
0
$0
%
%
0
0
$0
%
%
%
%
%
%
%
Lease - Industrial
Units Listed 1
Units Sold 3
Sell/List Ratio 300
Sales Dollars $64
Average Price / Unit $21
Price Ratio 98
Days To Sell 42
Active Listings at Month End 14
%
%
0
2
$20
$10
91
72
3
%
%
50
218
112
-41
367
%
%
%
%
%
%
32
9
28
$90,154
$10,017
3393
48
%
%
17
5
29
$69
$14
97
56
%
%
88
80
131512
73018
-14
%
%
%
%
%
Lease - Other
Units Listed 1
Units Sold 0
Sell/List Ratio
Sales Dollars $0
Average Price / Unit
Price Ratio
Days To Sell
Active Listings at Month End 2
%
%
1
0
$0
4
%
%
0
-50
%
%
%
%
%
%
6
3
50
$530,046
$176,682
97
101
%
%
10
3
30
$2,890,623
$963,541
4899361
75
%
%
-40
0
-82
-82
35
%
%
%
%
%
Commercial Land
Units Listed 3
Units Sold 0
Sell/List Ratio
Sales Dollars $0
Average Price / Unit
Price Ratio
Days To Sell
Active Listings at Month End 16
%
%
5
1
20
$2,750,000
$2,750,000
100
997
17
%
%
-40
-100
-100
-6
%
%
%
%
%
%
38
6
16
$32,560,000
$5,426,667
96
82
%
%
29
10
34
$19,962,500
$1,996,250
95
301
%
%
31
-40
63
172
-73
%
%
%
%
%
Page 7 of 8
Victoria Real Estate Board Multiple Listing Service ®
30. Monthly Comparative Activity By Property Type
Includes All MLS® Property Types
December 2022
Current Month
This Year % Change
Last Year
Year To Date
This Year % Change
Last Year
Produced: 02-Jan-2023
Units Listed 361
Units Sold 320
Sell/List Ratio 89
Sales Dollars $285,256,459
Average Price / Unit $891,426
Price Ratio 96
Days To Sell 45
Active Listings at Month End 1688
%
%
Grand Totals
399
438
110
$446,668,752
$1,019,792
103
26
652
%
%
-10
-27
-36
-13
73
159
%
%
%
%
%
%
12500
6804
54
$6,802,719,196
$999,812
101
25
%
%
12206
10052
82
$8,976,801,770
$893,036
102
29
%
%
2
-32
-24
12
-12
%
%
%
%
%
Page 8 of 8
Victoria Real Estate Board Multiple Listing Service ®