SlideShare une entreprise Scribd logo
1  sur  68
Télécharger pour lire hors ligne
1
CHAPTER-1
INTRODUCTION OF THE TOPIC
BALANCE SHEET
Meaning:
A Balance Sheet is one of the financial statements. A Balance Sheet is a statement of assets and
liabilities of an enterprise at a given date. It is also called Statement of Financial Position.
FEATURES OF BALANCE SHEET:
• A balance sheet is only a statement and not an account. It has no debit side or credit side.
The headings of the two sides are ‘Assets’ and ‘Liabilities’.
• It is prepared at a particular point of time and not for a particular period. The information
contained in it is true only at the particular point of time at which it is prepared.
• It is a summary of balances of those ledger accounts which have not been closed by
transfer to the Trading and P & L Account.
• It shows the nature and value of assets and the nature and the amount of liabilities at a
given date.
NEED OF BALANCE SHEET:
• To ascertain the nature and value of assets of a business.
• To ascertain the nature and amount of liabilities of a business.
• To find out the financial solvency of an enterprise. An enterprise is considered to be a
solvent if its assets exceed its external liabilities.
CONTENTS OF BALANCE SHEET
2
ITEMS OF B/S - EQUITY & LIABILITIES
Equity is the residual interest of owners in the assets of the entity after deducting all its
liabilities. It is also called Shareholders’ Fund or Capital
Liability is a present obligation of the arising from past events, the settlement of which is
expected to result in an outflow from the entity of resources embodying economic benefits.
Shareholders’ Funds
(a) Share Capital –
It is the amount contributed by the shareholders towards the company’s capital and is
entered in the company’s share capital account.
(b) Reserves and Surplus –
It is a profit achieved by a company where a certain amount of it is put back into the
business which can help the business in their rainy days
ITEMS OF B/S – NON-CURRENT LIABILITIES
Those obligations that do not meet the criteria for being classified as current liabilities are
simply called non-current liabilities. For e.g. Mortgage, bonds and long term leases etc.
(a) Long-Term Borrowings –
Loans taken for a time period exceeding 12 months are classified as long term borrowings.
(b) Deferred Tax Liabilities -
The tax effect of taxable temporary differences is recognized as deferred tax liabilities which
are payable beyond 1 year period.
(c) Long-Term Provisions –
It includes Provision for Employee Benefits.
ITEMS OF B/S – CURRENT LIABILITIES
These are normally paid by using existing current assets, creating other current liabilities or
fulfilling contractual obligations to provide goods or services.
E.g. Bills Payables, Trade Payables, Bank Overdraft etc.
(a) Short-Term Borrowings –
It includes Loans repayable on demand from banks and other loans payable within duration
of 12 months like commercial papers.
(b) Trade Payables -
The trade payables show the amounts owed to suppliers for purchases of goods and services
on credit.
(c) Other Current Liabilities –
It may include advances from customers and other short term obligations of the company.
(d) Short-Term Provisions –
Provision for Employee Benefits, Proposed Dividend, Provision for Tax on Distributed
Profit.
ITEMS OF B/S – ASSETS
An asset is a resource controlled by the entity as a result of past events and from which future
economic benefits are expected to flow to the entity.
For e.g. Land, Building, Machinery, Equipment etc.
ITEMS OF B/S – NON-CURRENT ASSETS
3
(a) Fixed Asset -
A fixed asset is an asset held with the intention of being used for the purpose of producing or
supplying goods or services and is not held for sale in the normal course of business.
 Tangible Fixed Assets –
These have physical existence and can be seen and felt. For e.g. Land, Buildings,
Furniture, Equipment etc.
 Intangible Fixed Assets –
These are identifiable non-monetary assets, without physical substance, held for use in
the production or supply of goods or services, for rental to others, or for administrative
purposes. For e.g. Brand Names, Copyrights, Goodwill, Patent etc.
 Capital Work-In-Progress –
It is referred to as assets under construction that is not considered to be final product but
must still be accounted for because funds have been invested towards its production.
(b) Non-Current Investments –
It is the investment which is for long period and not releasable for current period. For e.g.
investment in equity instruments (subsidiary companies, associate companies), joint venture
and in preference shares and in partnership firm.
(c) Long-Term Loans and Advances –
It includes secured and unsecured loans and advances with duration of more than 12 months.
(d) Other Non-Current Assets –
It includes secured and unsecured interest accrued on loans.
ITEMS OF B/S – CURRENT ASSETS
Cash and other assets that are expected to be realized in cash or sold or consumed during
the normal operating cycle of the entity or within one year, whichever is longer, are called
current assets.
(a) Current Investment –
A current investment that is by its nature readily realizable and is intended to be held for not
more than one year from the date on which such investment is made.
For e.g. Investment in Mutual Funds.
(b) Inventories –
Inventories are assets which held for sale in the ordinary course of business; in the process of
production for such sale or in the form of materials or supplies to be consumed in the
production process or in the rendering of services.
(c) Trade Receivables –
It includes the amounts receivable from customers for sales of goods or services on credit.
(d) Cash and Bank Balances –
It shows receipts and payments of cash. Cash includes coins, currency, cheques and amounts
deposited in banks.
(e) Short-Term Loans and Advances –
It includes loans and advances like loans to employees, advances to suppliers, loans and
advances to subsidiary and associate companies etc.
(f) Other Current Assets –
It includes interest accrued on loans and deposits and other receivables.
4
BALANCE SHEET – REVISED FORMAT
(Rupees in ………………)
PATICULAR NOTES
NO.
CURRENT
REPORTING
PERIOD
PREVIOUS
REPORTING
PERIOD
I.EQUITY AND LIABILITIES
1)SHAREHOLDERS’ FUNDS
a)share capital *** ***
b)reserves and surplus *** ***
c)money received against share warrants *** ***
2)SHARE APPLICATION MONEY PENDING
ALLOTMENT
*** ***
3)NON-CURRENT LIABILITIES
a)long-term borrowings *** ***
b)deferred tax liab.(net) *** ***
c)other long term liabilities *** ***
d)long-term provision *** ***
4)CURRENT LIABILITIES
a)short-term borrowings *** ***
b)trade payables *** ***
c)others current liabilities *** ***
d)short-term provision *** ***
TOTAL *** ***
II.ASSETS
1)NON-CURRENTS ASSETS
a)fixed assets
1.tangible assets *** ***
2.intangible assets *** ***
3.capital work-in-progress *** ***
4.intangible assets under development *** ***
b)non-current investments *** ***
c)deferred tax assets(net) *** ***
e)other non-current assets *** ***
2)CURRENT ASSETS
a)current investments *** ***
b)inventories *** ***
c)trade receivables *** ***
d)cash and cash equivalents *** ***
e)short-term loans and advances *** ***
f)other current assets *** ***
TOTAL *** ***
See accompanying notes to the financial statements.
5
FINANCIAL STATEMENT ANALYSIS:
A sustainable business and mission requires effective planning and financial management. Ratio
analysis is a useful management tool that will improve the understanding of financial results and
trends over time, and provide key indicators of organizational performance. Managers will use
ratio analysis to pinpoint strengths and weaknesses from which strategies and initiatives can be
formed. Funders may use ratio analysis to measure the results against other organizations or
make judgments concerning management effectiveness and mission impact. It is defined as the
process of identifying financial strengths and weaknesses of the firm by properly establishing
relationship between the items of the balance sheet and the profit and loss account. The process
of reviewing and evaluating a company’s financial statements (such as the balance sheet or profit
and loss statement), thereby gaining an understanding of the financial health of the company and
enabling more effective decision making. Financial statements record financial data; however,
this information must be evaluated through financial statement analysis to become more useful to
investors, shareholders, managers and other interested parties. Financial statement analysis is an
evaluative method of determining the past, current and projected performance of a company.
For ratios to be useful and meaningful, they must be:
o Calculated using reliable, accurate financial information
o Calculated consistently from period to period
o Used in comparison to internal benchmarks and goals
o Used in comparison to other companies in the industry
o Viewed both at a single point in time and as an indication of broad trends and issues over time
o carefully interpreted in the proper context, considering there are many other important factors
and indicators involved in assessing performance.
o to provide analytical information to all interested parties.
o to justify and analyze the earning capacity of the firm
o To justify and analyze the financial position of the firm
o To evaluate operations of the firm.
o To evaluate progress of the business of the firm
o To utilize resources properly and effectively
o To analyze and evaluate management efficiency.
6
RATIO
PURPOSE AND USE OF RATIO ANALYSIS:
A primary advantage of ratios is that they can be used to compare the risk and return
relationships of firms of different sizes. Ratios can also provide a profile of a firm, its economic
characteristics and competitive strategies, and its unique operating, financial and investment
characteristics. However, be deceptive as it ignores differences among industries, the effect of
varying capital structure and differences bin accounting and reporting methods. Given these
differences, changes in a ratio and variability over time may be more informative than the level
of the ratio at any point in time.
RATIO ANALYSIS
Ratio analysis is the process of determining and interpreting numerical relationship based on
financial statements. It is the technique of interpretation of financial statements with the help of
accounting ratios derived from the balance sheet and profit and loss account.
 Is a method or process by which the relationship of items or groups of items in the
financial statements are computed, and presented.
 Is an important tool of financial analysis?
 Is used to interpret the financial statements so that the strengths and weaknesses of a firm,
its historical performance and current financial condition can be determined.
RATIO
 ‘A mathematical yardstick that measures the relationship between two figures or groups
of figures which are related to each other and are mutually inter-dependent’.
 It can be expressed as a pure ratio, percentage, or as a rate
WORDS OF CAUTION
 A ratio is not an end in itself. They are only a means to get to know the financial position
of an enterprise.
 Computing ratios does not add any information to the available figures.
 It only reveals the relationship in a more meaningful way so as to enable us to draw
conclusions there from.
UTILITY OF RATIOS
 Accounting ratios are very useful in assessing the financial position and profitability of
an enterprise.
 However its utility lies in comparison of the ratios.
 Comparison may be in any one of the following forms:
 For the same enterprise over a number of years
 For two enterprises in the same industry
 For one enterprise against the industry as a whole
 For one enterprise against a pre-determined standard
 For inter-segment comparison within the same organization
WAYS TO INTERPRET ACCOUNTING RATIOS
 Single absolute ratio.
7
 Group ratio.
 Historical comparison.
 Inter-firm comparison.
 Projected ratios.
FOUR BROAD CATEGORIES MEASURE THE DIFFERENT ASPECTS
OF RISK AND RETURN RELATIONSHIPS:
1. Activity analysis – evaluates revenue and output generated by the firm’s assets
2. Liquidity analysis – measures the adequacy of a firm’s cash resources to meet its near-term
cash obligations.
3. Long-term debt and solvency analysis – examines the firm’s capital structure, including the
mix of its financing sources and the ability of the firm to satisfy its long-term debt and
investment obligations.
4. Profitability analysis – measures the income of the firm relative to its revenues and invested
capital.
IMPORTANCE OF RATIO ANALYSIS:
1. Ratio analysis simplifies and summarizes complex accounting figures and arranges them
systematically for use by different parties.
2. It measures and evaluates the financial condition and operating effectiveness of a business
institution.
3. It aids in diagnosing the financial health of the business. By calculating and studying different
ratios one can analyze the weaknesses and strengths of the business.
4. By analyzing the past performance future can be projected and predicted.
5. It promotes coordination by studying the efficiency and deficiency of different parts of the
business.
6. It assists in communication by conveying necessary information to all related parties.
7. It facilitates the effective control of business operations by means of appraisal targets both
physical and monetary.
8
TYPES OF RATIO:
A: LIQUIDITY RATIO –
Ratios that show the relationship of a firm’s cash and other current assets to its current liabilities.
This includes (i) Current ratio (ii) Quick ratio
B: ASSET MANAGEMENT RATIO –
A set of ratios that measures how effectively a firm is managing its assets. This includes (i)
Inventory turnover ratio (ii) Days sales outstanding or average collection period (iii) Fixed asset
turnover (iv) Total asset turnover
C: DEBT MANAGEMENT RATIO –
Ratios that show the relationship of a firm’s total debt, equity and total assets. This includes (i)
Debt ratio (ii) Debt-equity ratio (iii) Times interest earned ratio (iv) Fixed charge coverage ratio
D: PROFITABILITY RATIO –
A group of ratios showing the effect of liquidity, asset management and debt management on
operating results. This includes (i) Gross profit margin (ii) Operating profit margin (iii) Net
profit margin (iv) Return on total asset (v) Return on common equity (vi) Operating expense
ratio
E: MARKET VALUE RATIO –
A set of ratios that relate the firm’s stock price to its earnings and book value per share. Ratios
under this are (i) Price/earnings ratio (ii) Market value/book value ratio
Ratios may be classified into the following types depending upon the statements from which they
are derived:
(a) Balance sheet ratio: Ratios calculated on the basis of the figures drawn from the balance
sheet. Current ratio, Quick ratio etc.
(b) Profit and loss account ratio: Ratios calculated on the basis of the figures drawn from profit
and loss account. Gross profit ratio, net profit ratio etc.
(c) Composite ratios: Ratios calculated on the basis of the figures drawn from both balance sheet
and profit and loss account. Sales turnover, accounts receivable turnover etc.
Ratios as a tool of financial analysis may be classified into the following types:
(a) Short-term solvency ratios – Current ratio and quick ratio etc.
(b) Financial structure ratios – Debt to equity ratio and debt ratio etc.
(c) Profitability ratios – Return on capital employed and return on total assets etc.
CLASSIFICATION OF RATIOS
 ANALYSIS OF SHORT TERM FINANCIAL POSITION OR TEST
OF LIQUIDITY.
 ANALYSIS OF LONG TERM FINANCIAL POSITION OR TEST
OF SOLVENCY.
 ACTIVITY RATIOS.
 PROFITABILITY RATIOS.
9
TEST OF LIQUIDITY
 The liquidity ratios are used to test the short term solvency or liquidity
position of the business.
 It enables to know whether short term liabilities can be paid out of short term
assets.
 It indicates whether a firm has adequate working capital to carry out routine
business activity.
 It is a valuable aid to management in checking the efficiency with which
working capital is being employed.
 It is also of importance to shareholders and long term creditors in determining
to some extent the prospects of dividend and interest payment.
IMPORTANT RATIOS IN TEST OF LIQUIDITY
 Current ratio.
 Quick ratio.
 Absolute liquid ratio.
CURRENT RATIO
It is the most widely used of all analytical devices based on the balance sheet. It establishes
relationship between total current assets and current liabilities
CURRENT ASSETS
Include –
Inventories of raw material, WIP, finished goods,
Stores and spares,
Sundry debtors/receivables,
Short term loans deposits and advances,
Cash in hand and bank,
Prepaid expenses,
Incomes receivables and
Marketable investments and short term securities.
CURRENT LIABILITIES
Include –
Sundry creditors/bills payable,
Outstanding expenses,
Unclaimed dividend,
Advances received,
Incomes received in advance,
Provision for taxation,
Proposed dividend,
Instalments of loans payable within 12 months,
Bank overdraft and cash credit
10
Current assets
Current ratio=
Current liabilities
IDEAL RATIO: 2:1
High ratio indicates under trading and over capitalization.
Low ratio indicates over trading and under capitalization
QUICK RATIO OR ACID TEST RATIO
It establishes relationship between liquid assets and liquid liabilities. It is a refinement to current
ratio and second testing device for working capital.
Quick assets
Quick ratio=
Current liabilities
IDEAL RATIO: 1:1
Usually, a high acid test ratio is an indication that the firm is liquid and has ability to meet its
current or liquid liabilities in time and on the other hand a low quick ratio represents that the
firm’s liquidity position is not good.
ABSOLUTE LIQUIDITY RATIO
This ratio establishes a relationship between absolute liquid assets to quick liabilities
Absolute liquid assets
Absolute liquid ratio=
Quick liabilities
IDEAL RATIO: 1:2
It means that if the ratio is 1:2 or more than this the concern can be taken as liquid. If the ratio is
less than the standard of 1:2, it means the concern is not liquid
Quick assets = Current asset-(inventories + prepaid expenses)
Quick Liabilities = Current liabilities – Bank overdraft
Absolute liquid assets include cash in hand, cash at bank, marketable securities, temporary
investments
. TEST OF SOLVENCY
 Long term solvency ratios denote the ability of the organization to repay the loan and
interest.
 When an organization's assets are more than its liabilities is known as solvent
organization.
 Solvency indicates that position of an enterprise where it is capable of meeting long term
obligations.
11
IMPORTANT RATIOS IN TEST OF SOLVENCY
 Debt-equity ratio.
 Proprietary ratio.
 Solvency ratio.
 Fixed assets to net worth ratio.
 Current assets to net worth ratio.
 Current liabilities to net worth ratio.
 Capital gearing ratio.
 Fixed assets ratio
 Debt servicing ratio.
 Dividend coverage ratio.
DEBT EQUITY RATIO
It is calculated to measure the relative claims of outsiders and the owners against the firm’s
assets. This ratio indicates the relationship between the outsider’s funds and the shareholders’
funds.
Outsider’s funds
Debt equity ratio=
Shareholders’ funds
IDEAL RATIO: 2:1; It means for every 2 shares there is 1 debt. If the debt is less than 2
times the equity, it means the creditors are relatively less and the financial structure is sound.
If the debt is more than 2 times the equity, the state of long term creditors are more and
indicate weak financial structure.
COMPONENTS OF DEBT EQUITY RATIO
OUTSIDERS FUNDS
Include all debts/liabilities to outsiders, whether long term or short term or whether in the
form of debentures, bonds, mortgages or bills.
SHAREHOLDERS FUNDS
Consists of equity share capital, preference share capital, capital reserves, revenue reserves
and reserves representing accumulated profits and surpluses like reserve for contingencies
sinking funds. The accumulated losses and deferred expenses, if any should be deducted
from the total to find out shareholders’ funds, it is called net worth and the ratio may be
termed as debt to net worth ratio.
PROPRIETARY RATIO OR NET WORTH RATIO
It establishes relationship between the proprietors fund or shareholders’ funds and the total
assets
Proprietary funds Capital employed
Proprietary ratio= or
Total assets Total liabilities
IDEAL RATIO: 0.5:1
Higher the ratio betters the long term solvency (financial) position of the company. This ratio
12
indicates the extent to which the assets of the company can be lost without affecting the
interest of the creditors of the company
COMPONENTS OF PROPRIETARY RATIO:
SHAREHOLDERS FUNDS OR PROPRIETARY FUNDS
Are equity share capital, preference share capital, undistributed profits, reserves and
surpluses. Out of this amount accumulated losses should be deducted.
TOTAL ASSETS
On other hand denote total resources of the concern
SOLVENCY RATIO
It expresses the relationship between total assets and total liabilities of a business. This ratio
is a small variant of equity ratio and can be simply calculated as
100-equity ratio
Total assets
Solvency ratio=
Total liabilities
No standard ratio is fixed in this regard. It may be compared with similar, such organizations
to evaluate the solvency position. Higher the solvency ratio, the stronger is its financial
position and vice-versa
FIXED ASSETS TO NET WORTH
It is obtained by dividing the depreciated book value of fixed assets by the amount of
proprietor’s funds.
Net fixed assets
Fixed assets to net worth ratio=
Net worth
IDEAL RATIO: 0.75:1
A higher ratio, say, 100% means that there are no outside liabilities and all the funds
employed are those of shareholders. In such a case the return to shareholders would be lower
rate of dividend and this is also a sign of over capitalization.
 This ratio shows the extent to which ownership funds are sunk into assets with relatively
low turnover. When the amount of proprietor's funds exceed the value of fixed assets, a
part of the net working capital is provided by the shareholders, provided there are no
other non-current assets, and when proprietor’s funds are less than the fixed assets,
creditors obligation have been used to finance a part of fixed assets. The Yardstick for
this measure is 65% for industrial undertakings.
CURRENT ASSETS TO NET WORTH RATIO
It is obtained by dividing the value of current assets by the amount of proprietor’s funds. The
purpose of this ratio is to show the percentage of proprietor’s fund investment in current
assets.
13
Current assets
Current assets to net worth ratio=
Proprietor’s fund
A higher proportion of current assets to proprietor’s fund, as compared with the proportion of
fixed assets to proprietor’s funds are advocated, as it is an indicator of the financial strength
of the business, depending on the nature of the business there may be different ratios for
different firms. This ratio must be read along with the results of fixed assets to proprietor’s
funds ratio
CURRENT LIABILITIES TO NET WORTH
It is expressed as a proportion and is obtained by dividing current liabilities by proprietor's
fund
Current liabilities
Current liabilities to net worth ratio=
Net worth
IDEAL RATIO: 1:3
This ratio indicates the relative contribution of short term creditors and owners to the capital
of an enterprise. If the ratio is high, it means it is difficult to obtain long term funds by the
business.
CAPITAL GEARING RATIO
It expresses the relationship between equity capital and fixed interest bearing securities and
fixed dividend bearing shares.
Fixed interest bearing securities + fixed dividend
Bearing shares
CGR=
Equity shareholders’ funds
INTERPRETATION OF CAPITAL GEARING RATIO
 When fixed interest bearing securities and fixed dividend bearing shares are higher than
equity shareholders’ funds, the company is said to be ‘highly geared’.
 Where the fixed interest hearing securities and fixed dividend bearing shares share equal
to equity share capital it is said to be ‘evenly geared’.
 When the fixed interest bearing securities and fixed dividend bearing shares are lower
than equity share capital it is said to be ‘low geared’.
 If capital gearing is high, further raising of long term loans may be difficult and issue of
equity shares may be attractive and vice-versa
FIXED ASSETS RATIO
It establishes the relationship between fixed assets and capital employed
Fixed assets
Fixed assets ratio=
Capital employed
14
IDEAL RATIO: 0.67:1
This ratio enables to know how fixed assets are financed i.e. by use of short term funds or by
long term funds. This ratio should not be more than 1.
COMPONENTS OF CAPITAL EMPLOYED:
1. Owners funds, 2.Long-term loans, 3.Long-term deposits, 4.debentures.
FIXED CHARGES COVER OR DEBT SERVICE RATIO
This ratio is determined by dividing net profit by fixed interest charges
Net profit before deduction of interest
And income tax
Debt service ratio=
Fixed interest charges
IDEAL RATIO: 6 OR 7 TIMES;
If the ratio is high it means there is higher margin of safety for the long term lenders and as
such it is not difficult for the business to obtain further long term funds and vice-versa.
This ratio indicates the financial ability of the enterprise to meet interest payment out of
current earnings
DIVIDEND COVER RATIO
It is the ratio between disposable profit and dividend. Disposable profit refers to profit left
over after paying interest on long term borrowing and income tax.
Net profit after interest and tax
Dividend cover ratio=
Dividend declared
This ratio indicates the ability of the business to maintain the dividend on shares in future. If
this ratio is higher is indicates that there is sufficient amount of retained profit.
Even if there is slight decrease in profit in the future it will not affect payment of dividend in
future
ACTIVITY RATIO
 Activity ratios indicate the performance of an organization.
 This indicates the effective utilization of the various assets of the organization.
 Most of the ratio falling under this category is based on turnover and hence
these ratios are called as turnover ratios.
IMPORTANT RATIOS IN ACTIVITY RATIO
 Stock turnover ratio.
 Debtor’s turnover ratio.
 Creditor’s turnover ratio.
 Wording capital turnover ratio.
 Fixed assets turnover ratio.
 Current assets turnover ratio.
15
 Total assets turnover ratio.
 Sales to net worth ratio.
STOCK TURNOVER RATIO
This ratio establishes the relationship between the cost of goods sold during a given period
and the average sock holding during that period. It tells us as to how many times stock has
turned over (sold) during the period. Indicates operational and marketing efficiency. Helps in
evaluating inventory policy to avoid over stocking.
Cost of goods sold
Inventory turnover ratio=
Average stock
Cost of goods sold= sales-gross profit
= opening stock + purchases – closing stock
Opening stock + Closing stock
Average stock=
2
INTERPRETATION OF STOCK TURNOVER RATIO
 IDEAL RATIO: 8 TIMES; a low inventory turnover may reflect dull business, over
investment in inventory, accumulation of stock and excessive quantities of certain
inventory items in relation to immediate requirements.
 A high ratio may not be accompanied by a relatively high net income as; profits may be
sacrificed in obtaining a large sales volume (unless accompanied by a larger total gross
profit). It may indicate under investment in inventories. But generally, a high stock
turnover ratio means that the concern is efficient and hence it sells its goods quickly.
DEBTOR TURNOVER RATIO
This ratio explains the relationship of net credit sales of a firm to its book debts indicating the
rate at which cash is generated by turnover of receivables or debtors.
The purpose of this ratio is to measure the liquidity of the receivables or to find out the
period over which receivables remain uncollected.
Net credit sales
Debtor turnover ratio=
Average Debtors
Opening balance + closing balance
Average debtors=
2
Debtors include bills receivables along with book debts
When information about opening and closing balances of trade debtors is not available then
the debtor turnover ratio can be calculated by dividing the total sales by the balances of
debtors
Debtor turnover ratio = total sales/debtors
16
AVERAGE COLLECTION PERIOD
The average collection period represents the average number of days for which a firm has to
wait before its receivables are converted into cash
Number of working day in year
Average collection period=
Debtor turnover ratio
INTERPRETATION OF DEBTOR TURNOVER RATIO
 IDEAL RATIO: 10 TO 12 TIMES; debt collection period of 30 to 36 days is
considered ideal.
 A high debtor turnover ratio or low collection period is indicative of sound management
policy.
 The amount of trade debtors at the end of period should not exceed a reasonable
proportion of net sales. Larger the trade debtors greater the expenses of collection.
CREDITORS TURNOVER RATIO
This ratio indicates the number of times the creditors are paid in a year. It is useful for
creditors in finding out how much time the firm is likely to take in repaying its trade
creditors.
Net credit purchases
Creditors turnover ratio=
Average creditors
Opening balance + closing balance
Average creditors=
2
Number of working days
Average payment period=
Creditor’s turnover ratio
If information about credit purchases is not available, total purchases may be taken; if
opening and closing balances of creditors are not given the balances of creditors may be
taken.
Trade creditors include sundry creditors and bills payable.
INTERPRETATION OF CREDITOR TURNOVER RATIO
 IDEAL RATIO: 12 TIMES; debt payment period of 30 days is considered ideal.
 Very less creditor’s turnover ratio or a high debt payment period may indicate the firm’s
inability in meeting its obligation in time.
WORKING CAPITAL TURNOVER RATIO
This ratio indicates the number of times the working capital is turned over in the course of the
year. Measures efficiency in working capital usage. It establishes relationship between cost of
sales and working capital.
17
Cost of sales
Working capital turnover ratio=
Average working capital
Opening + closing working capital
Average working capital=
2
If cost of sales is not given, then sales can be used. If opening working capital is not disclosed
then working capital at the year-end will be used.
Working capital turnover ratio= cost of sales (sales)/net working capital.
INTERPRETATION OF WORKING CAPITAL TURNOVER RATIO
 A higher ratio indicates efficient utilization of working capital and a low ratio indicates
inefficient utilization of working capital.
 But a very high ratio is not a good situation for any firm and hence care must be taken
while interpreting the ratio.
FIXED ASSETS TURNOVER RATIO
This ratio establishes a relationship between fixed assets and sales.
Net sales
Fixed assets turnover ratio=
Fixed assets
IDEAL RATIO: 5 TIMES
A high ratio indicates better utilization of fixed assets.
A low ratio indicates underutilization of fixed assets.
TOTAL ASSET TURNOVER RATIO
This ratio establishes a relationship between total assets and sales. This ratio enables to know the
efficient utilization of total assets of a business
Net sales
Total assets turnover ratio=
Total assets
IDEAL RATIO: 2 TIMES
High ratio indicates efficient utilization and ratio less than 2 indicates under utilization
PROFITABILITY RATIO
 Profitability ratios indicate the profit earning capacity of a business.
 Profitability ratios are calculated either in relation to sales or in relation to investments.
 Profitability ratios can be classified into two categories.
a) General Profitability Ratios.
b) Overall Profitability Ratios.
GENERAL PROFITABILITY RATIOS
 Gross profit ratio.
 Net profit ratio.
18
 Operating ratio.
 Operating profit ratio.
 Expense ratio.
GROSS PROFIT RATIO
It expresses the relationship of gross profit to net sales and is expressed in terms of percentage.
This ratio is a tool that indicates the degree to which selling price of goods per unit may decline
without resulting in losses.
Gross profit
Gross profit ratio= X 100
Net sales
A low gross profit ratio may indicate unfavorable purchasing, the instability of management to
develop sales volume thereby making it impossible to buy goods in large volume.
Higher the gross profit ratio betters the results.
NET PROFIT RATIO
It expresses the relationship between net profits after taxes to sales. Measure of overall
profitability useful to proprietors, as it gibes an idea of the efficiency as well as profitability of
the business to a limited extent.
Net profit after taxes
Net profit ratio= X 100
Net sales
Higher the ratio better is the profitability
Generally non-operating incomes and expenses are excluded from the net profits for calculating
this ratio
OPERATING RATIO
This ratio establishes a relationship between cost of goods sold plus other operating expenses and
net sales. This ratio is calculated mainly to ascertain the operational efficiency of the
management in their business operations.
Cost of goods sold + operating expenses
Operating ratio=
Net sales
Higher the ratio the less favorable it is because it would leave a smaller margin to meet interest,
dividend and other corporate needs. For a manufacturing concern it is expected to touch a
percentage of 75% to 85%. This ratio is partial index of overall profitability.
OPERATING PROFIT RATIO
This ratio establishes the relationship between operation profit and net sales.
Operating profit
Operating profit ratio= X 100
Net sales
Operating profit ratio= 100-operating ratio
19
Operating profit= Net sales – (cost of goods sold + Administrative and office expenses + selling
and distributive expenses.
EXPENSES RATIO
It establishes relationship between individual operation expenses and net sales revenue.
Cost of goods sold
1. Cost of goods sold ratio= X 100
Net sales
Office and admin exp.
2. Admin. And office exp. ratio= X100
Net sales
Selling and dist. Exp.
3. Selling and distribution ratio= X 100
Net sales
Non-operating expense
4. Non-operating expense ratio= X 100
Net sales
TEST OF OVERALL PROFITABILITY
 Return on shareholders’ investment or Net worth ratio.
 Return on equity capital.
 Return on capital employed.
 Return on total resources.
 Dividend yield ratio.
 Preference dividend cover ratio.
 Equity dividend cover ratio.
 Price covering ratio.
 Dividend payout ratio.
 Earnings per share.
RETURN ON SHAREHOLDERS INVESTMENT
Shareholders’ investment also called return on proprietor’s funds is the ratio of net profit to
proprietor’s funds. It is calculated by the prospective investor in the business to find out whether
the investment would be worth-making in terms of return as compared to the risk involved in the
business.
Net profit (After tax and int)
Return on shareholders’ investment=
Proprietor’s funds
 This ratio is of great importance to the present and prospective shareholders as well as the
management of the company. As this ratio reveals how well the resources of a firm are
being used, higher the ratio, better are the results. The return on shareholders’ investment
should be compared with the return of other similar firms in the same industry. The inter
20
firm comparison of this ratio determines whether their investments in the firm are
attractive or not as the investors would like to invest only where their return is higher.
Similarly, trend ratios can also be calculated for a number of years to get5 and idea of the
prosperity, growth of deterioration in the company’s profitability and efficiency.
RETURN ON EQUITY CAPITAL
This ratio establishes the relationship between net profit available to equity shareholders and the
amount of capital invested by them. It is used to compare the performance of company's equity
capital with those of other companies, and thus help the investor in choosing a company with
higher return on equity capital.
Net profit – preference dividend
Return on equity capital=
Equity share capital (paid up)
RETURN ON CAPITAL EMPLOYED
This ratio is the most appropriate indicator of the earning power of the capital employed in
the business. It also acts as a pointer to the management showing the progress or
deterioration in the earning capacity and efficiency of the business.
Net profit before taxes and
Interest on long – term loans and debentures
Return on capital employed=
Capital employed
IDEAL RATIO: 15%
If the actual ratio is equal ratio is equal to or above 15% it indicates higher productivity of the
capital employed and vice versa
Proprietors net capital employed = fixed assets + current assets – outside liabilities (both long
and short term)
Significance of the ratio:
1. It is a prime test of the efficiency of business. It measures not only the overall efficiency
of business but also helps in evaluating the performance of various departments.
2. The owners are interested in knowing the profitability of the business in relation to
amounts invested in it. A higher percentage of return on capital employed will satisfy the
owners that their money is profitably utilized.
RETURN OF TOTAL RESOURCES
This ratio acts as a yardstick to assess the efficiency of the efficiency of the operations of the
business as it indicates the extent to which assets employed in the business are utilized to results
in net profit
Net profit
Return on total recourses = X 100
Total assets
21
DIVIDEND YIELD RATIO
It refers to the percentage or ratio of dividend paid per share to the market price per share. This
ratio throws light on the effective rate of return on investment, which potential investors may
hope to earn
Dividend paid per equity share
Dividend yield ratio =
Market price per equity share
PREFERENCE DIVIDEND COVER
It indicates how many times the preference dividend is covered by profits after tax. This ratio
measures the margin of safety for preference shareholders. Such investors normally expect their
dividend to be covered about 3 times by profits available for dividend purpose.
Profit after tax
Preference dividend cover =
Annual programmer dividend
EQUITY DIVIDEND COVER
This ratio indicates the number of times the dividend is covered by the amount of profit available
for equity shareholders
Net profit after tax - pref. dividend
Equity dividend cover =
Dividend paid on equity capital
Earning per equity share
=
Dividend per equity share
IDEAL RATIO: 2 TIMES; i.e. for every Rs. 100 profits available for dividend, Rs. 50 is
retained in the business and Rs. 50 is distributed. Higher the ratio higher is extent of retained
earnings and higher is the degree of certainty that dividend will be repeated in future
PRICE EARNING RATIO
It shows how many times the annual earnings the present shareholders are willing to pay to get a
share. This ratio helps investors to know the effect of earnings per share on the market price of
the share. This ratio when calculated for several years can be used as term analysis for predicting
future price earnings ratios and therefore, future stock prices.
Average market price per share
Price earnings ratio=
Earnings per share
DIVIDEND PAY OUT RATIO
This ratio indicates the proportion of earnings available which equity share holders actually
Receive in the form of dividend.
Dividend paid per share
22
Payout ratio =
Earnings per share
An investor primarily interested should invest in equity share of a company with high payout
ratio. A company having low payout ratio need not necessarily be a bad company. A company
having income may like to finance expansion out of the income, thus low payout ratio. Investor
interested in stock price appreciation may well invest in such a company though the payout ratio
is low.
EARNING PER SHARE
This ratio indicates the earning per equity share. It establishes the relationship between net profit
available for equity shareholders and the number of equity shares.
Net profit available for equity share holders
Earnings per share =
Number of equity shares
23
CHAPTER-2
COMPANY PROFILE
BRIEF HISTORY
Mark Exhaust Systems Limited was incorporated in 1993. Through our technical collaborations,
innate manufacturing prowess and quality processes, we are today a leader in the auto
components manufacturing industry.
Our journey began as a joint venture with Maruti Udyog Limited to be a 1st tier supplier of
exhaust systems, door sash and other sheet metal assemblies. By virtue of this association with
the largest car manufacturer in India, we were given access to one of the leading and latest
reservoirs of technology.
Subsequently, to expand our technical prowess, we entered into collaboration with M/s Sankei of
Japan, a leading manufacturer of exhaust systems and catalytic converters for Maruti Suzuki.
This relationship was then further extended to include the manufacturing of door sash, which is a
critical sheet metal part requiring a high degree of accuracy and precision.
In order to further enhance our expertise in the metal forming, bending and surface finishing
technologies, we formed collaboration with M/s. Dongwon, Korea.
A licensing agreement with M/S Futaba of Japan provided us with expertise for the manufacture
of Maniverter or Euro 3 Catalytic Converter for emission systems for Maruti, one of our
principal customers.
With these strategically planned collaborations, we have realized our potential to become an end-
to-end auto components manufacturing solution provider.
Our knowledge, expertise and experience are now propelling our growth into other business
areas such as the infrastructure segment in India. Mark Exhaust will be developing and
delivering products such as impact rails, steel framing systems, purlin lines for the construction
of ports, railways, bridges and roads.
A Chronological Overview:
1993: Mark Exhaust came into existence
1994: Technical collaboration with M/s SANKEI GIKEN KOGYO CO. LTD. Japan
1996: Production commenced for Maruti Udyog Ltd. (for Zen & Esteem Models)
1996: Production commenced for exports.
1998: QS 9000 Certification from DNV, Netherlands
1999: Supply started to Honda Siel Cars (City Model)
1999: Supply started to Hindustan Motors (Lancer Model)
2000: Supply started to LML Ltd. (4 Stroke 2 Wheelers)
2001: Supply started to Maruti Udyog Ltd. (for Door Sashes for Alto Model) from the new
plant
2002: Supply started to Honda Scooter & Motor Cycle (4 Stroke 2 Wheelers)
24
2003: Received ISO 14001 Environmental certification
2004: Collaboration with M/s Dongwon, Korea
2005: License Agreement with Futaba, Japan for Maniverter or (Euro 3 Catalytic Converter)
2006: Supply started to Piaggio, Italy (Scooter)
2007: Foray into the infrastructure industry
2008: License agreement with Futaba Japan to manufacture Exhaust Systems
2009: Supply started to FMI
ABOUT MARK EXHAUST
Mark Exhaust is a leading manufacturer and global supplier of automobile components. As a
progressive company we are defined by our stable lineage, consistent financial growth, quality
reputation and customer orientation.
Mark Exhaust is today an end to end auto components solution provider. We work with an
impressive list of clients which includes both leading auto companies in India and Europe. By
capitalizing on our in-house strengths, we have successfully nurtured relationships with many
European OEM and aftermarket leaders. An initiative to provide warehousing and assembly
facilities in the UAE further cements our position as an exporter. This helps reduce logistical
constraints and allows for reduced lead time which enables our customers to have a more flexible
ordering schedule.
Our journey to success has been realized through our strategic technical collaborations, our
manufacturing prowess, customer orientation and quality delivery.
ABOUT MARK EXHAUST » FINANCIAL GROWTH
The Mark Exhaust Group has seen rapid and consistent growth. Today we have revenues of Rs.
500 crores, over 700 employees and state-of-the-art manufacturing plants to cater to a growing
local and global customer base. Our revenues have grown steadily and they have doubled in the
last three years. With a CAGR of 26%, we have maintained a growth rate that is double of the
industry average.
ABOUT MARK EXHAUST » AWARDS
25
Mark Exhaust's quality, cost efficiency and customer focus efforts have been recognized by the
awards we have received from our customers and partners.
ABOUT MARK EXHAUST » PEOPLE
A COMMITTED WORKFORCE
At the heart of Mark Exhaust's success stand our talented employees who are guided by an
unwavering commitment to our customers. Our relationship with employees is based on mutual
Maruti
Udyog Ltd.
For an
outstanding
overall
Performance
during 2002-
2003
Maruti
Suzuki
Vendor
Performance
Award 2005-
2006
Maruti Suzuki
Appreciates their
participation in
Maruti Suzuki Vendor
Conference
Honda
Motorcycle
& Scooter
India Ltd.
Supplier
Award for
Challenge
India
Support 2002-
2003
Honda Siel
Cars
India Ltd.
For achieving
the
Bronze Award
in
the category
of
Delivery
Honda Siel Cars
India Ltd.
Supplier Award
2001
Gold Award for
Cost
26
trust and respect. Our culture is one of teamwork, honesty, integrity, respect and transparent
communication that have played a pivotal role in the development of win-win relationships.
Our group’s employee strength stands at 155 engineers, 135 white collared associates and 1360
blue collared associates.
ABOUT MARK EXHAUST » QUALITY
While there are many reasons for Mark Exhaust's success, the most significant among them is
our strong focus and commitment to quality. Product quality is at the centre of our brand
promise. In order to achieve this, quality permeates all aspects of our business - right from our
investments in quality equipment and machinery, to training programs for our employees that
enhances their work quality to the high quality of our premises and facilities.
Our quality management systems have been acknowledged by DNV, NORWAY in the form of
TS 16949 & ISO-14001 certifications.
VISION & MISSION
Mark Exhaust's mission and vision serve as a constant guiding light to help us on our path of
growth.
MISSION STATEMENT:
At Mark Exhaust we strive to be one of the major automobile component manufacturers in India
and to become a preferred choice of all the major two wheeler and four wheeler customers in
India and overseas.
VISION STATEMENT:
Mark Exhaust is committed to achieving global standards of
quality, cost, delivery, environmental control, productivity,
efficiency and customer satisfaction.
To achieve its vision, the company will synergize its collective
resources and capabilities of product designing, creativity,
innovation and work practices involving its employees at all
levels.
POLICY
The articulation of the quality, safety and environment policy demonstrates our intention,
direction and aim in these critical areas.
QUALITY POLICY:
All employees will strive to achieve total customer satisfaction by the timely delivery of products
at competitive prices, while conforming to international standards achieved through continuous
improvement with an eye on safety, wastage and environment care.
SAFETY POLICY:
27
Our safety policy aims to create and promote a culture that focuses on the safety and health of
employees. We do this by:
• Ensuring compliance with all applicable legislative requirements
• Empowering employees to ensure safety in their respective work
places
• Promoting safety and health awareness amongst employees, suppliers and contractors
• Continuous improvement in safety performance through awareness, participation and training
of employees.
ENVIRONMENT POLICY:
Our environmental aims and objectives are to:
• Set environmental objectives and targets
• continually improve and maintain high levels of operational and technical performance
• Reduce and/or prevent pollution, minimize wastage of resources
• Comply with legal and regulatory requirements
CODE OF CONDUCT:
The code of conduct serves as a guide for our daily business interactions, reflecting our standards
for proper behavior and our corporate values.
IN OUR RELATIONSHIPS WITH EACH
OTHER, WE STRIVE TO:
Have successful working relationships
Promote open and honest communications
Value people as our greatest resource
IN OUR DEALINGS WITH OUTSIDE
BUSINESS ENTITIES, WE STRIVE TO:
Deal ethically with suppliers and customers
Not give or accept inappropriate gifts
Respect the trade secrets and confidential information of others
IN OUR DEALINGS WITH OUR CUSTOMERS, WE STRIVE TO:
Set highest standards for our products
Be responsive to our customers
IN OUR DEALING WITH THE GOVERNMENT AND THE LAW, WE
STRIVE TO:
Comply with regulatory compliance, monitoring and reporting
Political non-alignment
Deal ethically with government and its representatives
Preserve records according to the law
IN OUR DEALINGS WITH SOCIETY, WE STRIVE TO:
Oppose exploitative, inhumane labor practices
28
Safeguard and protect the environment
IN OUR RELATIONSHIP WITH SHAREHOLDERS, WE STRIVE TO:
Practice good corporate governance to protect shareholder value
Maintain strong audit programs to increase interest and confidence
Keep shareholders informed about the company and other developments
MD'S MESSAGE
From Mr. Rattan Kapur's Desk:
It is my pleasure to welcome you to Mark Exhaust's Web site.
The Indian automobile industry has metamorphosed into a great industry since the first car ran
on the streets of Bombay in 1898. It is today the tenth largest in the world. While the industry is
faced with a recession today, the Asia market and in particular the India story has been
somewhat different.
India is one of Asia's largest car markets and is the second largest manufacturer of two wheelers.
The number of cars sold domestically is projected to treble by 2015. Global auto majors are
increasingly seeing India as a manufacturing hub for auto components and are increasing the
volume of components they source from India due to its cost competitiveness in terms of labor
and raw material.
According to the Automotive Component Manufacturers' Association of India (ACMA), the
domestic Indian auto component manufacturing industry is heading for a whopping 18% growth
in the coming years. The turnover of the auto component industry was estimated at over US$ 18
billion in 2007-08 and it is likely to touch US$ 40 billion by 2015-16.
Owing to India's rapid economic growth, improved infrastructure and higher disposable incomes
the success story of the Indian automobile industry is just beginning!
It is in this context that Mark Exhaust's success is played out. We are a leading manufacturer of
exhaust systems, catalytic converters and door sash assemblies in the country. At the heart of our
success lies our commitment to quality that makes our customers successful. Our commitment to
quality means paying absolute attention to our customers by making sure that we deliver on their
expectations. Quality is essential to the integrity of our brand and to maintaining our customers'
trust.
Key to our success is also our partnerships with leading companies in auto manufacturing. Our
partnership with M/S Futaba of Japan, M/s Sankei Industry Co. M/S Klarius of UK and IAV of
Germany has helped strengthen our technical capabilities and ensure that we remain at the
cutting edge of technology.
While our key focus is the manufacturing of auto components, Mark Exhaust recognizes its
responsibility of being a citizen of the world. With the growth expected in the automotive
industry, concerns about an increase in the number of vehicles and their emissions and its
resultant effects on global warming are high. We respond by caring for our environment through
29
conscious policies and management systems that attempt to minimize smoke emissions, promote
harvesting, water collection and hard water treatment; while our exhaust systems are designed to
be efficient in their use of energy and contain environmentally preferable solutions.
Our knowledge, experience and success of over two decades in the auto components
manufacturing industry are today propelling our growth in the infrastructure industry. Supported
by our manufacturing prowess and customer orientation, we will be developing and delivering
products such as impact rails, steel framing systems and purlin lines for the construction of ports,
railways, bridges and roads.
The driving force responsible for our growth and industry recognition is our committed
workforce and responsible management. Our leadership status and respect in the industry is a
testament to their determination and hard work. We recognize the invaluable contribution of this
dedicated team and are focused on offering our employees exceptional opportunities for
professional and personal development.
I am confident that with our highly skilled work force and our focus on critical areas of
competitiveness, constant improvement, quality and prompt delivery will continue to fuel our
success to even greater heights.
Thank you for partnering with us and for being a part of Mark Exhaust.
Rattan Kapur
Chairman & Managing Director,
Mark Exhaust Systems Ltd.
BOARD OF DIRECTORS
Mark Exhaust is currently managed by a Board of Directors which oversees the activities of the
company. The Board comprises of the following persons:
BOARD OF DIRECTORS
Mr. Rattan Kapur -Chairman & Managing Director
Mr. Rohan Kapur -Executive Director
Mr. Hiroshi Sakamoto -Director Maruti Representative
Mr. S. Natarajan -Director Independent Professional
Mr. K. T. S. Tulsi -Director Independent Professional
Mr. M. M. Singh -Director Maruti Representative
Mr. Sandeep Chandhok -Director
CAREER OPPORTUNITIES
30
You can build a career with a company that's setting the pace
for more than 16 years; Mark Exhaust has been setting and raising the bar in the auto
components manufacturing industry. As we grow both in India and globally and diversify into
new business areas, we have a steady need for ambitious and focused individuals who are
looking for a professional work environment that will foster their
growth and help them to perform to their potential.
You'll discover real growth opportunities
we believe that our employees are our core asset and we are committed
to their growth and development. We encourage our employees to
develop new skills through specialized training programs that help
them to be aware and updated on the best practices around the globe.
Mark Exhaust offers its employees in-house training programs and
encourages cross functional teams at different levels to enhance employee knowledge and
competencies through customized programs.
Our relationship with employees is based on mutual trust and respect. Our culture is one of
teamwork, honesty, integrity, respect and transparent communication that have played a pivotal
role in the development of win-win relationships.
CAREERS » APPLY NOW
Apply today:
Mark Exhaust provides a challenging and empowered workplace for professionals in the field of
production engineering, design engineering and manufacturing.
Please submit your resume online by writing to us at info@markexhaust.com
CAREERS » CORPORATE RESOURCES
The Corporate Resource section is designed to give you access to relevant information quickly
and easily.
http://www.markexhaust.com/app/webroot/cr/markexhaust.pdf
http://www.markexhaust.com/app/webroot/cr/MESLBroucher.pdf
BUSINESS AREAS
Mark Exhaust Systems is a leading manufacturer and global supplier of automobile components.
As a progressive leader, we are defined by our stable lineage, consistent financial growth, quality
reputation and customer orientation. Mark Exhaust is today a complete auto components
manufacturing solution provider. We work with an impressive list of clients which includes both
leading auto companies in India and Europe. By capitalizing on its in-house strengths, Mark
Exhaust has successfully nurtured relationships with many European OEM and aftermarket
leaders. An initiative to provide warehousing and assembly facilities in the UAE further cements
its position as an exporter.
Our journey has been realized through our strategic technical collaborations, our manufacturing
31
prowess, customer orientation and quality delivery.
AUTOMOBILES
The Indian automobile industry is the 10th largest in the world. The industry is poised for growth
with the projection of the number of cars sold in India expected to double by 2010.
The Indian auto component manufacturing industry is also headed for a whopping 18% growth
in the coming years. Global auto majors are increasingly seeing India as a manufacturing hub for
auto components and are rapidly increasing the amounts of components they source from India
due to their cost competitiveness in terms of labor and raw material.
Mark Exhaust is a leading auto components solution provider with an impressive list of clients
which includes both leading auto companies in India and Europe.
OUR PRODUCTS INCLUDE:
• 2 Wheeler Exhaust • Fitting Kits & Flanges
• 4 Wheeler Exhaust • Replacement Cats
for European Market
• Door Sash • Stationery Engine
Exhausts
• Stampings • Brake Pads
• Welded Assemblies • Machined Components
• 2 Wheeler Frame Parts • Sliding Door Assembly
• Exhaust Manifold • Tubular Assembly
INFRASTRUCTURE
India is building its future. Infrastructure construction that covers ports, railways, bridges and
roads is expected to be robust in the coming years.
Mark Exhaust has leveraged its expertise in rolling complex sections in the Auto Industry
coupled with our discipline of customer delivery and satisfaction, quality and a culture of
development to provide products to the growing infrastructure industry.
Our products include:
• Impact beams:
32
COMMITMENT TO BUSINESSES
Since our inception our business focus has been to deliver competitive technology solutions for
our clients in the auto industry. Over the years we have built a formidable reputation as the
supplier of choice for leading brands, both, in India and globally. A deep emphasis on quality
management and creating a skilled workforce, which today has grown to over 700 people has
helped us in building strong and long lasting customer relationships.
Today we are a company that holds tremendous promise for
future growth. The company has grown in the field of design,
engineering and production technology with an ingrained
culture of continuous improvement. Our R&D and testing
facilities are world class.
COMMITMENT TO BUSINESSES » QUALITY
Mark Exhaust is deeply committed to meeting the highest industry quality standards – both for
processes and products- while improving cost efficiency, delivering measurable value and
manufacturing high quality products that are environment friendly. In order to continuously
improve quality performance Mark Exhaust has developed standard quality management systems
which have been acknowledged by DNV, NETHERLANDS in the form of TS 16949 & ISO-
14001 certifications.
Some of the quality practices like 5-S, Kaizen, Quality Circles and Cross Functional Teams are a
way of life at Mark Exhaust. For us, 'quality is built-in within our processes', and is ultimately
the genesis of our successful track record with customers. To continuously improve upon the
quality of our processes, we have championed the training of Systems Professionals.
In order to improve product quality standards and practices, we focus on and consistently train
our associates in Poke Yoke, 5S, Why Why Analysis and Fishbone Analysis.
COMMITMENT TO BUSINESSES »
MANUFACTURING
33
Mark Exhaust has highly advanced and appropriately designed manufacturing facilities. As a
sheet metal components manufacturing company, we specialize in welded assemblies. Our
confidence to deliver to an international customer base and satisfy their product requirement
rests on our investments in equipment like power presses up to 300t (hydraulic and mechanical),
welding solutions (manual, SPMs, robots), tube benders, CnC machining centres, rolling mills
and stretch benders. Our in house paint shops and ED solutions help us in delivering a complete
product.
Our maintenance levels for all these sophisticated equipment’s are equally high. Our in house
maintenance teams provide 24/7 resolution to any mechanical or electrical problem that may
arise during the manufacturing process.
We are focused on using world class electrical equipment’s for our servers and drives and share
harmonious relationships with world leaders like Miachi, Tayo, Siemens, Philips etc.
we follow the single piece flow and cellular manufacturing system thus ensuring the highest
levels of efficiency in the production process. Our manufacturing facilities are equipped to
customize solutions for our customers ensuring that unique requirements are met.
OUR CURRENT MANUFACTURING EXPERTISE INCLUDES:
1. EXHAUST MANUFACTURING
• Swiss Roll or multi spot welding
technology
• A Lock Seam manufacturing line
TOP
34
• Automatic material feeding system based
on advanced Japanese technology for
making mufflers complete with baffle
stuffing and end seaming.
• Catering to the different segments within
the automotive and infrastructure
industries with a production capacity of
over 1 million exhaust shells per annum.
2. DOOR SASH MANUFACTURING
• High degree of accuracy in various fields
of metal forming.
• Modern line equipment’s from Japan and
Korea with capabilities of roll forming,
bending, robotized welding and power
presses in the door sash manufacturing
process
TOP
• Exposure for the development of other
rolled formed components such as chassis,
guard rails and bumper reinforcement
among others
3. PAINT SHOP
35
• Equipped with a Modern Converorized
Paint shop for painting mufflers with heat
resistant paint
• In this process, shot blasting is followed
by wet electrostatic liquid painting
• Heat resistant paints up to temperatures of
550 degrees C is possible
TOP
4. PIPE BENDING
• Line up of sophisticated 3 axis CNC pipe
bending machines from M/s Addisson of
UK, YLM and Taiwan for design oriented
quality
5. WELDING
• Fully robotized welding SPM (special
purpose machines) provide a decisive edge
in achieving high finish standards and
enhanced product capability
36
6. PRESS SHOP
• We specialize in both MS and SS
stampings with press capacities ranging
from 10 t to 300 t, with an in-house press
shop backed by experienced associates
specializing in dye and tool maintenance
COMMITMENT TO BUSINESSES » RESEARCH & DEVELOPMENT
Research and development (R&D) forms the backbone of Mark Exhaust's delivery and lends to
our competitiveness in the industry on a global level. Our capabilities include:
• Developing original designs and analyses
• Material research & development
• Testing & validation
by utilizing CAE systems and other virtual lab tools, we provide simulation such as NVH, CFD,
FEA, Load, and Stress analysis. These simulations can be used to:
• Predict fatigue hotspots and corresponding fatigue life which helps in optimizing component
design for fatigue performance.
• Predict fatigue life based upon realistic loading conditions.
• Get immediate feedback on critical durability areas.
• Explore multiple design options and optimize the design to performance requirements.
Once the simulation stage is satisfactorily completed, we proceed to the prototyping stage where
the prototypes are then put on test benches where they are checked for performance and fitment.
By utilizing proto toolings and accessing validation centers from all over the world, we keep our
development costs low. We share good working relationships with world renowned accreditation
centers like ARAI, IDIADA, NATRIP, VCA etc.
COMMITMENT TO BUSINESSES » TESTING LAB
Mark Exhaust's testing lab is outfitted with the latest equipment to ensure quality testing
procedures. This equipment is used to gauge, test and analyze the products, processes and
materials used to ensure that our products meet the stringent quality standards that our customers
demand of us.
We continually invest in testing equipment that enhances our procedures for faster time-to-
market. For our customers who operate in a highly competitive industry, faster time to market
equals a competitive advantage in the market place. Some of these capabilities include:
1. the ultra-modern 3D Coordinate Measuring Machines (CMM) - a device
for measuring the geometrical characteristics of an object. These part
features cannot be measured with conventional hand tools. With this
technology we have experienced leaps in our productivity.
37
2. A tube data scanning machine from M/s Addisons, UK is used for checking the profiles of
tubes and pipes under development.
3. UTMs & hardness testers are used for measuring the hardness of metals.
4. A Millipore test is used to check products with sensitivity to a high level of contamination.
COMMITMENT TO BUSINESSES » DESIGN ENGINEERING
The company has invested in the latest in CAD technology that not only helps in designing
products but also re-engineering them to meet specific client requirements. We effectively
use design technology during the entire life cycle of a product, from the birth stage right up to
assembly and manufacturing.
By using the latest in CAD CAM software, we deliver 2D and 3D designing of welding /
assembly jigs and fixtures. In order to have greater control on the manufacturing process, most of
our special purpose machines (SPM) fixturing also has design input from our in-house design
section.
Once we receive the product tolerance report from our customer, we do reverse engineering to
set sub component tolerances. This helps us control the dimensional variances which might take
place within the manufacturing process. By designing the inputs to the manufacturing process in
house, it helps us strengthen our commitment to the quality of the product and thereby the
customer.
COMMITMENT TO OUR PEOPLE
The two pillars of Mark Exhaust's success are the technology we use and the people we work
with.
Mark Exhaust's market leadership is a testimony to the commitment and hard work of its
employees. We are dedicated to nurturing and investing in our people. Apart from providing
them with the best technology to work with and world-class facilities, we are focused on creating
a favorable environment for their professional growth helping them acquire practical skills that
add real value.
COMMITMENT TO OUR PEOPLE » TRAINING
Our people are our most important asset and we invest considerable resources to provide on-
going training that builds and extends professional, technical and management skills in all areas.
The training programs help our employees in being up to date with global best practices that are
followed in the auto manufacturing industry. Our in-house training programs like 5-S, Quality
circles and cross functional teams at different levels are aimed at enhancing their knowledge
levels and competencies.
The Personal Department creates a training calendar after identifying needs. These trainings are
directed towards productivity improvement, quality improvement, maintenance improvement
and general team building exercises.
38
COMMITMENT TO OUR PEOPLE » FACILITIES
Mark Exhaust's facilities for employees are world-class.
We are committed to providing a safe and healthy working environment for our
employees.
To ensure that employees are able to work efficiently, amenities such as a canteen
and recreation rooms are available. On premise health care facilities offer first aid in
case of an emergency.
Commitment to Our people » People Practices
Mark Exhaust makes a meaningful contribution in the personal lives of its employees. We
sponsor the education of the children of our associates from the primary to college level.
Further, our associates' children receive an annual subscription of a children's newspaper
called Robin Age.
Commitment to the Environment
Mark Exhaust is an environmentally responsible company. While our main undertaking is
to manufacture automobile products, we recognize our responsibility towards the industry
and society at large. From our early days we have embraced the idea of the company being
a key participant in contributing positively towards the environment. This care is
39
manifested in our endeavor to consciously plan policies and management systems which
are aimed at minimizing the impact of our operations on
the environment.
AT MARK EXHAUST, OUR
ENVIRONMENTAL AIMS AND
OBJECTIVES ARE TO:
- Define our environmental policy
- Continually improve and maintain high levels of
operational and technical performance
- Reduce and/or prevent pollution, minimize wastage
of resources
- Comply with legal and regulatory requirements
Mark Exhaust is the proud recipient of the ISO 14001 environmental management
certification. This certification has been awarded to us owing to our commitment to
continuous improvement and monitoring of all environmental impact areas including
energy and water consumption, sewage discharge, airborne emissions, hazardous materials
and noise levels which help to reduce the impact of our operations and provide a safer and
healthier place to work.
At Mark Exhaust we design our products to be efficient in their use of energy, to contain
environmentally preferable solutions and be capable of being reused, recycled or disposed
of safely at the end of their useful lives.
We follow efficient processes and methodologies for manufacturing production and
inventory control like Just in Time (JIT), KanBan Systems and Direct Online (DOL) which
are designed to reduce our carbon footprint.
As a commitment to the neighborhood in which we operate, Mark Exhaust has planted
trees and created tube wells for the people who inhabit villages in that area. The
articulation of the quality, safety and environment policy demonstrates our intention,
direction and aim in these critical areas.
QUALITY POLICY
All employees will strive to achieve total customer satisfaction by the timely delivery of
products at competitive prices, while conforming to international standards achieved
through continuous improvement with an eye on safety, wastage and environment care.
SAFETY POLICY
Our safety policy aims to create and promote a culture that focuses on the safety and health
of employees. We do this by:
• Ensuring compliance with all applicable legislative requirements
• Empowering employees to ensure safety in their respective work
places
40
• Promoting safety and health awareness amongst employees, suppliers and contractors
• Continuous improvement in safety performance through awareness, participation and
training of employees
ENVIRONMENT POLICY
Our environmental aims and objectives are to:
• Set environmental objectives and targets
• Continually improve and maintain high levels of operational and technical performance
• Reduce and/or prevent pollution, minimize wastage of resources
• Comply with legal and regulatory requirements
INFRASTRUCTURE PRODUCTS
Impact beams C Purlin Impact beams Z Purlin
Decking Standing Seam One Sheeting
Profile
INFRASTRUCTURE PRODUCTS > ROADWAYS
Impact beams Impact beams
INFRASTRUCTURE PRODUCTS > BUILDINGS
C Purlin Z Purlin Decking Standing Seam
One Sheeting
Profile
41
AUTOMOTIVE PRODUCTS > OEM - 2 WHEELER
2W Exhaust 2W Frame Parts Machined
Components
2W Exhaust
2W Frame Parts Machined
Components
2W Exhaust Machined
Components
2W Exhaust 2W Frame Parts Machined
Components
2W Exhaust
2W Frame Parts 2W Exhaust 2W Frame Parts 2W Exhaust
2W Frame Parts
AUTOMOTIVE PRODUCTS > OEM - 2 WHEELER > 2 WHEELER
EXHAUST
2W Exhaust 2W Exhaust 2W Exhaust 2W Exhaust
2W Exhaust 2W Exhaust 2W Exhaust
42
AUTOMOTIVE PRODUCTS > OEM - 2 WHEELER > 2 WHEELER
FRAME PARTS
2W Frame Parts 2W Frame Parts 2W Frame Parts 2W Frame Parts
2W Frame Parts 2W Frame Parts
AUTOMOTIVE PRODUCTS > OEM - 2 WHEELER > MACHINED
COMPONENTS
Machined
Components
Machined
Components
Machined
Components
Machined
Components
AUTOMOTIVE PRODUCTS > OEM - 4 WHEELER
AUTOMOTIVE PRODUCTS > OEM - 4 WHEELER > 4 WHEELER
EXHAUST
4 Wheeler 4 Wheeler 4 Wheeler 4 Wheeler
AUTOMOTIVE PRODUCTS > OEM - 4 WHEELER > DOOR SASH
Door Sash Door Sash Door Sash Door Sash
43
Door Sash Door Sash Door Sash
AUTOMOTIVE PRODUCTS > OEM - 4 WHEELER > STAMPINGS
Stampings Stampings Stampings Stampings
Stampings Stampings Stampings
AUTOMOTIVE PRODUCTS > OEM - 4 WHEELER > WELDED
ASSEMBLIES
Welded Assy Welded Assy Welded Assy Welded Assy
AUTOMOTIVE PRODUCTS > OEM - 4 WHEELER > EXHAUST
MANIFOLD
Manifold Manifold Catalytic Convertor Catalytic Convertor
Catalytic Convertor
Automotive Products > OEM - 4 Wheeler > Stationery Engine Exhausts
Stationary Engine Exhaust
44
AUTOMOTIVE PRODUCTS > OEM - 4 WHEELER > SLIDING DOOR
ASSEMBLY
Sliding Door Assy Sliding Door Assy Sliding Door Assy Sliding Door Assy
AUTOMOTIVE PRODUCTS > OEM - 4 WHEELER > TUBULAR
ASSEMBLY
Tubular Assy Tubular Assy Tubular Assy Tubular Assy
Tubular Assy Tubular Assy
AUTOMOTIVE PRODUCTS > AFTERMARKET
AUTOMOTIVE PRODUCTS > AFTERMARKET > FITTING KITS
& FLANGES
Flanges Flanges Flanges Flanges
Flanges Flanges Fitting Kits Fitting Kits
Fitting Kits Fitting Kits Fitting Kits Fitting Kits
45
Fitting Kits (Clamps)
AUTOMOTIVE PRODUCTS > AFTERMARKET > REPLACEMENT
CATS
Large Oval Cat Small Oval Cat Round Cat
AUTOMOTIVE PRODUCTS > AFTERMARKET > BRAKE PADS
Brake Pads Brake Pads Brake Pads Brake Pads
Brake Pads more detail about
Brake Pads
PARTNERSHIPS
As a leader in the auto components industry, Mark Exhaust is committed to delivering best-in-
class products to its clients across the globe.
Our consistent track record of delivering world class
technology is evidence of our close working
relationships with our partners. Mark Exhaust joins
hands with the best known companies in the industry to
leverage their technology expertise and global exposure.
Our partners equip us with enhanced capabilities for
servicing a global market.
Mark Exhaust is proud of its partnerships. We share a common vision with our partners of
excellence and sustainable growth that ensures our joint progress.
Growth of our Partner Network:
46
1995: Mark Exhaust entered into a technical collaboration with M/s Sankei of Japan, a leading
manufacturer of exhaust systems for producing Exhaust Systems and Catalytic Convertors for
Maruti Suzuki. In the year 2001 Mark Exhaust furthered the relationship with M/s Sankei to
commence manufacturing of the door sash - a critical sheet metal part requiring high degree of
accuracy and precision.
2004: Mark Exhaust forged a partnership with M/s Dongwon, Korea. This partnership provided
us with valuable exposure and experience in metal forming, bending and surface finishing
technologies.
2005: Mark Exhaust entered into a License agreement with M/S Futaba of Japan for the
manufacture of Maniverter or Euro 3 Catalytic Converter for our principal customer Maruti
Udyog Limited; giving us the opportunity to become a full exhaust system solution provider.
M/s Futuba
M/s Futaba Industrial Co Ltd: Established in November 1945. The business focus for Futaba is
manufacturing and sales of automobile and vehicle assembly parts, office equipment parts, jigs
and welding machines. The company has since grown to nearly 8500 people. The company
operates 7 factories spread across Japan. Futaba’s manufacturing network includes plants in Saga
Prefecture, Iwate Prefecture and Aichi Prefecture (Anjo) in Japan, as well as in North America,
China and South East Asia, creating a strong global presence.
MESL's relationship has been strengthened with Futaba by working closely on the setup and
smooth establishment of FMI Automotive Components Ltd.
M/s Klarius
Klarius Group is one of Europe's largest independently owned automotive manufacturing
concerns. The Klarius Group has over 1,000 employees across Europe, with 3 production
facilities, in the UK and Italy, distribution platforms: in the UK, France, Italy and Spain; and a
research and development facility located in the UK. The technical centre has its own approved
test track (the only parts manufacturer to have one) for undertaking type approval of parts. As
well as supplying major companies in the aftermarket sector, Klarius also supplies OE
manufacturers with exhausts for top marques, including all of the largest and most well
recognized Italian super cars and bikes.
MESL shares a cordial relationship with the renowned Klarius Group for the designing and
testing of complete exhaust systems for the two wheeler and four wheeler industries.
IAV GMBH
47
Employing over 3,000 staff across the globe, IAV is one of the leading providers of engineering
services to the automotive industry. IAV's core competencies include powertrain, electronics and
vehicle development. As a result, they can provide clients with production-ready solutions for
the entire vehicle on a one-stop shop basis. IAV engages in its own primary research, performs
its own advanced development activities and works on an interdisciplinary basis.
Mark Exhaust Systems Limited tied up with IAV for the design and validation of four wheeler
exhaust systems
CUSTOMERS
Mark Exhaust is proud of its client relationships.
Maruti HMSIL HSCIL
International
Tractors
Piaggio
FMI
Automotive
Components
International Cars &
Motors
CONTACT US
Mark Exhaust Systems Limited
39/7, Begampur Khatola
NH - 8 Delhi Jaipur Highway
Gurgaon 122001
Tel : +91 124 4660400
Fax : +91 124 4031012
Email : info@markexhaust.com
Contact Person : Mr. Brij Malhotra
MANUFACTURING LOCATIONS
48
Mark Exhaust Systems Limited
Village Begumpur Khatola,
Delhi-Jaipur Highway,
Gurgaon-122001
Mark Exhaust Systems Limited -
Unit II
Village Binola,
Delhi-Jaipur Highway,
Gurgaon-122413
Mark Exhaust Systems Limited -
Unit III
Plot # 101,
Sector 08
IMT Manesar,
Gurgaon-122050
49
CHAPTER-3
OBJECTIVE:
The main objective of this report is to know about and analyze the financial strategies of the
company, analyzing the current market and make possible recommendation about the company.
 TO FINDING SHORT –
TERM FINANCIAL VIABILITY OF COMPANY
 TO FINDING LONG –
TERM FINANCIAL VIABILITY OF COMPANY
Note : These all objective set on base of
(a) LIQUIDITY RATIO
(b) SOLVENCY RATIO
50
CHAPTER-4
RESEARCH METHODOLOGY
MEANING OF RESEARCH -
Research in common meaning refers to a search for knowledge. If we define research properly
then it would be like “It is a scientific and systematic search for pertinent information on a
specific topic”. Still some people consider research as a Movement, the movement from known
to unknown. All of us posses some amount of inquisitiveness in our self, and it is this
inquisitiveness that make all of us to get known with the things which are unknown to us.
Research is an academic activity, which help us to get familiar with the basic things of the
findings and spread the knowledge so that all can be benefited from it. In short, the search for
knowledge through objectives and systematic method of finding solution to a problem is
research. The systematic approach concerning generalization and the formulation of a theory is
also Research.
The basic types of research work under which, we can be say our lie is:
DESCRIPTIVE RESEARCH –
This research includes surveys and fact findings enquiries of different kind. The basic purpose of
this type of research is that it describes the state of affairs in current scenario. It is being
generally used in social sciences and business research.
The main characteristics of this method are that researcher has no control over the variables; he
can only report what happened or what is happening. The method used in this type of research is
survey methods including comparative and co relational methods.
The need of data collection comes out after a research problem is being defined. While collecting
data for the research or for the study, the researcher should keep in mind.
DATA SOURCES -
a) PRIMARY DATA
b) SECONDARY DATA
The Primary Data are those which are collected afresh and for the first time, and thus happen to
be original in character.
The Secondary Data, on the other hand, are those which have already been collected by
someone else and which have already been passed through the statistical process. The researcher
have to decide which sort of data he would be using for his/her study and accordingly he will
have to select one or other method of data collection.
51
CHAPTER-5
DATA ANALYSIS & INTERPETATION
By these sources I able to collect the data which is as follow:-
FORMAL INFORMATION SOURCES–
These are the sources of information which are authentic and reliable, obtained through a proper
channel in the organization by adhering to a systematic and structured procedure.
For Example:
Through company manuals, journals, brochures and any other published material like balance
sheets, annual reports, articles etc.
.
52
TEST OF LIQUIDITY
CURRENT RATIO OF MARK EXHUAST SYSTEM LIMITED
YEAR’S CALCULATION
2016-2015 1.94
2015-2014 1.60
2014-2013 1.31
2013-2012 1.03
Notes: In The Current Ratio Result Was 1.94,1.60,1.31,1.03 Respective Years
2016,2015,2014,2013..Is Increasing Order And Ideal Ratio 2:1.
It Means Current Ratio Is Favorable Condition Of The Mark Exhaust System
Limited.
0
0.5
1
1.5
2
2.5
2016-15 2015-14 2014-13 2013-12
CURRENT RATIO
CURRENT RATIO
53
QUICK RATIO OF MARK EXHUAST SYSTEM LIMITED
YEAR’S CALCULATION
2016-2015 1.28
2015-2014 1.01
2014-2013 0.85
2013-2012 0.69
Notes: In The Quick Ratio Result Was 1.28,1.01,0.85,0.69 Respective Years
2016,2015,2014,2013.Its Also In Increaseing Order.The Ideal Ratio Of Quick
Ratio Is 1:1.It Means Company Perform Favorable Condition In This Result.
0
0.2
0.4
0.6
0.8
1
1.2
1.4
2016-15 2015-14 2014-13 2013-12
QUICK RATIO
QUICK RATIO
54
TEST OF SOLVENCY
DEBT-EQUITY RATIO OF MARK EXHUAST SYSTEM LIMITED
YEAR’S CALCULATION
2016-2015 2.12
2015-2014 2.01
2014-2013 1.53
2013-2012 0.84
Notes: In The Debt – Equity Ratio Result Was 2.12,2.01,1.53,0.84 Respective
2016,2015,2014,2013Years.Its Is Order Increasing. The Ideal Ratio Is 2:1 So The
Company Performance Well.
0
0.5
1
1.5
2
2.5
2016-15 2015-14 2014-13 2013-12
DEBT-EQUITY RATIO
DEBT-EQUITY RATIO
55
PROPRIETARY RATIO OR NET WORTH OF MARK EXHUAST
SYSTEM LIMITED
YEAR’S CALCULATION
2016-2015 0.31
2015-2014 0.32
2014-2013 0.37
2013-2012 0.50
Notes: In The Proprietary Ratio Or Wet Worth Result Was 0.31,0.32,0.37,0.5
Respective Year 2016,2015,2014,2014 And The Ideal Ratio Is 0.5:1.The Company
Performance Better Condition.
0
0.1
0.2
0.3
0.4
0.5
0.6
2016-15 2015-14 2014-13 2013-12
NET WORTH RATIO
NET WORTH RATIO
56
SOLVENCY RATIO OF MARK EXHUAST SYSTEM LIMITED
YEAR’S CALCULATION
2016-2015 1
2015-2014 1
2014-2013 1
2013-2012 1
Notes: in the solvency ratio of the company result was 1,1,1,1 respective years
2016,2015,2014,2013 and the ideal ratio is high it means company performance
well.
0
0.2
0.4
0.6
0.8
1
1.2
2016-15 2015-14 2014-13 2013-12
SOLVENCY RATIO
SOLVENCY RATIO
57
FIXED ASSET TO NET WORTH OF MARK EXHUAST SYSTEM
LIMITED
YEAR’S CALCULATION
2016-2015 1.62
2015-2014 1.88
2014-2013 1.86
2013-2012 1.91
Notes: Iin The Ratio Fixed Asset To Net Worth Of Company Result Was
1.62,1.88,1.86,1.91 With Respective Years 2016,2015,2014,2013.The Ideal Ratio
Is 0.75:1.The Performance Of The Company Is Unfavorable Condition.
1.45
1.5
1.55
1.6
1.65
1.7
1.75
1.8
1.85
1.9
1.95
2016-15 2015-14 2014-13 2013-12
FIXED ASSET TO NET WORTH
58
CURRENT ASSET TO NET WORTH OF MARK EXHUAST
SYSTEM LIMITED
YEAR’S CALCULATION
2016-2015 3.11
2015-2014 2.91
2014-2013 2.48
2013-2012 2.53
Notes: In The Current Asset To Net Worth Of Company Ratio Was Result Is
3.11,2.91,2.48,2.53 With Respective Years 2016,2015,2014,2013.The Company In
Stable Condition.
0
0.5
1
1.5
2
2.5
3
3.5
2016-15 2015-14 2014-13 2013-12
CURRENT ASSET TO NET WORTH
CURRENT ASSET TO NET
WORTH
59
CURRENT LIABILITIESTO NET WORTH OF MARK
EXHUAST SYSTEM LIMITED
YEAR’S CALCULATION
2016-2015 1.60
2015-2014 1.81
2014-2013 1.89
2013-2012 2.45
Notes: In The Company Ratio Current Liabilities To Net Worth Result Was
1.60,1.81,1.89,2.45 Respective Years 2016,2015,2014,2013.The Ideal Ratio Is
1:3.So The Company Performance Not Well Infact Unfavorable Condition.
0
0.5
1
1.5
2
2.5
3
2016-15 2015-14 2014-13 2013-12
CUUENT LIAB. TO NET WORTH
60
FIXED ASSET RATIO OF MARK EXHUAST SYSTEM LIMITED
YEAR’S CALCULATION
2016-2015 1.70
2015-2014 1.97
2014-2013 2.06
2013-2012 1.91
Notes: In The Company Fixed Asset Ratio Result Was 1.70,1.97,2.06,1.91 With
Respective Years 2016,2015,2014,2013.And The Ideal Ratio Is 0.67:1 So
Company Performance Unfavorable Condition.
0
0.5
1
1.5
2
2.5
2016-15 2015-14 2014-13 Category 4
FIXED ASSET RATIO
FIXED ASSET RATIO
61
CHAPTER -6
FINDINGS OF STUDY
SERIAL
NUMBE
R
RATIO
NAME
2016
-15
2015
-14
2014
-13
2013
-12
IDEAL
RATIO RESULT
1 CURRENT
RATIO
1.94 1.60 1.31 1.03 2:1 FAVORABLE
CONDITION
2 QUICK
RATIO
1.28 1.01 0.85 0.69 1:1 BETTER
CONDITION
3 DEBT-EQUITY
RATIO
2.12 2.01 1.53 0.84 2:1 FAVORABLE
CONDITION
4 PROPRIETAR
Y RATIO
0.31 0.32 0.37 0.50 0.5:1 BETTER
CONDITION
5 SOLVENCY
RATIO
1 1 1 1 HIGH FAVORABLE
CONDITION
6 FIXED ASSET
TO NET
WORTH
1.62 1.88 1.86 1.91 0.75:1
UNFAVORABLE
CONDITION
7 CURRENT
ASSET TO NET
WORTH
3.11 2.91 2.48 2.53 N/A
STABLE
8 CURRENT
LIAB. TO NET
WORTH
1.60 1.81 1.89 2.45 1:3
UNFAVORABLE
CONDITION
9 FIXED ASSET
RATIO
1.70 1.97 2.06 1.91 0.67:1 UNFAVORABLE
CONDITION
62
 In The Current Ratio Result Was 1.94, 1.60, 1.31, 1.03 Respective Years
2016,2015,2014,2013...Is Increasing Order and Ideal Ratio 2:1.
 It Means Current Ratio Is Favourable Condition Of The Mark Exhaust
System Limited.
 In The Quick Ratio Result Was 1.28, 1.01, 0.85, 0.69 Respective Years
2016, 2015, 2014, 2013.It’s Also in Increasing Order. The Ideal Ratio Of
Quick Ratio Is 1:1.It Means Company Perform Favourable Condition In
This Result.
 In The Debt – Equity Ratio Result Was 2.12, 2.01, 1.53, 0.84 Respective
2016, 2015, 2014, 2013Years.It Is Order Increasing. The Ideal Ratio Is
2:1 So the Company Performance Well.
 In The Proprietary Ratio Or Wet Worth Result Was 0.31, 0.32, 0.37, 0.5
Respective Year 2016,2015,2014,2014 And The Ideal Ratio Is 0.5:1.The
Company Performance Better Condition.
 In the solvency ratio of the company result was 1,1,1,1 respective years
2016,2015,2014,2013 and the ideal ratio is high it means company
performance well.
 In The Ratio Fixed Asset To Net Worth Of Company Result Was 1.62,
1.88, 1.86, 1.91 With Respective Years 2016, 2015, 2014, 2013.The Ideal
0
0.5
1
1.5
2
2.5
3
3.5
2016-2015 2015-2014 2014-2013 2013-2012
CURRENT RATIO
QUICK RATIO
DEBT-EQUITY RATIO
PROPERIETARY RATIO
SOLVENCY RATIO
FIXED ASSET TO NET WORTH
CURRENT ASSET TO NET
WORTH
CURRENT LIB. TO NET
WORTH
63
Ratio Is 0.75:1.The Performance Of The Company Is Unfavourable
Condition.
 In The Current Asset To Net Worth Of Company Ratio Was Result Is
3.11, 2.91, 2.48, 2.53 With Respective Years 2016, 2015, 2014, 2013.The
Company In Stable Condition.
 In The Company Ratio Current Liabilities To Net Worth Result Was
1.60, 1.81, 1.89, 2.45 Respective Years 2016, 2015, 2014, 2013.The Ideal
Ratio Is 1:3.So The Company Performance Not Well Infect Unfavourable
Condition.
 In The Company Fixed Asset Ratio Result Was 1.70, 1.97, 2.06, 1.91
With Respective Years 2016, 2015, 2014, 2013.And The Ideal Ratio Is
0.67:1 So Company Performance Unfavourable Condition.
64
CHAPTER – 7
LIMITATION OF RATIO ANAYLSIS
Ratio analysis is one of the important techniques of determining the performance of financial
Strength and weakness of a firm. Though ratio analysis is relevant and useful technique for the
business concern, the analysis is based on the information available in the financial statements.
There are some situations, where ratios are misused; it may lead the management to wrong
direction. The ratio analysis suffers from the following limitations:
1. Ratio analysis is used on the basis of financial statements. Number of limitations of financial
statements may affect the accuracy or quality of ratio analysis.
2. Ratio analysis heavily depends on quantitative facts and figures and it ignores qualitative data.
Therefore this may limit accuracy.
3. Ratio analysis is a poor measure of a firm's performance due to lack of adequate standards laid
for ideal ratios.
4. It is not a substitute for analysis of financial statements. It is merely used as a tool for
measuring the performance of business activities.
5. Ratio analysis clearly has some latitude for window dressing.
8. Ratio analysis does not consider the change in price level, as such; this ratio will not help in
drawing meaningful inferences.
65
CHAPTER -8
SUGGESTIONS & RECOMMENDATIONS
Financial Statements Play An Essential Role In Modern Economies, Partly Because Of A Series
Of Regulatory Pronouncements And Investor Demands For Greater Accountability And Data
Transparency. Businesses Rely On A Network Of Operating Resources And Technological
Equipment To Identify What's Important When Analyzing Accounting Reports And
Recommending Steps For Compliance.
 Quick Ratio Is Better Condition It’s Indicate Liquidity Position Is Not Good So, It
Improve
 Proprietary Ratio Is Better Condition It’s Indicate Not Good Long Term Solvency
(Financial) Position of the Company. This Ratio Indicates The Extent To Which The
Assets Of The Company Can Be Lost Without Affecting The Interest Of The
Creditors Of The Company. So, Increase Fixed Asset
 Fixed Asset To Net Worth Ratio Is Unfavourable Condition It’s Indicates The Extent
To Which Ownership Funds Are Sunk Into Assets With Relatively Low Turnover.
When The Amount of Proprietor's Funds Exceed the Value Of Fixed Assets, A part
Of The Net Working Capital Is Provided By The Shareholders, Provided There Are
No Other Non-Current Assets, And When Proprietor’s Funds Are Less Than The
Fixed Assets, Creditors Obligation Have Been Used To Finance A Part Of Fixed
Assets. The Yardstick For This Measure Is 65% For Industrial
Undertakings.So,Increase Fixed Asset
 Current Liabilities to Net worth Is Unfavourable Condition .This Ratio Indicates the
Relative Contribution of Short Term Creditors and Owners to the Capital of an
Enterprise. If The Ratio Is High, It Means It Is Difficult To Obtain Long Term Funds
By The Business. So, Company Have To Stop To Increase This Ratio.
 Fixed Asset Ratio Is Also Unfavourable Condition its Not Yet to Improve Standred of
Ideal Ratio .This Ratio Enables to Know How Fixed Assets Are Financed I.E. By Use
of Short Term Funds or By Long Term Funds. This Ratio Should Not Be More Than
1.Company Having Improved Lot.
 Other Suggestions & Recommendations
 Ensuring Compliance With All Applicable Legislative Requirements
 Empowering Employees To Ensure Safety In Their Respective Work
Places
 Promoting Safety And Health Awareness Amongst Employees, Suppliers And
Contractors
 Continuous Improvement In Safety Performance Through Awareness, Participation
And Training Of Employees
 Set Environmental Objectives And Targets
66
 Continually Improve And Maintain High Levels Of Operational And Technical
Performance
 Reduce And/or Prevent Pollution, Minimize Wastage Of Resources
 Comply With Legal And Regulatory Requirements
 Practice Good Corporate Governance To Protect Shareholder Value
 Maintain Strong Audit Programs To Increase Interest And Confidence
 Keep Shareholders Informed About The Company And Other Developments
 The Mark Exhaust Group Has Seen Rapid And Consistent Growth. Today We Have
Revenues Of Rs. 500 Crores, Over 700 Employees And State-Of-The-Art
Manufacturing Plants To Cater To A Growing Local And Global Customer Base. Our
Revenues Have Grown Steadily And They Have Doubled In The Last Three Years.
With A Cagr Of 26%, We Have Maintained A Growth Rate That Is Double Of The
Industry Average.
67
CHAPTER-9
CONCLUSION
Two years back, when the spectre of a slowdown loomed large on the domestic automotive
industry, the Gurgaon-based sheet metal component maker Mark ExhaustSystems Limited
(MESL), changed tack by focusing more on acquisitions and diversification while holding back
on Greenfield expansion.
The company, a joint venture between Rattan Kapur & Associates and Suzuki India made two
acquisitions in the past few months and looks at taking its Group turnover (Rattan Kapur &
Associates) from Rs 1,400 crore in FY14 to Rs 2,000 crore by next fiscal year. The company, a
couple of weeks ago, acquired 100% stake in Haryana-based BWI Shock Absorbers for $ 1.5
million.
The Chinese firm BWI Shock Absorbers had recently bought the company from leading German
component maker Delphi and now the company has changed hands in favour of MESL. Maruti
Suzuki is a major client. The acquired company reported a turnover of Rs 140 crore in FY14.
"EBIDTA margins have been lower than expected due to the slowing demand in the market. The
margins were in the range of around 14-15%. We have held back on fresh investment through
the organic route and chose to look at acquisitions," Rattan Kapur, Chairman and Managing
Director, MESL told ETAuto in an interview recently.
MESL is one of the few companies that started as a joint venture with country's largest carmaker
Maruti Suzuki. "We make acquisitions that are backed by R&D," he said.
Though the company focuses on exports, Kapur says this will change as he plans to cater to
Indian OEMs and would also diversify to service two-wheeler makers. BWI has a R&D base in
Poland and a MESL team is currently camped in East European nation.
"The acquisition will help the company establish its own R&D, training and validation centre in
India in the next two years. BWI had a turnover of around Rs 140 crore in FY14, but it still has
about 40% spare capacity which leaves room for further expansion," said Rattan. BWI was
originally, Delphi Company but was taken over by the Chinese company BWI Shock Absorber.
About six months ago, the company had diversified into pumps by acquiring a North Wales
company Quinton Hazell (now Mark Water Pumps Limited) for $1.64 million dollars. The
company has Volvo, Aston Martin & JLR as their major customers.
The company has recently concluded its organic expansion. It recently set up a new plant in
Bangalore to build suspension system for Honda Motorcycles with an investment of Rs 120
crore.
MESL with its subsidiary Track Component, in Pune has partnered Mahindra & Mahindra for
making under body systems and also CCBs -cross car beams for all the new models that
68
Mahindra & Mahindra is going to launch. The company has invested Rs 70 crores in this plant.

Contenu connexe

Tendances

Balance sheet free pdf
Balance sheet free pdfBalance sheet free pdf
Balance sheet free pdfS.Saeed H
 
Assets and liablity
Assets and liablityAssets and liablity
Assets and liablityNandini R
 
Winsem2012 13 cp1056-11-jan-2013_rm01_lecture-4---financial-reports
Winsem2012 13 cp1056-11-jan-2013_rm01_lecture-4---financial-reportsWinsem2012 13 cp1056-11-jan-2013_rm01_lecture-4---financial-reports
Winsem2012 13 cp1056-11-jan-2013_rm01_lecture-4---financial-reportsRahul Kakodkar
 
Balsheetguide
BalsheetguideBalsheetguide
Balsheetguideagugulet
 
ECA Alert - IND AS 1 Presentation of Financial Statements
ECA Alert - IND AS 1 Presentation of Financial StatementsECA Alert - IND AS 1 Presentation of Financial Statements
ECA Alert - IND AS 1 Presentation of Financial StatementsAkash Gupta
 
Revised Schedule VI of Companies Act, 1956
Revised Schedule VI of Companies Act, 1956Revised Schedule VI of Companies Act, 1956
Revised Schedule VI of Companies Act, 1956Ankur Chaplot
 
Assets and liabilities
Assets and liabilitiesAssets and liabilities
Assets and liabilitiesDyann Barras
 
Ind as 12 vs ind as 22
Ind as 12 vs ind as 22Ind as 12 vs ind as 22
Ind as 12 vs ind as 22Ashok Sharma
 
Schedule III of Companies Act 2013, India
Schedule III of Companies Act 2013, IndiaSchedule III of Companies Act 2013, India
Schedule III of Companies Act 2013, IndiaPiyali Parashari
 
Ff topic2 analysis_of_financial_statement_and_cash_flow
Ff topic2 analysis_of_financial_statement_and_cash_flowFf topic2 analysis_of_financial_statement_and_cash_flow
Ff topic2 analysis_of_financial_statement_and_cash_flowakma cool gurlz
 
Ind as 21 vs as-11
Ind as 21 vs as-11Ind as 21 vs as-11
Ind as 21 vs as-11UMESH SHARMA
 
Accounting interview questions and answers by m riaz khan
Accounting interview questions and answers by m riaz khanAccounting interview questions and answers by m riaz khan
Accounting interview questions and answers by m riaz khanM Riaz Khan
 
Presentation of financial stmt ias 1, 10, 24,
Presentation of financial stmt ias 1, 10, 24,Presentation of financial stmt ias 1, 10, 24,
Presentation of financial stmt ias 1, 10, 24,Peculiar Labstery
 
Fixed Assets And Liabilities
Fixed Assets And LiabilitiesFixed Assets And Liabilities
Fixed Assets And LiabilitiesUltraspectra
 

Tendances (20)

Balance sheet free pdf
Balance sheet free pdfBalance sheet free pdf
Balance sheet free pdf
 
Ind as 101 CRS part 1
Ind as 101 CRS part 1Ind as 101 CRS part 1
Ind as 101 CRS part 1
 
Assets and liablity
Assets and liablityAssets and liablity
Assets and liablity
 
Winsem2012 13 cp1056-11-jan-2013_rm01_lecture-4---financial-reports
Winsem2012 13 cp1056-11-jan-2013_rm01_lecture-4---financial-reportsWinsem2012 13 cp1056-11-jan-2013_rm01_lecture-4---financial-reports
Winsem2012 13 cp1056-11-jan-2013_rm01_lecture-4---financial-reports
 
Balsheetguide
BalsheetguideBalsheetguide
Balsheetguide
 
ECA Alert - IND AS 1 Presentation of Financial Statements
ECA Alert - IND AS 1 Presentation of Financial StatementsECA Alert - IND AS 1 Presentation of Financial Statements
ECA Alert - IND AS 1 Presentation of Financial Statements
 
Balance sheet
Balance sheetBalance sheet
Balance sheet
 
Pooja 1
Pooja 1 Pooja 1
Pooja 1
 
Revised Schedule VI of Companies Act, 1956
Revised Schedule VI of Companies Act, 1956Revised Schedule VI of Companies Act, 1956
Revised Schedule VI of Companies Act, 1956
 
Assets and liabilities
Assets and liabilitiesAssets and liabilities
Assets and liabilities
 
Ind as 12 vs ind as 22
Ind as 12 vs ind as 22Ind as 12 vs ind as 22
Ind as 12 vs ind as 22
 
Schedule III of Companies Act 2013, India
Schedule III of Companies Act 2013, IndiaSchedule III of Companies Act 2013, India
Schedule III of Companies Act 2013, India
 
Ff topic2 analysis_of_financial_statement_and_cash_flow
Ff topic2 analysis_of_financial_statement_and_cash_flowFf topic2 analysis_of_financial_statement_and_cash_flow
Ff topic2 analysis_of_financial_statement_and_cash_flow
 
Balance sheet
Balance sheetBalance sheet
Balance sheet
 
Ind as 21 vs as-11
Ind as 21 vs as-11Ind as 21 vs as-11
Ind as 21 vs as-11
 
IAS -Doha Presentation
IAS -Doha PresentationIAS -Doha Presentation
IAS -Doha Presentation
 
Accounting interview questions and answers by m riaz khan
Accounting interview questions and answers by m riaz khanAccounting interview questions and answers by m riaz khan
Accounting interview questions and answers by m riaz khan
 
IAS 1/ Ind AS 1
IAS 1/ Ind AS 1IAS 1/ Ind AS 1
IAS 1/ Ind AS 1
 
Presentation of financial stmt ias 1, 10, 24,
Presentation of financial stmt ias 1, 10, 24,Presentation of financial stmt ias 1, 10, 24,
Presentation of financial stmt ias 1, 10, 24,
 
Fixed Assets And Liabilities
Fixed Assets And LiabilitiesFixed Assets And Liabilities
Fixed Assets And Liabilities
 

Similaire à Balance Sheet Analysis and Key Financial Ratios

PROCESS ENGINEERING & ECONOMICS - COST ACCOUNTING & ESTIMATION
PROCESS ENGINEERING & ECONOMICS - COST ACCOUNTING & ESTIMATIONPROCESS ENGINEERING & ECONOMICS - COST ACCOUNTING & ESTIMATION
PROCESS ENGINEERING & ECONOMICS - COST ACCOUNTING & ESTIMATIONpriyachemical
 
“A STUDY ON FINANCIAL ANALYSIS”
“A STUDY ON FINANCIAL ANALYSIS”“A STUDY ON FINANCIAL ANALYSIS”
“A STUDY ON FINANCIAL ANALYSIS”anirudhbatiya
 
ACCOUNTING - BRIDGE COURSE.pdf
ACCOUNTING - BRIDGE COURSE.pdfACCOUNTING - BRIDGE COURSE.pdf
ACCOUNTING - BRIDGE COURSE.pdfAbinkNelson
 
Topic 2 financial_20statement_1_
Topic 2 financial_20statement_1_Topic 2 financial_20statement_1_
Topic 2 financial_20statement_1_Idzni Zalika
 
Topic 2 financial_20statement_1_
Topic 2 financial_20statement_1_Topic 2 financial_20statement_1_
Topic 2 financial_20statement_1_Idzni Zalika
 
Basic Accounting Principles session 1 by Dino Leonandri
Basic Accounting Principles  session 1 by Dino LeonandriBasic Accounting Principles  session 1 by Dino Leonandri
Basic Accounting Principles session 1 by Dino LeonandriDINOLEONANDRI
 
FINANCIAL STATEMENT ANALYSIS - BASICS OF BALANCE SHEET AND PROFIT AND LOSS AC...
FINANCIAL STATEMENT ANALYSIS - BASICS OF BALANCE SHEET AND PROFIT AND LOSS AC...FINANCIAL STATEMENT ANALYSIS - BASICS OF BALANCE SHEET AND PROFIT AND LOSS AC...
FINANCIAL STATEMENT ANALYSIS - BASICS OF BALANCE SHEET AND PROFIT AND LOSS AC...ShreyaGangakhedkar
 
Concepts and contents for balance sheet
Concepts and contents for balance sheetConcepts and contents for balance sheet
Concepts and contents for balance sheetDinesh Pupala
 
ENM5201_week 7.pdf
ENM5201_week 7.pdfENM5201_week 7.pdf
ENM5201_week 7.pdfAbdulhaqAli
 
financialfeasibility-200129141325.pdf
financialfeasibility-200129141325.pdffinancialfeasibility-200129141325.pdf
financialfeasibility-200129141325.pdfPrincessBaybay
 
Financial feasibility
Financial feasibilityFinancial feasibility
Financial feasibilityharrysingh272
 
Assets and Liabilities_Nov4th.pptx
Assets and Liabilities_Nov4th.pptxAssets and Liabilities_Nov4th.pptx
Assets and Liabilities_Nov4th.pptxRashmi Gowda KM
 
What are the elements of financial statements.pdf
What are the elements of financial statements.pdfWhat are the elements of financial statements.pdf
What are the elements of financial statements.pdfsarikabangimatam
 
Understanding Financial Statement / Report
Understanding Financial Statement / ReportUnderstanding Financial Statement / Report
Understanding Financial Statement / ReportMayur Khatri
 

Similaire à Balance Sheet Analysis and Key Financial Ratios (20)

PROCESS ENGINEERING & ECONOMICS - COST ACCOUNTING & ESTIMATION
PROCESS ENGINEERING & ECONOMICS - COST ACCOUNTING & ESTIMATIONPROCESS ENGINEERING & ECONOMICS - COST ACCOUNTING & ESTIMATION
PROCESS ENGINEERING & ECONOMICS - COST ACCOUNTING & ESTIMATION
 
C2
C2C2
C2
 
“A STUDY ON FINANCIAL ANALYSIS”
“A STUDY ON FINANCIAL ANALYSIS”“A STUDY ON FINANCIAL ANALYSIS”
“A STUDY ON FINANCIAL ANALYSIS”
 
ACCOUNTING - BRIDGE COURSE.pdf
ACCOUNTING - BRIDGE COURSE.pdfACCOUNTING - BRIDGE COURSE.pdf
ACCOUNTING - BRIDGE COURSE.pdf
 
About Balance Sheet
About Balance SheetAbout Balance Sheet
About Balance Sheet
 
Topic 2 financial_20statement_1_
Topic 2 financial_20statement_1_Topic 2 financial_20statement_1_
Topic 2 financial_20statement_1_
 
Topic 2 financial_20statement_1_
Topic 2 financial_20statement_1_Topic 2 financial_20statement_1_
Topic 2 financial_20statement_1_
 
Ppt
PptPpt
Ppt
 
Basic Accounting Principles session 1 by Dino Leonandri
Basic Accounting Principles  session 1 by Dino LeonandriBasic Accounting Principles  session 1 by Dino Leonandri
Basic Accounting Principles session 1 by Dino Leonandri
 
FINANCIAL STATEMENT ANALYSIS - BASICS OF BALANCE SHEET AND PROFIT AND LOSS AC...
FINANCIAL STATEMENT ANALYSIS - BASICS OF BALANCE SHEET AND PROFIT AND LOSS AC...FINANCIAL STATEMENT ANALYSIS - BASICS OF BALANCE SHEET AND PROFIT AND LOSS AC...
FINANCIAL STATEMENT ANALYSIS - BASICS OF BALANCE SHEET AND PROFIT AND LOSS AC...
 
Financial Statements.pdf
Financial Statements.pdfFinancial Statements.pdf
Financial Statements.pdf
 
Concepts and contents for balance sheet
Concepts and contents for balance sheetConcepts and contents for balance sheet
Concepts and contents for balance sheet
 
ENM5201_week 7.pdf
ENM5201_week 7.pdfENM5201_week 7.pdf
ENM5201_week 7.pdf
 
Revised Schedule VI
Revised Schedule VIRevised Schedule VI
Revised Schedule VI
 
financialfeasibility-200129141325.pdf
financialfeasibility-200129141325.pdffinancialfeasibility-200129141325.pdf
financialfeasibility-200129141325.pdf
 
Financial feasibility
Financial feasibilityFinancial feasibility
Financial feasibility
 
Assets and Liabilities_Nov4th.pptx
Assets and Liabilities_Nov4th.pptxAssets and Liabilities_Nov4th.pptx
Assets and Liabilities_Nov4th.pptx
 
What are the elements of financial statements.pdf
What are the elements of financial statements.pdfWhat are the elements of financial statements.pdf
What are the elements of financial statements.pdf
 
Understanding Financial Statement / Report
Understanding Financial Statement / ReportUnderstanding Financial Statement / Report
Understanding Financial Statement / Report
 
Financial statement
Financial statementFinancial statement
Financial statement
 

Dernier

Inclusivity Essentials_ Creating Accessible Websites for Nonprofits .pdf
Inclusivity Essentials_ Creating Accessible Websites for Nonprofits .pdfInclusivity Essentials_ Creating Accessible Websites for Nonprofits .pdf
Inclusivity Essentials_ Creating Accessible Websites for Nonprofits .pdfTechSoup
 
4.16.24 Poverty and Precarity--Desmond.pptx
4.16.24 Poverty and Precarity--Desmond.pptx4.16.24 Poverty and Precarity--Desmond.pptx
4.16.24 Poverty and Precarity--Desmond.pptxmary850239
 
GRADE 4 - SUMMATIVE TEST QUARTER 4 ALL SUBJECTS
GRADE 4 - SUMMATIVE TEST QUARTER 4 ALL SUBJECTSGRADE 4 - SUMMATIVE TEST QUARTER 4 ALL SUBJECTS
GRADE 4 - SUMMATIVE TEST QUARTER 4 ALL SUBJECTSJoshuaGantuangco2
 
Presentation Activity 2. Unit 3 transv.pptx
Presentation Activity 2. Unit 3 transv.pptxPresentation Activity 2. Unit 3 transv.pptx
Presentation Activity 2. Unit 3 transv.pptxRosabel UA
 
Daily Lesson Plan in Mathematics Quarter 4
Daily Lesson Plan in Mathematics Quarter 4Daily Lesson Plan in Mathematics Quarter 4
Daily Lesson Plan in Mathematics Quarter 4JOYLYNSAMANIEGO
 
ICS2208 Lecture6 Notes for SL spaces.pdf
ICS2208 Lecture6 Notes for SL spaces.pdfICS2208 Lecture6 Notes for SL spaces.pdf
ICS2208 Lecture6 Notes for SL spaces.pdfVanessa Camilleri
 
THEORIES OF ORGANIZATION-PUBLIC ADMINISTRATION
THEORIES OF ORGANIZATION-PUBLIC ADMINISTRATIONTHEORIES OF ORGANIZATION-PUBLIC ADMINISTRATION
THEORIES OF ORGANIZATION-PUBLIC ADMINISTRATIONHumphrey A Beña
 
Transaction Management in Database Management System
Transaction Management in Database Management SystemTransaction Management in Database Management System
Transaction Management in Database Management SystemChristalin Nelson
 
Visit to a blind student's school🧑‍🦯🧑‍🦯(community medicine)
Visit to a blind student's school🧑‍🦯🧑‍🦯(community medicine)Visit to a blind student's school🧑‍🦯🧑‍🦯(community medicine)
Visit to a blind student's school🧑‍🦯🧑‍🦯(community medicine)lakshayb543
 
Incoming and Outgoing Shipments in 3 STEPS Using Odoo 17
Incoming and Outgoing Shipments in 3 STEPS Using Odoo 17Incoming and Outgoing Shipments in 3 STEPS Using Odoo 17
Incoming and Outgoing Shipments in 3 STEPS Using Odoo 17Celine George
 
EMBODO Lesson Plan Grade 9 Law of Sines.docx
EMBODO Lesson Plan Grade 9 Law of Sines.docxEMBODO Lesson Plan Grade 9 Law of Sines.docx
EMBODO Lesson Plan Grade 9 Law of Sines.docxElton John Embodo
 
How to do quick user assign in kanban in Odoo 17 ERP
How to do quick user assign in kanban in Odoo 17 ERPHow to do quick user assign in kanban in Odoo 17 ERP
How to do quick user assign in kanban in Odoo 17 ERPCeline George
 
TEACHER REFLECTION FORM (NEW SET........).docx
TEACHER REFLECTION FORM (NEW SET........).docxTEACHER REFLECTION FORM (NEW SET........).docx
TEACHER REFLECTION FORM (NEW SET........).docxruthvilladarez
 
Measures of Position DECILES for ungrouped data
Measures of Position DECILES for ungrouped dataMeasures of Position DECILES for ungrouped data
Measures of Position DECILES for ungrouped dataBabyAnnMotar
 
Concurrency Control in Database Management system
Concurrency Control in Database Management systemConcurrency Control in Database Management system
Concurrency Control in Database Management systemChristalin Nelson
 
Millenials and Fillennials (Ethical Challenge and Responses).pptx
Millenials and Fillennials (Ethical Challenge and Responses).pptxMillenials and Fillennials (Ethical Challenge and Responses).pptx
Millenials and Fillennials (Ethical Challenge and Responses).pptxJanEmmanBrigoli
 
INTRODUCTION TO CATHOLIC CHRISTOLOGY.pptx
INTRODUCTION TO CATHOLIC CHRISTOLOGY.pptxINTRODUCTION TO CATHOLIC CHRISTOLOGY.pptx
INTRODUCTION TO CATHOLIC CHRISTOLOGY.pptxHumphrey A Beña
 
Textual Evidence in Reading and Writing of SHS
Textual Evidence in Reading and Writing of SHSTextual Evidence in Reading and Writing of SHS
Textual Evidence in Reading and Writing of SHSMae Pangan
 
ClimART Action | eTwinning Project
ClimART Action    |    eTwinning ProjectClimART Action    |    eTwinning Project
ClimART Action | eTwinning Projectjordimapav
 

Dernier (20)

Inclusivity Essentials_ Creating Accessible Websites for Nonprofits .pdf
Inclusivity Essentials_ Creating Accessible Websites for Nonprofits .pdfInclusivity Essentials_ Creating Accessible Websites for Nonprofits .pdf
Inclusivity Essentials_ Creating Accessible Websites for Nonprofits .pdf
 
4.16.24 Poverty and Precarity--Desmond.pptx
4.16.24 Poverty and Precarity--Desmond.pptx4.16.24 Poverty and Precarity--Desmond.pptx
4.16.24 Poverty and Precarity--Desmond.pptx
 
GRADE 4 - SUMMATIVE TEST QUARTER 4 ALL SUBJECTS
GRADE 4 - SUMMATIVE TEST QUARTER 4 ALL SUBJECTSGRADE 4 - SUMMATIVE TEST QUARTER 4 ALL SUBJECTS
GRADE 4 - SUMMATIVE TEST QUARTER 4 ALL SUBJECTS
 
Presentation Activity 2. Unit 3 transv.pptx
Presentation Activity 2. Unit 3 transv.pptxPresentation Activity 2. Unit 3 transv.pptx
Presentation Activity 2. Unit 3 transv.pptx
 
Daily Lesson Plan in Mathematics Quarter 4
Daily Lesson Plan in Mathematics Quarter 4Daily Lesson Plan in Mathematics Quarter 4
Daily Lesson Plan in Mathematics Quarter 4
 
ICS2208 Lecture6 Notes for SL spaces.pdf
ICS2208 Lecture6 Notes for SL spaces.pdfICS2208 Lecture6 Notes for SL spaces.pdf
ICS2208 Lecture6 Notes for SL spaces.pdf
 
THEORIES OF ORGANIZATION-PUBLIC ADMINISTRATION
THEORIES OF ORGANIZATION-PUBLIC ADMINISTRATIONTHEORIES OF ORGANIZATION-PUBLIC ADMINISTRATION
THEORIES OF ORGANIZATION-PUBLIC ADMINISTRATION
 
Transaction Management in Database Management System
Transaction Management in Database Management SystemTransaction Management in Database Management System
Transaction Management in Database Management System
 
YOUVE_GOT_EMAIL_PRELIMS_EL_DORADO_2024.pptx
YOUVE_GOT_EMAIL_PRELIMS_EL_DORADO_2024.pptxYOUVE_GOT_EMAIL_PRELIMS_EL_DORADO_2024.pptx
YOUVE_GOT_EMAIL_PRELIMS_EL_DORADO_2024.pptx
 
Visit to a blind student's school🧑‍🦯🧑‍🦯(community medicine)
Visit to a blind student's school🧑‍🦯🧑‍🦯(community medicine)Visit to a blind student's school🧑‍🦯🧑‍🦯(community medicine)
Visit to a blind student's school🧑‍🦯🧑‍🦯(community medicine)
 
Incoming and Outgoing Shipments in 3 STEPS Using Odoo 17
Incoming and Outgoing Shipments in 3 STEPS Using Odoo 17Incoming and Outgoing Shipments in 3 STEPS Using Odoo 17
Incoming and Outgoing Shipments in 3 STEPS Using Odoo 17
 
EMBODO Lesson Plan Grade 9 Law of Sines.docx
EMBODO Lesson Plan Grade 9 Law of Sines.docxEMBODO Lesson Plan Grade 9 Law of Sines.docx
EMBODO Lesson Plan Grade 9 Law of Sines.docx
 
How to do quick user assign in kanban in Odoo 17 ERP
How to do quick user assign in kanban in Odoo 17 ERPHow to do quick user assign in kanban in Odoo 17 ERP
How to do quick user assign in kanban in Odoo 17 ERP
 
TEACHER REFLECTION FORM (NEW SET........).docx
TEACHER REFLECTION FORM (NEW SET........).docxTEACHER REFLECTION FORM (NEW SET........).docx
TEACHER REFLECTION FORM (NEW SET........).docx
 
Measures of Position DECILES for ungrouped data
Measures of Position DECILES for ungrouped dataMeasures of Position DECILES for ungrouped data
Measures of Position DECILES for ungrouped data
 
Concurrency Control in Database Management system
Concurrency Control in Database Management systemConcurrency Control in Database Management system
Concurrency Control in Database Management system
 
Millenials and Fillennials (Ethical Challenge and Responses).pptx
Millenials and Fillennials (Ethical Challenge and Responses).pptxMillenials and Fillennials (Ethical Challenge and Responses).pptx
Millenials and Fillennials (Ethical Challenge and Responses).pptx
 
INTRODUCTION TO CATHOLIC CHRISTOLOGY.pptx
INTRODUCTION TO CATHOLIC CHRISTOLOGY.pptxINTRODUCTION TO CATHOLIC CHRISTOLOGY.pptx
INTRODUCTION TO CATHOLIC CHRISTOLOGY.pptx
 
Textual Evidence in Reading and Writing of SHS
Textual Evidence in Reading and Writing of SHSTextual Evidence in Reading and Writing of SHS
Textual Evidence in Reading and Writing of SHS
 
ClimART Action | eTwinning Project
ClimART Action    |    eTwinning ProjectClimART Action    |    eTwinning Project
ClimART Action | eTwinning Project
 

Balance Sheet Analysis and Key Financial Ratios

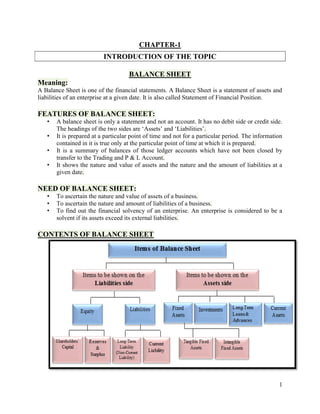
  • 1. 1 CHAPTER-1 INTRODUCTION OF THE TOPIC BALANCE SHEET Meaning: A Balance Sheet is one of the financial statements. A Balance Sheet is a statement of assets and liabilities of an enterprise at a given date. It is also called Statement of Financial Position. FEATURES OF BALANCE SHEET: • A balance sheet is only a statement and not an account. It has no debit side or credit side. The headings of the two sides are ‘Assets’ and ‘Liabilities’. • It is prepared at a particular point of time and not for a particular period. The information contained in it is true only at the particular point of time at which it is prepared. • It is a summary of balances of those ledger accounts which have not been closed by transfer to the Trading and P & L Account. • It shows the nature and value of assets and the nature and the amount of liabilities at a given date. NEED OF BALANCE SHEET: • To ascertain the nature and value of assets of a business. • To ascertain the nature and amount of liabilities of a business. • To find out the financial solvency of an enterprise. An enterprise is considered to be a solvent if its assets exceed its external liabilities. CONTENTS OF BALANCE SHEET
  • 2. 2 ITEMS OF B/S - EQUITY & LIABILITIES Equity is the residual interest of owners in the assets of the entity after deducting all its liabilities. It is also called Shareholders’ Fund or Capital Liability is a present obligation of the arising from past events, the settlement of which is expected to result in an outflow from the entity of resources embodying economic benefits. Shareholders’ Funds (a) Share Capital – It is the amount contributed by the shareholders towards the company’s capital and is entered in the company’s share capital account. (b) Reserves and Surplus – It is a profit achieved by a company where a certain amount of it is put back into the business which can help the business in their rainy days ITEMS OF B/S – NON-CURRENT LIABILITIES Those obligations that do not meet the criteria for being classified as current liabilities are simply called non-current liabilities. For e.g. Mortgage, bonds and long term leases etc. (a) Long-Term Borrowings – Loans taken for a time period exceeding 12 months are classified as long term borrowings. (b) Deferred Tax Liabilities - The tax effect of taxable temporary differences is recognized as deferred tax liabilities which are payable beyond 1 year period. (c) Long-Term Provisions – It includes Provision for Employee Benefits. ITEMS OF B/S – CURRENT LIABILITIES These are normally paid by using existing current assets, creating other current liabilities or fulfilling contractual obligations to provide goods or services. E.g. Bills Payables, Trade Payables, Bank Overdraft etc. (a) Short-Term Borrowings – It includes Loans repayable on demand from banks and other loans payable within duration of 12 months like commercial papers. (b) Trade Payables - The trade payables show the amounts owed to suppliers for purchases of goods and services on credit. (c) Other Current Liabilities – It may include advances from customers and other short term obligations of the company. (d) Short-Term Provisions – Provision for Employee Benefits, Proposed Dividend, Provision for Tax on Distributed Profit. ITEMS OF B/S – ASSETS An asset is a resource controlled by the entity as a result of past events and from which future economic benefits are expected to flow to the entity. For e.g. Land, Building, Machinery, Equipment etc. ITEMS OF B/S – NON-CURRENT ASSETS
  • 3. 3 (a) Fixed Asset - A fixed asset is an asset held with the intention of being used for the purpose of producing or supplying goods or services and is not held for sale in the normal course of business.  Tangible Fixed Assets – These have physical existence and can be seen and felt. For e.g. Land, Buildings, Furniture, Equipment etc.  Intangible Fixed Assets – These are identifiable non-monetary assets, without physical substance, held for use in the production or supply of goods or services, for rental to others, or for administrative purposes. For e.g. Brand Names, Copyrights, Goodwill, Patent etc.  Capital Work-In-Progress – It is referred to as assets under construction that is not considered to be final product but must still be accounted for because funds have been invested towards its production. (b) Non-Current Investments – It is the investment which is for long period and not releasable for current period. For e.g. investment in equity instruments (subsidiary companies, associate companies), joint venture and in preference shares and in partnership firm. (c) Long-Term Loans and Advances – It includes secured and unsecured loans and advances with duration of more than 12 months. (d) Other Non-Current Assets – It includes secured and unsecured interest accrued on loans. ITEMS OF B/S – CURRENT ASSETS Cash and other assets that are expected to be realized in cash or sold or consumed during the normal operating cycle of the entity or within one year, whichever is longer, are called current assets. (a) Current Investment – A current investment that is by its nature readily realizable and is intended to be held for not more than one year from the date on which such investment is made. For e.g. Investment in Mutual Funds. (b) Inventories – Inventories are assets which held for sale in the ordinary course of business; in the process of production for such sale or in the form of materials or supplies to be consumed in the production process or in the rendering of services. (c) Trade Receivables – It includes the amounts receivable from customers for sales of goods or services on credit. (d) Cash and Bank Balances – It shows receipts and payments of cash. Cash includes coins, currency, cheques and amounts deposited in banks. (e) Short-Term Loans and Advances – It includes loans and advances like loans to employees, advances to suppliers, loans and advances to subsidiary and associate companies etc. (f) Other Current Assets – It includes interest accrued on loans and deposits and other receivables.
  • 4. 4 BALANCE SHEET – REVISED FORMAT (Rupees in ………………) PATICULAR NOTES NO. CURRENT REPORTING PERIOD PREVIOUS REPORTING PERIOD I.EQUITY AND LIABILITIES 1)SHAREHOLDERS’ FUNDS a)share capital *** *** b)reserves and surplus *** *** c)money received against share warrants *** *** 2)SHARE APPLICATION MONEY PENDING ALLOTMENT *** *** 3)NON-CURRENT LIABILITIES a)long-term borrowings *** *** b)deferred tax liab.(net) *** *** c)other long term liabilities *** *** d)long-term provision *** *** 4)CURRENT LIABILITIES a)short-term borrowings *** *** b)trade payables *** *** c)others current liabilities *** *** d)short-term provision *** *** TOTAL *** *** II.ASSETS 1)NON-CURRENTS ASSETS a)fixed assets 1.tangible assets *** *** 2.intangible assets *** *** 3.capital work-in-progress *** *** 4.intangible assets under development *** *** b)non-current investments *** *** c)deferred tax assets(net) *** *** e)other non-current assets *** *** 2)CURRENT ASSETS a)current investments *** *** b)inventories *** *** c)trade receivables *** *** d)cash and cash equivalents *** *** e)short-term loans and advances *** *** f)other current assets *** *** TOTAL *** *** See accompanying notes to the financial statements.
  • 5. 5 FINANCIAL STATEMENT ANALYSIS: A sustainable business and mission requires effective planning and financial management. Ratio analysis is a useful management tool that will improve the understanding of financial results and trends over time, and provide key indicators of organizational performance. Managers will use ratio analysis to pinpoint strengths and weaknesses from which strategies and initiatives can be formed. Funders may use ratio analysis to measure the results against other organizations or make judgments concerning management effectiveness and mission impact. It is defined as the process of identifying financial strengths and weaknesses of the firm by properly establishing relationship between the items of the balance sheet and the profit and loss account. The process of reviewing and evaluating a company’s financial statements (such as the balance sheet or profit and loss statement), thereby gaining an understanding of the financial health of the company and enabling more effective decision making. Financial statements record financial data; however, this information must be evaluated through financial statement analysis to become more useful to investors, shareholders, managers and other interested parties. Financial statement analysis is an evaluative method of determining the past, current and projected performance of a company. For ratios to be useful and meaningful, they must be: o Calculated using reliable, accurate financial information o Calculated consistently from period to period o Used in comparison to internal benchmarks and goals o Used in comparison to other companies in the industry o Viewed both at a single point in time and as an indication of broad trends and issues over time o carefully interpreted in the proper context, considering there are many other important factors and indicators involved in assessing performance. o to provide analytical information to all interested parties. o to justify and analyze the earning capacity of the firm o To justify and analyze the financial position of the firm o To evaluate operations of the firm. o To evaluate progress of the business of the firm o To utilize resources properly and effectively o To analyze and evaluate management efficiency.
  • 6. 6 RATIO PURPOSE AND USE OF RATIO ANALYSIS: A primary advantage of ratios is that they can be used to compare the risk and return relationships of firms of different sizes. Ratios can also provide a profile of a firm, its economic characteristics and competitive strategies, and its unique operating, financial and investment characteristics. However, be deceptive as it ignores differences among industries, the effect of varying capital structure and differences bin accounting and reporting methods. Given these differences, changes in a ratio and variability over time may be more informative than the level of the ratio at any point in time. RATIO ANALYSIS Ratio analysis is the process of determining and interpreting numerical relationship based on financial statements. It is the technique of interpretation of financial statements with the help of accounting ratios derived from the balance sheet and profit and loss account.  Is a method or process by which the relationship of items or groups of items in the financial statements are computed, and presented.  Is an important tool of financial analysis?  Is used to interpret the financial statements so that the strengths and weaknesses of a firm, its historical performance and current financial condition can be determined. RATIO  ‘A mathematical yardstick that measures the relationship between two figures or groups of figures which are related to each other and are mutually inter-dependent’.  It can be expressed as a pure ratio, percentage, or as a rate WORDS OF CAUTION  A ratio is not an end in itself. They are only a means to get to know the financial position of an enterprise.  Computing ratios does not add any information to the available figures.  It only reveals the relationship in a more meaningful way so as to enable us to draw conclusions there from. UTILITY OF RATIOS  Accounting ratios are very useful in assessing the financial position and profitability of an enterprise.  However its utility lies in comparison of the ratios.  Comparison may be in any one of the following forms:  For the same enterprise over a number of years  For two enterprises in the same industry  For one enterprise against the industry as a whole  For one enterprise against a pre-determined standard  For inter-segment comparison within the same organization WAYS TO INTERPRET ACCOUNTING RATIOS  Single absolute ratio.
  • 7. 7  Group ratio.  Historical comparison.  Inter-firm comparison.  Projected ratios. FOUR BROAD CATEGORIES MEASURE THE DIFFERENT ASPECTS OF RISK AND RETURN RELATIONSHIPS: 1. Activity analysis – evaluates revenue and output generated by the firm’s assets 2. Liquidity analysis – measures the adequacy of a firm’s cash resources to meet its near-term cash obligations. 3. Long-term debt and solvency analysis – examines the firm’s capital structure, including the mix of its financing sources and the ability of the firm to satisfy its long-term debt and investment obligations. 4. Profitability analysis – measures the income of the firm relative to its revenues and invested capital. IMPORTANCE OF RATIO ANALYSIS: 1. Ratio analysis simplifies and summarizes complex accounting figures and arranges them systematically for use by different parties. 2. It measures and evaluates the financial condition and operating effectiveness of a business institution. 3. It aids in diagnosing the financial health of the business. By calculating and studying different ratios one can analyze the weaknesses and strengths of the business. 4. By analyzing the past performance future can be projected and predicted. 5. It promotes coordination by studying the efficiency and deficiency of different parts of the business. 6. It assists in communication by conveying necessary information to all related parties. 7. It facilitates the effective control of business operations by means of appraisal targets both physical and monetary.
  • 8. 8 TYPES OF RATIO: A: LIQUIDITY RATIO – Ratios that show the relationship of a firm’s cash and other current assets to its current liabilities. This includes (i) Current ratio (ii) Quick ratio B: ASSET MANAGEMENT RATIO – A set of ratios that measures how effectively a firm is managing its assets. This includes (i) Inventory turnover ratio (ii) Days sales outstanding or average collection period (iii) Fixed asset turnover (iv) Total asset turnover C: DEBT MANAGEMENT RATIO – Ratios that show the relationship of a firm’s total debt, equity and total assets. This includes (i) Debt ratio (ii) Debt-equity ratio (iii) Times interest earned ratio (iv) Fixed charge coverage ratio D: PROFITABILITY RATIO – A group of ratios showing the effect of liquidity, asset management and debt management on operating results. This includes (i) Gross profit margin (ii) Operating profit margin (iii) Net profit margin (iv) Return on total asset (v) Return on common equity (vi) Operating expense ratio E: MARKET VALUE RATIO – A set of ratios that relate the firm’s stock price to its earnings and book value per share. Ratios under this are (i) Price/earnings ratio (ii) Market value/book value ratio Ratios may be classified into the following types depending upon the statements from which they are derived: (a) Balance sheet ratio: Ratios calculated on the basis of the figures drawn from the balance sheet. Current ratio, Quick ratio etc. (b) Profit and loss account ratio: Ratios calculated on the basis of the figures drawn from profit and loss account. Gross profit ratio, net profit ratio etc. (c) Composite ratios: Ratios calculated on the basis of the figures drawn from both balance sheet and profit and loss account. Sales turnover, accounts receivable turnover etc. Ratios as a tool of financial analysis may be classified into the following types: (a) Short-term solvency ratios – Current ratio and quick ratio etc. (b) Financial structure ratios – Debt to equity ratio and debt ratio etc. (c) Profitability ratios – Return on capital employed and return on total assets etc. CLASSIFICATION OF RATIOS  ANALYSIS OF SHORT TERM FINANCIAL POSITION OR TEST OF LIQUIDITY.  ANALYSIS OF LONG TERM FINANCIAL POSITION OR TEST OF SOLVENCY.  ACTIVITY RATIOS.  PROFITABILITY RATIOS.
  • 9. 9 TEST OF LIQUIDITY  The liquidity ratios are used to test the short term solvency or liquidity position of the business.  It enables to know whether short term liabilities can be paid out of short term assets.  It indicates whether a firm has adequate working capital to carry out routine business activity.  It is a valuable aid to management in checking the efficiency with which working capital is being employed.  It is also of importance to shareholders and long term creditors in determining to some extent the prospects of dividend and interest payment. IMPORTANT RATIOS IN TEST OF LIQUIDITY  Current ratio.  Quick ratio.  Absolute liquid ratio. CURRENT RATIO It is the most widely used of all analytical devices based on the balance sheet. It establishes relationship between total current assets and current liabilities CURRENT ASSETS Include – Inventories of raw material, WIP, finished goods, Stores and spares, Sundry debtors/receivables, Short term loans deposits and advances, Cash in hand and bank, Prepaid expenses, Incomes receivables and Marketable investments and short term securities. CURRENT LIABILITIES Include – Sundry creditors/bills payable, Outstanding expenses, Unclaimed dividend, Advances received, Incomes received in advance, Provision for taxation, Proposed dividend, Instalments of loans payable within 12 months, Bank overdraft and cash credit
  • 10. 10 Current assets Current ratio= Current liabilities IDEAL RATIO: 2:1 High ratio indicates under trading and over capitalization. Low ratio indicates over trading and under capitalization QUICK RATIO OR ACID TEST RATIO It establishes relationship between liquid assets and liquid liabilities. It is a refinement to current ratio and second testing device for working capital. Quick assets Quick ratio= Current liabilities IDEAL RATIO: 1:1 Usually, a high acid test ratio is an indication that the firm is liquid and has ability to meet its current or liquid liabilities in time and on the other hand a low quick ratio represents that the firm’s liquidity position is not good. ABSOLUTE LIQUIDITY RATIO This ratio establishes a relationship between absolute liquid assets to quick liabilities Absolute liquid assets Absolute liquid ratio= Quick liabilities IDEAL RATIO: 1:2 It means that if the ratio is 1:2 or more than this the concern can be taken as liquid. If the ratio is less than the standard of 1:2, it means the concern is not liquid Quick assets = Current asset-(inventories + prepaid expenses) Quick Liabilities = Current liabilities – Bank overdraft Absolute liquid assets include cash in hand, cash at bank, marketable securities, temporary investments . TEST OF SOLVENCY  Long term solvency ratios denote the ability of the organization to repay the loan and interest.  When an organization's assets are more than its liabilities is known as solvent organization.  Solvency indicates that position of an enterprise where it is capable of meeting long term obligations.
  • 11. 11 IMPORTANT RATIOS IN TEST OF SOLVENCY  Debt-equity ratio.  Proprietary ratio.  Solvency ratio.  Fixed assets to net worth ratio.  Current assets to net worth ratio.  Current liabilities to net worth ratio.  Capital gearing ratio.  Fixed assets ratio  Debt servicing ratio.  Dividend coverage ratio. DEBT EQUITY RATIO It is calculated to measure the relative claims of outsiders and the owners against the firm’s assets. This ratio indicates the relationship between the outsider’s funds and the shareholders’ funds. Outsider’s funds Debt equity ratio= Shareholders’ funds IDEAL RATIO: 2:1; It means for every 2 shares there is 1 debt. If the debt is less than 2 times the equity, it means the creditors are relatively less and the financial structure is sound. If the debt is more than 2 times the equity, the state of long term creditors are more and indicate weak financial structure. COMPONENTS OF DEBT EQUITY RATIO OUTSIDERS FUNDS Include all debts/liabilities to outsiders, whether long term or short term or whether in the form of debentures, bonds, mortgages or bills. SHAREHOLDERS FUNDS Consists of equity share capital, preference share capital, capital reserves, revenue reserves and reserves representing accumulated profits and surpluses like reserve for contingencies sinking funds. The accumulated losses and deferred expenses, if any should be deducted from the total to find out shareholders’ funds, it is called net worth and the ratio may be termed as debt to net worth ratio. PROPRIETARY RATIO OR NET WORTH RATIO It establishes relationship between the proprietors fund or shareholders’ funds and the total assets Proprietary funds Capital employed Proprietary ratio= or Total assets Total liabilities IDEAL RATIO: 0.5:1 Higher the ratio betters the long term solvency (financial) position of the company. This ratio
  • 12. 12 indicates the extent to which the assets of the company can be lost without affecting the interest of the creditors of the company COMPONENTS OF PROPRIETARY RATIO: SHAREHOLDERS FUNDS OR PROPRIETARY FUNDS Are equity share capital, preference share capital, undistributed profits, reserves and surpluses. Out of this amount accumulated losses should be deducted. TOTAL ASSETS On other hand denote total resources of the concern SOLVENCY RATIO It expresses the relationship between total assets and total liabilities of a business. This ratio is a small variant of equity ratio and can be simply calculated as 100-equity ratio Total assets Solvency ratio= Total liabilities No standard ratio is fixed in this regard. It may be compared with similar, such organizations to evaluate the solvency position. Higher the solvency ratio, the stronger is its financial position and vice-versa FIXED ASSETS TO NET WORTH It is obtained by dividing the depreciated book value of fixed assets by the amount of proprietor’s funds. Net fixed assets Fixed assets to net worth ratio= Net worth IDEAL RATIO: 0.75:1 A higher ratio, say, 100% means that there are no outside liabilities and all the funds employed are those of shareholders. In such a case the return to shareholders would be lower rate of dividend and this is also a sign of over capitalization.  This ratio shows the extent to which ownership funds are sunk into assets with relatively low turnover. When the amount of proprietor's funds exceed the value of fixed assets, a part of the net working capital is provided by the shareholders, provided there are no other non-current assets, and when proprietor’s funds are less than the fixed assets, creditors obligation have been used to finance a part of fixed assets. The Yardstick for this measure is 65% for industrial undertakings. CURRENT ASSETS TO NET WORTH RATIO It is obtained by dividing the value of current assets by the amount of proprietor’s funds. The purpose of this ratio is to show the percentage of proprietor’s fund investment in current assets.
  • 13. 13 Current assets Current assets to net worth ratio= Proprietor’s fund A higher proportion of current assets to proprietor’s fund, as compared with the proportion of fixed assets to proprietor’s funds are advocated, as it is an indicator of the financial strength of the business, depending on the nature of the business there may be different ratios for different firms. This ratio must be read along with the results of fixed assets to proprietor’s funds ratio CURRENT LIABILITIES TO NET WORTH It is expressed as a proportion and is obtained by dividing current liabilities by proprietor's fund Current liabilities Current liabilities to net worth ratio= Net worth IDEAL RATIO: 1:3 This ratio indicates the relative contribution of short term creditors and owners to the capital of an enterprise. If the ratio is high, it means it is difficult to obtain long term funds by the business. CAPITAL GEARING RATIO It expresses the relationship between equity capital and fixed interest bearing securities and fixed dividend bearing shares. Fixed interest bearing securities + fixed dividend Bearing shares CGR= Equity shareholders’ funds INTERPRETATION OF CAPITAL GEARING RATIO  When fixed interest bearing securities and fixed dividend bearing shares are higher than equity shareholders’ funds, the company is said to be ‘highly geared’.  Where the fixed interest hearing securities and fixed dividend bearing shares share equal to equity share capital it is said to be ‘evenly geared’.  When the fixed interest bearing securities and fixed dividend bearing shares are lower than equity share capital it is said to be ‘low geared’.  If capital gearing is high, further raising of long term loans may be difficult and issue of equity shares may be attractive and vice-versa FIXED ASSETS RATIO It establishes the relationship between fixed assets and capital employed Fixed assets Fixed assets ratio= Capital employed
  • 14. 14 IDEAL RATIO: 0.67:1 This ratio enables to know how fixed assets are financed i.e. by use of short term funds or by long term funds. This ratio should not be more than 1. COMPONENTS OF CAPITAL EMPLOYED: 1. Owners funds, 2.Long-term loans, 3.Long-term deposits, 4.debentures. FIXED CHARGES COVER OR DEBT SERVICE RATIO This ratio is determined by dividing net profit by fixed interest charges Net profit before deduction of interest And income tax Debt service ratio= Fixed interest charges IDEAL RATIO: 6 OR 7 TIMES; If the ratio is high it means there is higher margin of safety for the long term lenders and as such it is not difficult for the business to obtain further long term funds and vice-versa. This ratio indicates the financial ability of the enterprise to meet interest payment out of current earnings DIVIDEND COVER RATIO It is the ratio between disposable profit and dividend. Disposable profit refers to profit left over after paying interest on long term borrowing and income tax. Net profit after interest and tax Dividend cover ratio= Dividend declared This ratio indicates the ability of the business to maintain the dividend on shares in future. If this ratio is higher is indicates that there is sufficient amount of retained profit. Even if there is slight decrease in profit in the future it will not affect payment of dividend in future ACTIVITY RATIO  Activity ratios indicate the performance of an organization.  This indicates the effective utilization of the various assets of the organization.  Most of the ratio falling under this category is based on turnover and hence these ratios are called as turnover ratios. IMPORTANT RATIOS IN ACTIVITY RATIO  Stock turnover ratio.  Debtor’s turnover ratio.  Creditor’s turnover ratio.  Wording capital turnover ratio.  Fixed assets turnover ratio.  Current assets turnover ratio.
  • 15. 15  Total assets turnover ratio.  Sales to net worth ratio. STOCK TURNOVER RATIO This ratio establishes the relationship between the cost of goods sold during a given period and the average sock holding during that period. It tells us as to how many times stock has turned over (sold) during the period. Indicates operational and marketing efficiency. Helps in evaluating inventory policy to avoid over stocking. Cost of goods sold Inventory turnover ratio= Average stock Cost of goods sold= sales-gross profit = opening stock + purchases – closing stock Opening stock + Closing stock Average stock= 2 INTERPRETATION OF STOCK TURNOVER RATIO  IDEAL RATIO: 8 TIMES; a low inventory turnover may reflect dull business, over investment in inventory, accumulation of stock and excessive quantities of certain inventory items in relation to immediate requirements.  A high ratio may not be accompanied by a relatively high net income as; profits may be sacrificed in obtaining a large sales volume (unless accompanied by a larger total gross profit). It may indicate under investment in inventories. But generally, a high stock turnover ratio means that the concern is efficient and hence it sells its goods quickly. DEBTOR TURNOVER RATIO This ratio explains the relationship of net credit sales of a firm to its book debts indicating the rate at which cash is generated by turnover of receivables or debtors. The purpose of this ratio is to measure the liquidity of the receivables or to find out the period over which receivables remain uncollected. Net credit sales Debtor turnover ratio= Average Debtors Opening balance + closing balance Average debtors= 2 Debtors include bills receivables along with book debts When information about opening and closing balances of trade debtors is not available then the debtor turnover ratio can be calculated by dividing the total sales by the balances of debtors Debtor turnover ratio = total sales/debtors
  • 16. 16 AVERAGE COLLECTION PERIOD The average collection period represents the average number of days for which a firm has to wait before its receivables are converted into cash Number of working day in year Average collection period= Debtor turnover ratio INTERPRETATION OF DEBTOR TURNOVER RATIO  IDEAL RATIO: 10 TO 12 TIMES; debt collection period of 30 to 36 days is considered ideal.  A high debtor turnover ratio or low collection period is indicative of sound management policy.  The amount of trade debtors at the end of period should not exceed a reasonable proportion of net sales. Larger the trade debtors greater the expenses of collection. CREDITORS TURNOVER RATIO This ratio indicates the number of times the creditors are paid in a year. It is useful for creditors in finding out how much time the firm is likely to take in repaying its trade creditors. Net credit purchases Creditors turnover ratio= Average creditors Opening balance + closing balance Average creditors= 2 Number of working days Average payment period= Creditor’s turnover ratio If information about credit purchases is not available, total purchases may be taken; if opening and closing balances of creditors are not given the balances of creditors may be taken. Trade creditors include sundry creditors and bills payable. INTERPRETATION OF CREDITOR TURNOVER RATIO  IDEAL RATIO: 12 TIMES; debt payment period of 30 days is considered ideal.  Very less creditor’s turnover ratio or a high debt payment period may indicate the firm’s inability in meeting its obligation in time. WORKING CAPITAL TURNOVER RATIO This ratio indicates the number of times the working capital is turned over in the course of the year. Measures efficiency in working capital usage. It establishes relationship between cost of sales and working capital.
  • 17. 17 Cost of sales Working capital turnover ratio= Average working capital Opening + closing working capital Average working capital= 2 If cost of sales is not given, then sales can be used. If opening working capital is not disclosed then working capital at the year-end will be used. Working capital turnover ratio= cost of sales (sales)/net working capital. INTERPRETATION OF WORKING CAPITAL TURNOVER RATIO  A higher ratio indicates efficient utilization of working capital and a low ratio indicates inefficient utilization of working capital.  But a very high ratio is not a good situation for any firm and hence care must be taken while interpreting the ratio. FIXED ASSETS TURNOVER RATIO This ratio establishes a relationship between fixed assets and sales. Net sales Fixed assets turnover ratio= Fixed assets IDEAL RATIO: 5 TIMES A high ratio indicates better utilization of fixed assets. A low ratio indicates underutilization of fixed assets. TOTAL ASSET TURNOVER RATIO This ratio establishes a relationship between total assets and sales. This ratio enables to know the efficient utilization of total assets of a business Net sales Total assets turnover ratio= Total assets IDEAL RATIO: 2 TIMES High ratio indicates efficient utilization and ratio less than 2 indicates under utilization PROFITABILITY RATIO  Profitability ratios indicate the profit earning capacity of a business.  Profitability ratios are calculated either in relation to sales or in relation to investments.  Profitability ratios can be classified into two categories. a) General Profitability Ratios. b) Overall Profitability Ratios. GENERAL PROFITABILITY RATIOS  Gross profit ratio.  Net profit ratio.
  • 18. 18  Operating ratio.  Operating profit ratio.  Expense ratio. GROSS PROFIT RATIO It expresses the relationship of gross profit to net sales and is expressed in terms of percentage. This ratio is a tool that indicates the degree to which selling price of goods per unit may decline without resulting in losses. Gross profit Gross profit ratio= X 100 Net sales A low gross profit ratio may indicate unfavorable purchasing, the instability of management to develop sales volume thereby making it impossible to buy goods in large volume. Higher the gross profit ratio betters the results. NET PROFIT RATIO It expresses the relationship between net profits after taxes to sales. Measure of overall profitability useful to proprietors, as it gibes an idea of the efficiency as well as profitability of the business to a limited extent. Net profit after taxes Net profit ratio= X 100 Net sales Higher the ratio better is the profitability Generally non-operating incomes and expenses are excluded from the net profits for calculating this ratio OPERATING RATIO This ratio establishes a relationship between cost of goods sold plus other operating expenses and net sales. This ratio is calculated mainly to ascertain the operational efficiency of the management in their business operations. Cost of goods sold + operating expenses Operating ratio= Net sales Higher the ratio the less favorable it is because it would leave a smaller margin to meet interest, dividend and other corporate needs. For a manufacturing concern it is expected to touch a percentage of 75% to 85%. This ratio is partial index of overall profitability. OPERATING PROFIT RATIO This ratio establishes the relationship between operation profit and net sales. Operating profit Operating profit ratio= X 100 Net sales Operating profit ratio= 100-operating ratio
  • 19. 19 Operating profit= Net sales – (cost of goods sold + Administrative and office expenses + selling and distributive expenses. EXPENSES RATIO It establishes relationship between individual operation expenses and net sales revenue. Cost of goods sold 1. Cost of goods sold ratio= X 100 Net sales Office and admin exp. 2. Admin. And office exp. ratio= X100 Net sales Selling and dist. Exp. 3. Selling and distribution ratio= X 100 Net sales Non-operating expense 4. Non-operating expense ratio= X 100 Net sales TEST OF OVERALL PROFITABILITY  Return on shareholders’ investment or Net worth ratio.  Return on equity capital.  Return on capital employed.  Return on total resources.  Dividend yield ratio.  Preference dividend cover ratio.  Equity dividend cover ratio.  Price covering ratio.  Dividend payout ratio.  Earnings per share. RETURN ON SHAREHOLDERS INVESTMENT Shareholders’ investment also called return on proprietor’s funds is the ratio of net profit to proprietor’s funds. It is calculated by the prospective investor in the business to find out whether the investment would be worth-making in terms of return as compared to the risk involved in the business. Net profit (After tax and int) Return on shareholders’ investment= Proprietor’s funds  This ratio is of great importance to the present and prospective shareholders as well as the management of the company. As this ratio reveals how well the resources of a firm are being used, higher the ratio, better are the results. The return on shareholders’ investment should be compared with the return of other similar firms in the same industry. The inter
  • 20. 20 firm comparison of this ratio determines whether their investments in the firm are attractive or not as the investors would like to invest only where their return is higher. Similarly, trend ratios can also be calculated for a number of years to get5 and idea of the prosperity, growth of deterioration in the company’s profitability and efficiency. RETURN ON EQUITY CAPITAL This ratio establishes the relationship between net profit available to equity shareholders and the amount of capital invested by them. It is used to compare the performance of company's equity capital with those of other companies, and thus help the investor in choosing a company with higher return on equity capital. Net profit – preference dividend Return on equity capital= Equity share capital (paid up) RETURN ON CAPITAL EMPLOYED This ratio is the most appropriate indicator of the earning power of the capital employed in the business. It also acts as a pointer to the management showing the progress or deterioration in the earning capacity and efficiency of the business. Net profit before taxes and Interest on long – term loans and debentures Return on capital employed= Capital employed IDEAL RATIO: 15% If the actual ratio is equal ratio is equal to or above 15% it indicates higher productivity of the capital employed and vice versa Proprietors net capital employed = fixed assets + current assets – outside liabilities (both long and short term) Significance of the ratio: 1. It is a prime test of the efficiency of business. It measures not only the overall efficiency of business but also helps in evaluating the performance of various departments. 2. The owners are interested in knowing the profitability of the business in relation to amounts invested in it. A higher percentage of return on capital employed will satisfy the owners that their money is profitably utilized. RETURN OF TOTAL RESOURCES This ratio acts as a yardstick to assess the efficiency of the efficiency of the operations of the business as it indicates the extent to which assets employed in the business are utilized to results in net profit Net profit Return on total recourses = X 100 Total assets
  • 21. 21 DIVIDEND YIELD RATIO It refers to the percentage or ratio of dividend paid per share to the market price per share. This ratio throws light on the effective rate of return on investment, which potential investors may hope to earn Dividend paid per equity share Dividend yield ratio = Market price per equity share PREFERENCE DIVIDEND COVER It indicates how many times the preference dividend is covered by profits after tax. This ratio measures the margin of safety for preference shareholders. Such investors normally expect their dividend to be covered about 3 times by profits available for dividend purpose. Profit after tax Preference dividend cover = Annual programmer dividend EQUITY DIVIDEND COVER This ratio indicates the number of times the dividend is covered by the amount of profit available for equity shareholders Net profit after tax - pref. dividend Equity dividend cover = Dividend paid on equity capital Earning per equity share = Dividend per equity share IDEAL RATIO: 2 TIMES; i.e. for every Rs. 100 profits available for dividend, Rs. 50 is retained in the business and Rs. 50 is distributed. Higher the ratio higher is extent of retained earnings and higher is the degree of certainty that dividend will be repeated in future PRICE EARNING RATIO It shows how many times the annual earnings the present shareholders are willing to pay to get a share. This ratio helps investors to know the effect of earnings per share on the market price of the share. This ratio when calculated for several years can be used as term analysis for predicting future price earnings ratios and therefore, future stock prices. Average market price per share Price earnings ratio= Earnings per share DIVIDEND PAY OUT RATIO This ratio indicates the proportion of earnings available which equity share holders actually Receive in the form of dividend. Dividend paid per share
  • 22. 22 Payout ratio = Earnings per share An investor primarily interested should invest in equity share of a company with high payout ratio. A company having low payout ratio need not necessarily be a bad company. A company having income may like to finance expansion out of the income, thus low payout ratio. Investor interested in stock price appreciation may well invest in such a company though the payout ratio is low. EARNING PER SHARE This ratio indicates the earning per equity share. It establishes the relationship between net profit available for equity shareholders and the number of equity shares. Net profit available for equity share holders Earnings per share = Number of equity shares
  • 23. 23 CHAPTER-2 COMPANY PROFILE BRIEF HISTORY Mark Exhaust Systems Limited was incorporated in 1993. Through our technical collaborations, innate manufacturing prowess and quality processes, we are today a leader in the auto components manufacturing industry. Our journey began as a joint venture with Maruti Udyog Limited to be a 1st tier supplier of exhaust systems, door sash and other sheet metal assemblies. By virtue of this association with the largest car manufacturer in India, we were given access to one of the leading and latest reservoirs of technology. Subsequently, to expand our technical prowess, we entered into collaboration with M/s Sankei of Japan, a leading manufacturer of exhaust systems and catalytic converters for Maruti Suzuki. This relationship was then further extended to include the manufacturing of door sash, which is a critical sheet metal part requiring a high degree of accuracy and precision. In order to further enhance our expertise in the metal forming, bending and surface finishing technologies, we formed collaboration with M/s. Dongwon, Korea. A licensing agreement with M/S Futaba of Japan provided us with expertise for the manufacture of Maniverter or Euro 3 Catalytic Converter for emission systems for Maruti, one of our principal customers. With these strategically planned collaborations, we have realized our potential to become an end- to-end auto components manufacturing solution provider. Our knowledge, expertise and experience are now propelling our growth into other business areas such as the infrastructure segment in India. Mark Exhaust will be developing and delivering products such as impact rails, steel framing systems, purlin lines for the construction of ports, railways, bridges and roads. A Chronological Overview: 1993: Mark Exhaust came into existence 1994: Technical collaboration with M/s SANKEI GIKEN KOGYO CO. LTD. Japan 1996: Production commenced for Maruti Udyog Ltd. (for Zen & Esteem Models) 1996: Production commenced for exports. 1998: QS 9000 Certification from DNV, Netherlands 1999: Supply started to Honda Siel Cars (City Model) 1999: Supply started to Hindustan Motors (Lancer Model) 2000: Supply started to LML Ltd. (4 Stroke 2 Wheelers) 2001: Supply started to Maruti Udyog Ltd. (for Door Sashes for Alto Model) from the new plant 2002: Supply started to Honda Scooter & Motor Cycle (4 Stroke 2 Wheelers)
  • 24. 24 2003: Received ISO 14001 Environmental certification 2004: Collaboration with M/s Dongwon, Korea 2005: License Agreement with Futaba, Japan for Maniverter or (Euro 3 Catalytic Converter) 2006: Supply started to Piaggio, Italy (Scooter) 2007: Foray into the infrastructure industry 2008: License agreement with Futaba Japan to manufacture Exhaust Systems 2009: Supply started to FMI ABOUT MARK EXHAUST Mark Exhaust is a leading manufacturer and global supplier of automobile components. As a progressive company we are defined by our stable lineage, consistent financial growth, quality reputation and customer orientation. Mark Exhaust is today an end to end auto components solution provider. We work with an impressive list of clients which includes both leading auto companies in India and Europe. By capitalizing on our in-house strengths, we have successfully nurtured relationships with many European OEM and aftermarket leaders. An initiative to provide warehousing and assembly facilities in the UAE further cements our position as an exporter. This helps reduce logistical constraints and allows for reduced lead time which enables our customers to have a more flexible ordering schedule. Our journey to success has been realized through our strategic technical collaborations, our manufacturing prowess, customer orientation and quality delivery. ABOUT MARK EXHAUST » FINANCIAL GROWTH The Mark Exhaust Group has seen rapid and consistent growth. Today we have revenues of Rs. 500 crores, over 700 employees and state-of-the-art manufacturing plants to cater to a growing local and global customer base. Our revenues have grown steadily and they have doubled in the last three years. With a CAGR of 26%, we have maintained a growth rate that is double of the industry average. ABOUT MARK EXHAUST » AWARDS
  • 25. 25 Mark Exhaust's quality, cost efficiency and customer focus efforts have been recognized by the awards we have received from our customers and partners. ABOUT MARK EXHAUST » PEOPLE A COMMITTED WORKFORCE At the heart of Mark Exhaust's success stand our talented employees who are guided by an unwavering commitment to our customers. Our relationship with employees is based on mutual Maruti Udyog Ltd. For an outstanding overall Performance during 2002- 2003 Maruti Suzuki Vendor Performance Award 2005- 2006 Maruti Suzuki Appreciates their participation in Maruti Suzuki Vendor Conference Honda Motorcycle & Scooter India Ltd. Supplier Award for Challenge India Support 2002- 2003 Honda Siel Cars India Ltd. For achieving the Bronze Award in the category of Delivery Honda Siel Cars India Ltd. Supplier Award 2001 Gold Award for Cost
  • 26. 26 trust and respect. Our culture is one of teamwork, honesty, integrity, respect and transparent communication that have played a pivotal role in the development of win-win relationships. Our group’s employee strength stands at 155 engineers, 135 white collared associates and 1360 blue collared associates. ABOUT MARK EXHAUST » QUALITY While there are many reasons for Mark Exhaust's success, the most significant among them is our strong focus and commitment to quality. Product quality is at the centre of our brand promise. In order to achieve this, quality permeates all aspects of our business - right from our investments in quality equipment and machinery, to training programs for our employees that enhances their work quality to the high quality of our premises and facilities. Our quality management systems have been acknowledged by DNV, NORWAY in the form of TS 16949 & ISO-14001 certifications. VISION & MISSION Mark Exhaust's mission and vision serve as a constant guiding light to help us on our path of growth. MISSION STATEMENT: At Mark Exhaust we strive to be one of the major automobile component manufacturers in India and to become a preferred choice of all the major two wheeler and four wheeler customers in India and overseas. VISION STATEMENT: Mark Exhaust is committed to achieving global standards of quality, cost, delivery, environmental control, productivity, efficiency and customer satisfaction. To achieve its vision, the company will synergize its collective resources and capabilities of product designing, creativity, innovation and work practices involving its employees at all levels. POLICY The articulation of the quality, safety and environment policy demonstrates our intention, direction and aim in these critical areas. QUALITY POLICY: All employees will strive to achieve total customer satisfaction by the timely delivery of products at competitive prices, while conforming to international standards achieved through continuous improvement with an eye on safety, wastage and environment care. SAFETY POLICY:
  • 27. 27 Our safety policy aims to create and promote a culture that focuses on the safety and health of employees. We do this by: • Ensuring compliance with all applicable legislative requirements • Empowering employees to ensure safety in their respective work places • Promoting safety and health awareness amongst employees, suppliers and contractors • Continuous improvement in safety performance through awareness, participation and training of employees. ENVIRONMENT POLICY: Our environmental aims and objectives are to: • Set environmental objectives and targets • continually improve and maintain high levels of operational and technical performance • Reduce and/or prevent pollution, minimize wastage of resources • Comply with legal and regulatory requirements CODE OF CONDUCT: The code of conduct serves as a guide for our daily business interactions, reflecting our standards for proper behavior and our corporate values. IN OUR RELATIONSHIPS WITH EACH OTHER, WE STRIVE TO: Have successful working relationships Promote open and honest communications Value people as our greatest resource IN OUR DEALINGS WITH OUTSIDE BUSINESS ENTITIES, WE STRIVE TO: Deal ethically with suppliers and customers Not give or accept inappropriate gifts Respect the trade secrets and confidential information of others IN OUR DEALINGS WITH OUR CUSTOMERS, WE STRIVE TO: Set highest standards for our products Be responsive to our customers IN OUR DEALING WITH THE GOVERNMENT AND THE LAW, WE STRIVE TO: Comply with regulatory compliance, monitoring and reporting Political non-alignment Deal ethically with government and its representatives Preserve records according to the law IN OUR DEALINGS WITH SOCIETY, WE STRIVE TO: Oppose exploitative, inhumane labor practices
  • 28. 28 Safeguard and protect the environment IN OUR RELATIONSHIP WITH SHAREHOLDERS, WE STRIVE TO: Practice good corporate governance to protect shareholder value Maintain strong audit programs to increase interest and confidence Keep shareholders informed about the company and other developments MD'S MESSAGE From Mr. Rattan Kapur's Desk: It is my pleasure to welcome you to Mark Exhaust's Web site. The Indian automobile industry has metamorphosed into a great industry since the first car ran on the streets of Bombay in 1898. It is today the tenth largest in the world. While the industry is faced with a recession today, the Asia market and in particular the India story has been somewhat different. India is one of Asia's largest car markets and is the second largest manufacturer of two wheelers. The number of cars sold domestically is projected to treble by 2015. Global auto majors are increasingly seeing India as a manufacturing hub for auto components and are increasing the volume of components they source from India due to its cost competitiveness in terms of labor and raw material. According to the Automotive Component Manufacturers' Association of India (ACMA), the domestic Indian auto component manufacturing industry is heading for a whopping 18% growth in the coming years. The turnover of the auto component industry was estimated at over US$ 18 billion in 2007-08 and it is likely to touch US$ 40 billion by 2015-16. Owing to India's rapid economic growth, improved infrastructure and higher disposable incomes the success story of the Indian automobile industry is just beginning! It is in this context that Mark Exhaust's success is played out. We are a leading manufacturer of exhaust systems, catalytic converters and door sash assemblies in the country. At the heart of our success lies our commitment to quality that makes our customers successful. Our commitment to quality means paying absolute attention to our customers by making sure that we deliver on their expectations. Quality is essential to the integrity of our brand and to maintaining our customers' trust. Key to our success is also our partnerships with leading companies in auto manufacturing. Our partnership with M/S Futaba of Japan, M/s Sankei Industry Co. M/S Klarius of UK and IAV of Germany has helped strengthen our technical capabilities and ensure that we remain at the cutting edge of technology. While our key focus is the manufacturing of auto components, Mark Exhaust recognizes its responsibility of being a citizen of the world. With the growth expected in the automotive industry, concerns about an increase in the number of vehicles and their emissions and its resultant effects on global warming are high. We respond by caring for our environment through
  • 29. 29 conscious policies and management systems that attempt to minimize smoke emissions, promote harvesting, water collection and hard water treatment; while our exhaust systems are designed to be efficient in their use of energy and contain environmentally preferable solutions. Our knowledge, experience and success of over two decades in the auto components manufacturing industry are today propelling our growth in the infrastructure industry. Supported by our manufacturing prowess and customer orientation, we will be developing and delivering products such as impact rails, steel framing systems and purlin lines for the construction of ports, railways, bridges and roads. The driving force responsible for our growth and industry recognition is our committed workforce and responsible management. Our leadership status and respect in the industry is a testament to their determination and hard work. We recognize the invaluable contribution of this dedicated team and are focused on offering our employees exceptional opportunities for professional and personal development. I am confident that with our highly skilled work force and our focus on critical areas of competitiveness, constant improvement, quality and prompt delivery will continue to fuel our success to even greater heights. Thank you for partnering with us and for being a part of Mark Exhaust. Rattan Kapur Chairman & Managing Director, Mark Exhaust Systems Ltd. BOARD OF DIRECTORS Mark Exhaust is currently managed by a Board of Directors which oversees the activities of the company. The Board comprises of the following persons: BOARD OF DIRECTORS Mr. Rattan Kapur -Chairman & Managing Director Mr. Rohan Kapur -Executive Director Mr. Hiroshi Sakamoto -Director Maruti Representative Mr. S. Natarajan -Director Independent Professional Mr. K. T. S. Tulsi -Director Independent Professional Mr. M. M. Singh -Director Maruti Representative Mr. Sandeep Chandhok -Director CAREER OPPORTUNITIES
  • 30. 30 You can build a career with a company that's setting the pace for more than 16 years; Mark Exhaust has been setting and raising the bar in the auto components manufacturing industry. As we grow both in India and globally and diversify into new business areas, we have a steady need for ambitious and focused individuals who are looking for a professional work environment that will foster their growth and help them to perform to their potential. You'll discover real growth opportunities we believe that our employees are our core asset and we are committed to their growth and development. We encourage our employees to develop new skills through specialized training programs that help them to be aware and updated on the best practices around the globe. Mark Exhaust offers its employees in-house training programs and encourages cross functional teams at different levels to enhance employee knowledge and competencies through customized programs. Our relationship with employees is based on mutual trust and respect. Our culture is one of teamwork, honesty, integrity, respect and transparent communication that have played a pivotal role in the development of win-win relationships. CAREERS » APPLY NOW Apply today: Mark Exhaust provides a challenging and empowered workplace for professionals in the field of production engineering, design engineering and manufacturing. Please submit your resume online by writing to us at info@markexhaust.com CAREERS » CORPORATE RESOURCES The Corporate Resource section is designed to give you access to relevant information quickly and easily. http://www.markexhaust.com/app/webroot/cr/markexhaust.pdf http://www.markexhaust.com/app/webroot/cr/MESLBroucher.pdf BUSINESS AREAS Mark Exhaust Systems is a leading manufacturer and global supplier of automobile components. As a progressive leader, we are defined by our stable lineage, consistent financial growth, quality reputation and customer orientation. Mark Exhaust is today a complete auto components manufacturing solution provider. We work with an impressive list of clients which includes both leading auto companies in India and Europe. By capitalizing on its in-house strengths, Mark Exhaust has successfully nurtured relationships with many European OEM and aftermarket leaders. An initiative to provide warehousing and assembly facilities in the UAE further cements its position as an exporter. Our journey has been realized through our strategic technical collaborations, our manufacturing
  • 31. 31 prowess, customer orientation and quality delivery. AUTOMOBILES The Indian automobile industry is the 10th largest in the world. The industry is poised for growth with the projection of the number of cars sold in India expected to double by 2010. The Indian auto component manufacturing industry is also headed for a whopping 18% growth in the coming years. Global auto majors are increasingly seeing India as a manufacturing hub for auto components and are rapidly increasing the amounts of components they source from India due to their cost competitiveness in terms of labor and raw material. Mark Exhaust is a leading auto components solution provider with an impressive list of clients which includes both leading auto companies in India and Europe. OUR PRODUCTS INCLUDE: • 2 Wheeler Exhaust • Fitting Kits & Flanges • 4 Wheeler Exhaust • Replacement Cats for European Market • Door Sash • Stationery Engine Exhausts • Stampings • Brake Pads • Welded Assemblies • Machined Components • 2 Wheeler Frame Parts • Sliding Door Assembly • Exhaust Manifold • Tubular Assembly INFRASTRUCTURE India is building its future. Infrastructure construction that covers ports, railways, bridges and roads is expected to be robust in the coming years. Mark Exhaust has leveraged its expertise in rolling complex sections in the Auto Industry coupled with our discipline of customer delivery and satisfaction, quality and a culture of development to provide products to the growing infrastructure industry. Our products include: • Impact beams:
  • 32. 32 COMMITMENT TO BUSINESSES Since our inception our business focus has been to deliver competitive technology solutions for our clients in the auto industry. Over the years we have built a formidable reputation as the supplier of choice for leading brands, both, in India and globally. A deep emphasis on quality management and creating a skilled workforce, which today has grown to over 700 people has helped us in building strong and long lasting customer relationships. Today we are a company that holds tremendous promise for future growth. The company has grown in the field of design, engineering and production technology with an ingrained culture of continuous improvement. Our R&D and testing facilities are world class. COMMITMENT TO BUSINESSES » QUALITY Mark Exhaust is deeply committed to meeting the highest industry quality standards – both for processes and products- while improving cost efficiency, delivering measurable value and manufacturing high quality products that are environment friendly. In order to continuously improve quality performance Mark Exhaust has developed standard quality management systems which have been acknowledged by DNV, NETHERLANDS in the form of TS 16949 & ISO- 14001 certifications. Some of the quality practices like 5-S, Kaizen, Quality Circles and Cross Functional Teams are a way of life at Mark Exhaust. For us, 'quality is built-in within our processes', and is ultimately the genesis of our successful track record with customers. To continuously improve upon the quality of our processes, we have championed the training of Systems Professionals. In order to improve product quality standards and practices, we focus on and consistently train our associates in Poke Yoke, 5S, Why Why Analysis and Fishbone Analysis. COMMITMENT TO BUSINESSES » MANUFACTURING
  • 33. 33 Mark Exhaust has highly advanced and appropriately designed manufacturing facilities. As a sheet metal components manufacturing company, we specialize in welded assemblies. Our confidence to deliver to an international customer base and satisfy their product requirement rests on our investments in equipment like power presses up to 300t (hydraulic and mechanical), welding solutions (manual, SPMs, robots), tube benders, CnC machining centres, rolling mills and stretch benders. Our in house paint shops and ED solutions help us in delivering a complete product. Our maintenance levels for all these sophisticated equipment’s are equally high. Our in house maintenance teams provide 24/7 resolution to any mechanical or electrical problem that may arise during the manufacturing process. We are focused on using world class electrical equipment’s for our servers and drives and share harmonious relationships with world leaders like Miachi, Tayo, Siemens, Philips etc. we follow the single piece flow and cellular manufacturing system thus ensuring the highest levels of efficiency in the production process. Our manufacturing facilities are equipped to customize solutions for our customers ensuring that unique requirements are met. OUR CURRENT MANUFACTURING EXPERTISE INCLUDES: 1. EXHAUST MANUFACTURING • Swiss Roll or multi spot welding technology • A Lock Seam manufacturing line TOP
  • 34. 34 • Automatic material feeding system based on advanced Japanese technology for making mufflers complete with baffle stuffing and end seaming. • Catering to the different segments within the automotive and infrastructure industries with a production capacity of over 1 million exhaust shells per annum. 2. DOOR SASH MANUFACTURING • High degree of accuracy in various fields of metal forming. • Modern line equipment’s from Japan and Korea with capabilities of roll forming, bending, robotized welding and power presses in the door sash manufacturing process TOP • Exposure for the development of other rolled formed components such as chassis, guard rails and bumper reinforcement among others 3. PAINT SHOP
  • 35. 35 • Equipped with a Modern Converorized Paint shop for painting mufflers with heat resistant paint • In this process, shot blasting is followed by wet electrostatic liquid painting • Heat resistant paints up to temperatures of 550 degrees C is possible TOP 4. PIPE BENDING • Line up of sophisticated 3 axis CNC pipe bending machines from M/s Addisson of UK, YLM and Taiwan for design oriented quality 5. WELDING • Fully robotized welding SPM (special purpose machines) provide a decisive edge in achieving high finish standards and enhanced product capability
  • 36. 36 6. PRESS SHOP • We specialize in both MS and SS stampings with press capacities ranging from 10 t to 300 t, with an in-house press shop backed by experienced associates specializing in dye and tool maintenance COMMITMENT TO BUSINESSES » RESEARCH & DEVELOPMENT Research and development (R&D) forms the backbone of Mark Exhaust's delivery and lends to our competitiveness in the industry on a global level. Our capabilities include: • Developing original designs and analyses • Material research & development • Testing & validation by utilizing CAE systems and other virtual lab tools, we provide simulation such as NVH, CFD, FEA, Load, and Stress analysis. These simulations can be used to: • Predict fatigue hotspots and corresponding fatigue life which helps in optimizing component design for fatigue performance. • Predict fatigue life based upon realistic loading conditions. • Get immediate feedback on critical durability areas. • Explore multiple design options and optimize the design to performance requirements. Once the simulation stage is satisfactorily completed, we proceed to the prototyping stage where the prototypes are then put on test benches where they are checked for performance and fitment. By utilizing proto toolings and accessing validation centers from all over the world, we keep our development costs low. We share good working relationships with world renowned accreditation centers like ARAI, IDIADA, NATRIP, VCA etc. COMMITMENT TO BUSINESSES » TESTING LAB Mark Exhaust's testing lab is outfitted with the latest equipment to ensure quality testing procedures. This equipment is used to gauge, test and analyze the products, processes and materials used to ensure that our products meet the stringent quality standards that our customers demand of us. We continually invest in testing equipment that enhances our procedures for faster time-to- market. For our customers who operate in a highly competitive industry, faster time to market equals a competitive advantage in the market place. Some of these capabilities include: 1. the ultra-modern 3D Coordinate Measuring Machines (CMM) - a device for measuring the geometrical characteristics of an object. These part features cannot be measured with conventional hand tools. With this technology we have experienced leaps in our productivity.
  • 37. 37 2. A tube data scanning machine from M/s Addisons, UK is used for checking the profiles of tubes and pipes under development. 3. UTMs & hardness testers are used for measuring the hardness of metals. 4. A Millipore test is used to check products with sensitivity to a high level of contamination. COMMITMENT TO BUSINESSES » DESIGN ENGINEERING The company has invested in the latest in CAD technology that not only helps in designing products but also re-engineering them to meet specific client requirements. We effectively use design technology during the entire life cycle of a product, from the birth stage right up to assembly and manufacturing. By using the latest in CAD CAM software, we deliver 2D and 3D designing of welding / assembly jigs and fixtures. In order to have greater control on the manufacturing process, most of our special purpose machines (SPM) fixturing also has design input from our in-house design section. Once we receive the product tolerance report from our customer, we do reverse engineering to set sub component tolerances. This helps us control the dimensional variances which might take place within the manufacturing process. By designing the inputs to the manufacturing process in house, it helps us strengthen our commitment to the quality of the product and thereby the customer. COMMITMENT TO OUR PEOPLE The two pillars of Mark Exhaust's success are the technology we use and the people we work with. Mark Exhaust's market leadership is a testimony to the commitment and hard work of its employees. We are dedicated to nurturing and investing in our people. Apart from providing them with the best technology to work with and world-class facilities, we are focused on creating a favorable environment for their professional growth helping them acquire practical skills that add real value. COMMITMENT TO OUR PEOPLE » TRAINING Our people are our most important asset and we invest considerable resources to provide on- going training that builds and extends professional, technical and management skills in all areas. The training programs help our employees in being up to date with global best practices that are followed in the auto manufacturing industry. Our in-house training programs like 5-S, Quality circles and cross functional teams at different levels are aimed at enhancing their knowledge levels and competencies. The Personal Department creates a training calendar after identifying needs. These trainings are directed towards productivity improvement, quality improvement, maintenance improvement and general team building exercises.
  • 38. 38 COMMITMENT TO OUR PEOPLE » FACILITIES Mark Exhaust's facilities for employees are world-class. We are committed to providing a safe and healthy working environment for our employees. To ensure that employees are able to work efficiently, amenities such as a canteen and recreation rooms are available. On premise health care facilities offer first aid in case of an emergency. Commitment to Our people » People Practices Mark Exhaust makes a meaningful contribution in the personal lives of its employees. We sponsor the education of the children of our associates from the primary to college level. Further, our associates' children receive an annual subscription of a children's newspaper called Robin Age. Commitment to the Environment Mark Exhaust is an environmentally responsible company. While our main undertaking is to manufacture automobile products, we recognize our responsibility towards the industry and society at large. From our early days we have embraced the idea of the company being a key participant in contributing positively towards the environment. This care is
  • 39. 39 manifested in our endeavor to consciously plan policies and management systems which are aimed at minimizing the impact of our operations on the environment. AT MARK EXHAUST, OUR ENVIRONMENTAL AIMS AND OBJECTIVES ARE TO: - Define our environmental policy - Continually improve and maintain high levels of operational and technical performance - Reduce and/or prevent pollution, minimize wastage of resources - Comply with legal and regulatory requirements Mark Exhaust is the proud recipient of the ISO 14001 environmental management certification. This certification has been awarded to us owing to our commitment to continuous improvement and monitoring of all environmental impact areas including energy and water consumption, sewage discharge, airborne emissions, hazardous materials and noise levels which help to reduce the impact of our operations and provide a safer and healthier place to work. At Mark Exhaust we design our products to be efficient in their use of energy, to contain environmentally preferable solutions and be capable of being reused, recycled or disposed of safely at the end of their useful lives. We follow efficient processes and methodologies for manufacturing production and inventory control like Just in Time (JIT), KanBan Systems and Direct Online (DOL) which are designed to reduce our carbon footprint. As a commitment to the neighborhood in which we operate, Mark Exhaust has planted trees and created tube wells for the people who inhabit villages in that area. The articulation of the quality, safety and environment policy demonstrates our intention, direction and aim in these critical areas. QUALITY POLICY All employees will strive to achieve total customer satisfaction by the timely delivery of products at competitive prices, while conforming to international standards achieved through continuous improvement with an eye on safety, wastage and environment care. SAFETY POLICY Our safety policy aims to create and promote a culture that focuses on the safety and health of employees. We do this by: • Ensuring compliance with all applicable legislative requirements • Empowering employees to ensure safety in their respective work places
  • 40. 40 • Promoting safety and health awareness amongst employees, suppliers and contractors • Continuous improvement in safety performance through awareness, participation and training of employees ENVIRONMENT POLICY Our environmental aims and objectives are to: • Set environmental objectives and targets • Continually improve and maintain high levels of operational and technical performance • Reduce and/or prevent pollution, minimize wastage of resources • Comply with legal and regulatory requirements INFRASTRUCTURE PRODUCTS Impact beams C Purlin Impact beams Z Purlin Decking Standing Seam One Sheeting Profile INFRASTRUCTURE PRODUCTS > ROADWAYS Impact beams Impact beams INFRASTRUCTURE PRODUCTS > BUILDINGS C Purlin Z Purlin Decking Standing Seam One Sheeting Profile
  • 41. 41 AUTOMOTIVE PRODUCTS > OEM - 2 WHEELER 2W Exhaust 2W Frame Parts Machined Components 2W Exhaust 2W Frame Parts Machined Components 2W Exhaust Machined Components 2W Exhaust 2W Frame Parts Machined Components 2W Exhaust 2W Frame Parts 2W Exhaust 2W Frame Parts 2W Exhaust 2W Frame Parts AUTOMOTIVE PRODUCTS > OEM - 2 WHEELER > 2 WHEELER EXHAUST 2W Exhaust 2W Exhaust 2W Exhaust 2W Exhaust 2W Exhaust 2W Exhaust 2W Exhaust
  • 42. 42 AUTOMOTIVE PRODUCTS > OEM - 2 WHEELER > 2 WHEELER FRAME PARTS 2W Frame Parts 2W Frame Parts 2W Frame Parts 2W Frame Parts 2W Frame Parts 2W Frame Parts AUTOMOTIVE PRODUCTS > OEM - 2 WHEELER > MACHINED COMPONENTS Machined Components Machined Components Machined Components Machined Components AUTOMOTIVE PRODUCTS > OEM - 4 WHEELER AUTOMOTIVE PRODUCTS > OEM - 4 WHEELER > 4 WHEELER EXHAUST 4 Wheeler 4 Wheeler 4 Wheeler 4 Wheeler AUTOMOTIVE PRODUCTS > OEM - 4 WHEELER > DOOR SASH Door Sash Door Sash Door Sash Door Sash
  • 43. 43 Door Sash Door Sash Door Sash AUTOMOTIVE PRODUCTS > OEM - 4 WHEELER > STAMPINGS Stampings Stampings Stampings Stampings Stampings Stampings Stampings AUTOMOTIVE PRODUCTS > OEM - 4 WHEELER > WELDED ASSEMBLIES Welded Assy Welded Assy Welded Assy Welded Assy Welded Assy Welded Assy Welded Assy Welded Assy AUTOMOTIVE PRODUCTS > OEM - 4 WHEELER > EXHAUST MANIFOLD Manifold Manifold Catalytic Convertor Catalytic Convertor Catalytic Convertor Automotive Products > OEM - 4 Wheeler > Stationery Engine Exhausts Stationary Engine Exhaust
  • 44. 44 AUTOMOTIVE PRODUCTS > OEM - 4 WHEELER > SLIDING DOOR ASSEMBLY Sliding Door Assy Sliding Door Assy Sliding Door Assy Sliding Door Assy AUTOMOTIVE PRODUCTS > OEM - 4 WHEELER > TUBULAR ASSEMBLY Tubular Assy Tubular Assy Tubular Assy Tubular Assy Tubular Assy Tubular Assy AUTOMOTIVE PRODUCTS > AFTERMARKET AUTOMOTIVE PRODUCTS > AFTERMARKET > FITTING KITS & FLANGES Flanges Flanges Flanges Flanges Flanges Flanges Fitting Kits Fitting Kits Fitting Kits Fitting Kits Fitting Kits Fitting Kits Fitting Kits Fitting Kits Fitting Kits Fitting Kits
  • 45. 45 Fitting Kits (Clamps) AUTOMOTIVE PRODUCTS > AFTERMARKET > REPLACEMENT CATS Large Oval Cat Small Oval Cat Round Cat AUTOMOTIVE PRODUCTS > AFTERMARKET > BRAKE PADS Brake Pads Brake Pads Brake Pads Brake Pads Brake Pads more detail about Brake Pads PARTNERSHIPS As a leader in the auto components industry, Mark Exhaust is committed to delivering best-in- class products to its clients across the globe. Our consistent track record of delivering world class technology is evidence of our close working relationships with our partners. Mark Exhaust joins hands with the best known companies in the industry to leverage their technology expertise and global exposure. Our partners equip us with enhanced capabilities for servicing a global market. Mark Exhaust is proud of its partnerships. We share a common vision with our partners of excellence and sustainable growth that ensures our joint progress. Growth of our Partner Network:
  • 46. 46 1995: Mark Exhaust entered into a technical collaboration with M/s Sankei of Japan, a leading manufacturer of exhaust systems for producing Exhaust Systems and Catalytic Convertors for Maruti Suzuki. In the year 2001 Mark Exhaust furthered the relationship with M/s Sankei to commence manufacturing of the door sash - a critical sheet metal part requiring high degree of accuracy and precision. 2004: Mark Exhaust forged a partnership with M/s Dongwon, Korea. This partnership provided us with valuable exposure and experience in metal forming, bending and surface finishing technologies. 2005: Mark Exhaust entered into a License agreement with M/S Futaba of Japan for the manufacture of Maniverter or Euro 3 Catalytic Converter for our principal customer Maruti Udyog Limited; giving us the opportunity to become a full exhaust system solution provider. M/s Futuba M/s Futaba Industrial Co Ltd: Established in November 1945. The business focus for Futaba is manufacturing and sales of automobile and vehicle assembly parts, office equipment parts, jigs and welding machines. The company has since grown to nearly 8500 people. The company operates 7 factories spread across Japan. Futaba’s manufacturing network includes plants in Saga Prefecture, Iwate Prefecture and Aichi Prefecture (Anjo) in Japan, as well as in North America, China and South East Asia, creating a strong global presence. MESL's relationship has been strengthened with Futaba by working closely on the setup and smooth establishment of FMI Automotive Components Ltd. M/s Klarius Klarius Group is one of Europe's largest independently owned automotive manufacturing concerns. The Klarius Group has over 1,000 employees across Europe, with 3 production facilities, in the UK and Italy, distribution platforms: in the UK, France, Italy and Spain; and a research and development facility located in the UK. The technical centre has its own approved test track (the only parts manufacturer to have one) for undertaking type approval of parts. As well as supplying major companies in the aftermarket sector, Klarius also supplies OE manufacturers with exhausts for top marques, including all of the largest and most well recognized Italian super cars and bikes. MESL shares a cordial relationship with the renowned Klarius Group for the designing and testing of complete exhaust systems for the two wheeler and four wheeler industries. IAV GMBH
  • 47. 47 Employing over 3,000 staff across the globe, IAV is one of the leading providers of engineering services to the automotive industry. IAV's core competencies include powertrain, electronics and vehicle development. As a result, they can provide clients with production-ready solutions for the entire vehicle on a one-stop shop basis. IAV engages in its own primary research, performs its own advanced development activities and works on an interdisciplinary basis. Mark Exhaust Systems Limited tied up with IAV for the design and validation of four wheeler exhaust systems CUSTOMERS Mark Exhaust is proud of its client relationships. Maruti HMSIL HSCIL International Tractors Piaggio FMI Automotive Components International Cars & Motors CONTACT US Mark Exhaust Systems Limited 39/7, Begampur Khatola NH - 8 Delhi Jaipur Highway Gurgaon 122001 Tel : +91 124 4660400 Fax : +91 124 4031012 Email : info@markexhaust.com Contact Person : Mr. Brij Malhotra MANUFACTURING LOCATIONS
  • 48. 48 Mark Exhaust Systems Limited Village Begumpur Khatola, Delhi-Jaipur Highway, Gurgaon-122001 Mark Exhaust Systems Limited - Unit II Village Binola, Delhi-Jaipur Highway, Gurgaon-122413 Mark Exhaust Systems Limited - Unit III Plot # 101, Sector 08 IMT Manesar, Gurgaon-122050
  • 49. 49 CHAPTER-3 OBJECTIVE: The main objective of this report is to know about and analyze the financial strategies of the company, analyzing the current market and make possible recommendation about the company.  TO FINDING SHORT – TERM FINANCIAL VIABILITY OF COMPANY  TO FINDING LONG – TERM FINANCIAL VIABILITY OF COMPANY Note : These all objective set on base of (a) LIQUIDITY RATIO (b) SOLVENCY RATIO
  • 50. 50 CHAPTER-4 RESEARCH METHODOLOGY MEANING OF RESEARCH - Research in common meaning refers to a search for knowledge. If we define research properly then it would be like “It is a scientific and systematic search for pertinent information on a specific topic”. Still some people consider research as a Movement, the movement from known to unknown. All of us posses some amount of inquisitiveness in our self, and it is this inquisitiveness that make all of us to get known with the things which are unknown to us. Research is an academic activity, which help us to get familiar with the basic things of the findings and spread the knowledge so that all can be benefited from it. In short, the search for knowledge through objectives and systematic method of finding solution to a problem is research. The systematic approach concerning generalization and the formulation of a theory is also Research. The basic types of research work under which, we can be say our lie is: DESCRIPTIVE RESEARCH – This research includes surveys and fact findings enquiries of different kind. The basic purpose of this type of research is that it describes the state of affairs in current scenario. It is being generally used in social sciences and business research. The main characteristics of this method are that researcher has no control over the variables; he can only report what happened or what is happening. The method used in this type of research is survey methods including comparative and co relational methods. The need of data collection comes out after a research problem is being defined. While collecting data for the research or for the study, the researcher should keep in mind. DATA SOURCES - a) PRIMARY DATA b) SECONDARY DATA The Primary Data are those which are collected afresh and for the first time, and thus happen to be original in character. The Secondary Data, on the other hand, are those which have already been collected by someone else and which have already been passed through the statistical process. The researcher have to decide which sort of data he would be using for his/her study and accordingly he will have to select one or other method of data collection.
  • 51. 51 CHAPTER-5 DATA ANALYSIS & INTERPETATION By these sources I able to collect the data which is as follow:- FORMAL INFORMATION SOURCES– These are the sources of information which are authentic and reliable, obtained through a proper channel in the organization by adhering to a systematic and structured procedure. For Example: Through company manuals, journals, brochures and any other published material like balance sheets, annual reports, articles etc. .
  • 52. 52 TEST OF LIQUIDITY CURRENT RATIO OF MARK EXHUAST SYSTEM LIMITED YEAR’S CALCULATION 2016-2015 1.94 2015-2014 1.60 2014-2013 1.31 2013-2012 1.03 Notes: In The Current Ratio Result Was 1.94,1.60,1.31,1.03 Respective Years 2016,2015,2014,2013..Is Increasing Order And Ideal Ratio 2:1. It Means Current Ratio Is Favorable Condition Of The Mark Exhaust System Limited. 0 0.5 1 1.5 2 2.5 2016-15 2015-14 2014-13 2013-12 CURRENT RATIO CURRENT RATIO
  • 53. 53 QUICK RATIO OF MARK EXHUAST SYSTEM LIMITED YEAR’S CALCULATION 2016-2015 1.28 2015-2014 1.01 2014-2013 0.85 2013-2012 0.69 Notes: In The Quick Ratio Result Was 1.28,1.01,0.85,0.69 Respective Years 2016,2015,2014,2013.Its Also In Increaseing Order.The Ideal Ratio Of Quick Ratio Is 1:1.It Means Company Perform Favorable Condition In This Result. 0 0.2 0.4 0.6 0.8 1 1.2 1.4 2016-15 2015-14 2014-13 2013-12 QUICK RATIO QUICK RATIO
  • 54. 54 TEST OF SOLVENCY DEBT-EQUITY RATIO OF MARK EXHUAST SYSTEM LIMITED YEAR’S CALCULATION 2016-2015 2.12 2015-2014 2.01 2014-2013 1.53 2013-2012 0.84 Notes: In The Debt – Equity Ratio Result Was 2.12,2.01,1.53,0.84 Respective 2016,2015,2014,2013Years.Its Is Order Increasing. The Ideal Ratio Is 2:1 So The Company Performance Well. 0 0.5 1 1.5 2 2.5 2016-15 2015-14 2014-13 2013-12 DEBT-EQUITY RATIO DEBT-EQUITY RATIO
  • 55. 55 PROPRIETARY RATIO OR NET WORTH OF MARK EXHUAST SYSTEM LIMITED YEAR’S CALCULATION 2016-2015 0.31 2015-2014 0.32 2014-2013 0.37 2013-2012 0.50 Notes: In The Proprietary Ratio Or Wet Worth Result Was 0.31,0.32,0.37,0.5 Respective Year 2016,2015,2014,2014 And The Ideal Ratio Is 0.5:1.The Company Performance Better Condition. 0 0.1 0.2 0.3 0.4 0.5 0.6 2016-15 2015-14 2014-13 2013-12 NET WORTH RATIO NET WORTH RATIO
  • 56. 56 SOLVENCY RATIO OF MARK EXHUAST SYSTEM LIMITED YEAR’S CALCULATION 2016-2015 1 2015-2014 1 2014-2013 1 2013-2012 1 Notes: in the solvency ratio of the company result was 1,1,1,1 respective years 2016,2015,2014,2013 and the ideal ratio is high it means company performance well. 0 0.2 0.4 0.6 0.8 1 1.2 2016-15 2015-14 2014-13 2013-12 SOLVENCY RATIO SOLVENCY RATIO
  • 57. 57 FIXED ASSET TO NET WORTH OF MARK EXHUAST SYSTEM LIMITED YEAR’S CALCULATION 2016-2015 1.62 2015-2014 1.88 2014-2013 1.86 2013-2012 1.91 Notes: Iin The Ratio Fixed Asset To Net Worth Of Company Result Was 1.62,1.88,1.86,1.91 With Respective Years 2016,2015,2014,2013.The Ideal Ratio Is 0.75:1.The Performance Of The Company Is Unfavorable Condition. 1.45 1.5 1.55 1.6 1.65 1.7 1.75 1.8 1.85 1.9 1.95 2016-15 2015-14 2014-13 2013-12 FIXED ASSET TO NET WORTH FIXED ASSET TO NET WORTH
  • 58. 58 CURRENT ASSET TO NET WORTH OF MARK EXHUAST SYSTEM LIMITED YEAR’S CALCULATION 2016-2015 3.11 2015-2014 2.91 2014-2013 2.48 2013-2012 2.53 Notes: In The Current Asset To Net Worth Of Company Ratio Was Result Is 3.11,2.91,2.48,2.53 With Respective Years 2016,2015,2014,2013.The Company In Stable Condition. 0 0.5 1 1.5 2 2.5 3 3.5 2016-15 2015-14 2014-13 2013-12 CURRENT ASSET TO NET WORTH CURRENT ASSET TO NET WORTH
  • 59. 59 CURRENT LIABILITIESTO NET WORTH OF MARK EXHUAST SYSTEM LIMITED YEAR’S CALCULATION 2016-2015 1.60 2015-2014 1.81 2014-2013 1.89 2013-2012 2.45 Notes: In The Company Ratio Current Liabilities To Net Worth Result Was 1.60,1.81,1.89,2.45 Respective Years 2016,2015,2014,2013.The Ideal Ratio Is 1:3.So The Company Performance Not Well Infact Unfavorable Condition. 0 0.5 1 1.5 2 2.5 3 2016-15 2015-14 2014-13 2013-12 CUUENT LIAB. TO NET WORTH CUUENT LIAB. TO NET WORTH
  • 60. 60 FIXED ASSET RATIO OF MARK EXHUAST SYSTEM LIMITED YEAR’S CALCULATION 2016-2015 1.70 2015-2014 1.97 2014-2013 2.06 2013-2012 1.91 Notes: In The Company Fixed Asset Ratio Result Was 1.70,1.97,2.06,1.91 With Respective Years 2016,2015,2014,2013.And The Ideal Ratio Is 0.67:1 So Company Performance Unfavorable Condition. 0 0.5 1 1.5 2 2.5 2016-15 2015-14 2014-13 Category 4 FIXED ASSET RATIO FIXED ASSET RATIO
  • 61. 61 CHAPTER -6 FINDINGS OF STUDY SERIAL NUMBE R RATIO NAME 2016 -15 2015 -14 2014 -13 2013 -12 IDEAL RATIO RESULT 1 CURRENT RATIO 1.94 1.60 1.31 1.03 2:1 FAVORABLE CONDITION 2 QUICK RATIO 1.28 1.01 0.85 0.69 1:1 BETTER CONDITION 3 DEBT-EQUITY RATIO 2.12 2.01 1.53 0.84 2:1 FAVORABLE CONDITION 4 PROPRIETAR Y RATIO 0.31 0.32 0.37 0.50 0.5:1 BETTER CONDITION 5 SOLVENCY RATIO 1 1 1 1 HIGH FAVORABLE CONDITION 6 FIXED ASSET TO NET WORTH 1.62 1.88 1.86 1.91 0.75:1 UNFAVORABLE CONDITION 7 CURRENT ASSET TO NET WORTH 3.11 2.91 2.48 2.53 N/A STABLE 8 CURRENT LIAB. TO NET WORTH 1.60 1.81 1.89 2.45 1:3 UNFAVORABLE CONDITION 9 FIXED ASSET RATIO 1.70 1.97 2.06 1.91 0.67:1 UNFAVORABLE CONDITION
  • 62. 62  In The Current Ratio Result Was 1.94, 1.60, 1.31, 1.03 Respective Years 2016,2015,2014,2013...Is Increasing Order and Ideal Ratio 2:1.  It Means Current Ratio Is Favourable Condition Of The Mark Exhaust System Limited.  In The Quick Ratio Result Was 1.28, 1.01, 0.85, 0.69 Respective Years 2016, 2015, 2014, 2013.It’s Also in Increasing Order. The Ideal Ratio Of Quick Ratio Is 1:1.It Means Company Perform Favourable Condition In This Result.  In The Debt – Equity Ratio Result Was 2.12, 2.01, 1.53, 0.84 Respective 2016, 2015, 2014, 2013Years.It Is Order Increasing. The Ideal Ratio Is 2:1 So the Company Performance Well.  In The Proprietary Ratio Or Wet Worth Result Was 0.31, 0.32, 0.37, 0.5 Respective Year 2016,2015,2014,2014 And The Ideal Ratio Is 0.5:1.The Company Performance Better Condition.  In the solvency ratio of the company result was 1,1,1,1 respective years 2016,2015,2014,2013 and the ideal ratio is high it means company performance well.  In The Ratio Fixed Asset To Net Worth Of Company Result Was 1.62, 1.88, 1.86, 1.91 With Respective Years 2016, 2015, 2014, 2013.The Ideal 0 0.5 1 1.5 2 2.5 3 3.5 2016-2015 2015-2014 2014-2013 2013-2012 CURRENT RATIO QUICK RATIO DEBT-EQUITY RATIO PROPERIETARY RATIO SOLVENCY RATIO FIXED ASSET TO NET WORTH CURRENT ASSET TO NET WORTH CURRENT LIB. TO NET WORTH
  • 63. 63 Ratio Is 0.75:1.The Performance Of The Company Is Unfavourable Condition.  In The Current Asset To Net Worth Of Company Ratio Was Result Is 3.11, 2.91, 2.48, 2.53 With Respective Years 2016, 2015, 2014, 2013.The Company In Stable Condition.  In The Company Ratio Current Liabilities To Net Worth Result Was 1.60, 1.81, 1.89, 2.45 Respective Years 2016, 2015, 2014, 2013.The Ideal Ratio Is 1:3.So The Company Performance Not Well Infect Unfavourable Condition.  In The Company Fixed Asset Ratio Result Was 1.70, 1.97, 2.06, 1.91 With Respective Years 2016, 2015, 2014, 2013.And The Ideal Ratio Is 0.67:1 So Company Performance Unfavourable Condition.
  • 64. 64 CHAPTER – 7 LIMITATION OF RATIO ANAYLSIS Ratio analysis is one of the important techniques of determining the performance of financial Strength and weakness of a firm. Though ratio analysis is relevant and useful technique for the business concern, the analysis is based on the information available in the financial statements. There are some situations, where ratios are misused; it may lead the management to wrong direction. The ratio analysis suffers from the following limitations: 1. Ratio analysis is used on the basis of financial statements. Number of limitations of financial statements may affect the accuracy or quality of ratio analysis. 2. Ratio analysis heavily depends on quantitative facts and figures and it ignores qualitative data. Therefore this may limit accuracy. 3. Ratio analysis is a poor measure of a firm's performance due to lack of adequate standards laid for ideal ratios. 4. It is not a substitute for analysis of financial statements. It is merely used as a tool for measuring the performance of business activities. 5. Ratio analysis clearly has some latitude for window dressing. 8. Ratio analysis does not consider the change in price level, as such; this ratio will not help in drawing meaningful inferences.
  • 65. 65 CHAPTER -8 SUGGESTIONS & RECOMMENDATIONS Financial Statements Play An Essential Role In Modern Economies, Partly Because Of A Series Of Regulatory Pronouncements And Investor Demands For Greater Accountability And Data Transparency. Businesses Rely On A Network Of Operating Resources And Technological Equipment To Identify What's Important When Analyzing Accounting Reports And Recommending Steps For Compliance.  Quick Ratio Is Better Condition It’s Indicate Liquidity Position Is Not Good So, It Improve  Proprietary Ratio Is Better Condition It’s Indicate Not Good Long Term Solvency (Financial) Position of the Company. This Ratio Indicates The Extent To Which The Assets Of The Company Can Be Lost Without Affecting The Interest Of The Creditors Of The Company. So, Increase Fixed Asset  Fixed Asset To Net Worth Ratio Is Unfavourable Condition It’s Indicates The Extent To Which Ownership Funds Are Sunk Into Assets With Relatively Low Turnover. When The Amount of Proprietor's Funds Exceed the Value Of Fixed Assets, A part Of The Net Working Capital Is Provided By The Shareholders, Provided There Are No Other Non-Current Assets, And When Proprietor’s Funds Are Less Than The Fixed Assets, Creditors Obligation Have Been Used To Finance A Part Of Fixed Assets. The Yardstick For This Measure Is 65% For Industrial Undertakings.So,Increase Fixed Asset  Current Liabilities to Net worth Is Unfavourable Condition .This Ratio Indicates the Relative Contribution of Short Term Creditors and Owners to the Capital of an Enterprise. If The Ratio Is High, It Means It Is Difficult To Obtain Long Term Funds By The Business. So, Company Have To Stop To Increase This Ratio.  Fixed Asset Ratio Is Also Unfavourable Condition its Not Yet to Improve Standred of Ideal Ratio .This Ratio Enables to Know How Fixed Assets Are Financed I.E. By Use of Short Term Funds or By Long Term Funds. This Ratio Should Not Be More Than 1.Company Having Improved Lot.  Other Suggestions & Recommendations  Ensuring Compliance With All Applicable Legislative Requirements  Empowering Employees To Ensure Safety In Their Respective Work Places  Promoting Safety And Health Awareness Amongst Employees, Suppliers And Contractors  Continuous Improvement In Safety Performance Through Awareness, Participation And Training Of Employees  Set Environmental Objectives And Targets
  • 66. 66  Continually Improve And Maintain High Levels Of Operational And Technical Performance  Reduce And/or Prevent Pollution, Minimize Wastage Of Resources  Comply With Legal And Regulatory Requirements  Practice Good Corporate Governance To Protect Shareholder Value  Maintain Strong Audit Programs To Increase Interest And Confidence  Keep Shareholders Informed About The Company And Other Developments  The Mark Exhaust Group Has Seen Rapid And Consistent Growth. Today We Have Revenues Of Rs. 500 Crores, Over 700 Employees And State-Of-The-Art Manufacturing Plants To Cater To A Growing Local And Global Customer Base. Our Revenues Have Grown Steadily And They Have Doubled In The Last Three Years. With A Cagr Of 26%, We Have Maintained A Growth Rate That Is Double Of The Industry Average.
  • 67. 67 CHAPTER-9 CONCLUSION Two years back, when the spectre of a slowdown loomed large on the domestic automotive industry, the Gurgaon-based sheet metal component maker Mark ExhaustSystems Limited (MESL), changed tack by focusing more on acquisitions and diversification while holding back on Greenfield expansion. The company, a joint venture between Rattan Kapur & Associates and Suzuki India made two acquisitions in the past few months and looks at taking its Group turnover (Rattan Kapur & Associates) from Rs 1,400 crore in FY14 to Rs 2,000 crore by next fiscal year. The company, a couple of weeks ago, acquired 100% stake in Haryana-based BWI Shock Absorbers for $ 1.5 million. The Chinese firm BWI Shock Absorbers had recently bought the company from leading German component maker Delphi and now the company has changed hands in favour of MESL. Maruti Suzuki is a major client. The acquired company reported a turnover of Rs 140 crore in FY14. "EBIDTA margins have been lower than expected due to the slowing demand in the market. The margins were in the range of around 14-15%. We have held back on fresh investment through the organic route and chose to look at acquisitions," Rattan Kapur, Chairman and Managing Director, MESL told ETAuto in an interview recently. MESL is one of the few companies that started as a joint venture with country's largest carmaker Maruti Suzuki. "We make acquisitions that are backed by R&D," he said. Though the company focuses on exports, Kapur says this will change as he plans to cater to Indian OEMs and would also diversify to service two-wheeler makers. BWI has a R&D base in Poland and a MESL team is currently camped in East European nation. "The acquisition will help the company establish its own R&D, training and validation centre in India in the next two years. BWI had a turnover of around Rs 140 crore in FY14, but it still has about 40% spare capacity which leaves room for further expansion," said Rattan. BWI was originally, Delphi Company but was taken over by the Chinese company BWI Shock Absorber. About six months ago, the company had diversified into pumps by acquiring a North Wales company Quinton Hazell (now Mark Water Pumps Limited) for $1.64 million dollars. The company has Volvo, Aston Martin & JLR as their major customers. The company has recently concluded its organic expansion. It recently set up a new plant in Bangalore to build suspension system for Honda Motorcycles with an investment of Rs 120 crore. MESL with its subsidiary Track Component, in Pune has partnered Mahindra & Mahindra for making under body systems and also CCBs -cross car beams for all the new models that
  • 68. 68 Mahindra & Mahindra is going to launch. The company has invested Rs 70 crores in this plant.