SlideShare a Scribd company logo
1 of 16
Prepared by Volkan OBAN
Plot3D package in R and examples,etc.
Reference: http://www.sthda.com/english/wiki/impressive-package-for-3d-and-4d-graph-r-
software-and-data-visualization
text3D: plot 3-dimensionnal texts
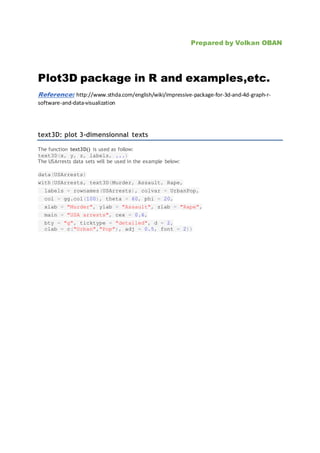
The function text3D() is used as follow:
text3D(x, y, z, labels, ...)
The USArrests data sets will be used in the example below:
data(USArrests)
with(USArrests, text3D(Murder, Assault, Rape,
labels = rownames(USArrests), colvar = UrbanPop,
col = gg.col(100), theta = 60, phi = 20,
xlab = "Murder", ylab = "Assault", zlab = "Rape",
main = "USA arrests", cex = 0.6,
bty = "g", ticktype = "detailed", d = 2,
clab = c("Urban","Pop"), adj = 0.5, font = 2))
# Plot texts
with(USArrests, text3D(Murder, Assault, Rape, labels = rownames(USArrests),
colvar = UrbanPop, col = gg.col(100), theta = 60, phi = 20, xlab = "Murder",
ylab = "Assault", zlab = "Rape", main = "USA arrests", cex = 0.6, bty = "g",
ticktype = "detailed", d = 2, clab = c("Urban","Pop"), adj = 0.5, font = 2)) #
Add points with(USArrests, scatter3D(Murder, Assault, Rape - 1, colvar =
UrbanPop, col = gg.col(100), type = "h", pch = ".", add = TRUE))
plotdev(xlim = c(0, 10), ylim = c(40, 150), zlim = c(7, 25))
Histogram3D
data(VADeaths)
# hist3D and ribbon3D with greyish background, rotated, rescaled,...
hist3D(z = VADeaths, scale = FALSE, expand = 0.01, bty = "g", phi = 20, col =
"#0072B2", border = "black", shade = 0.2, ltheta = 90, space = 0.3, ticktype
= "detailed", d = 2)
hist3D (x = 1:5, y = 1:4, z = VADeaths, bty = "g", phi = 20, theta = -60,
xlab = "", ylab = "", zlab = "", main = "VADeaths", col = "#0072B2", border =
"black", shade = 0.8, ticktype = "detailed", space = 0.15, d = 2, cex.axis =
1e-9)
# Use text3D to label x axis
text3D(x = 1:5, y = rep(0.5, 5), z = rep(3, 5), labels =
rownames(VADeaths), add = TRUE, adj = 0)
# Use text3D to label yaxis
text3D(x = rep(1, 4), y = 1:4, z = rep(0, 4), labels = colnames(VADeaths),
add = TRUE, adj = 1)
hist3D_fancy(iris$Sepal.Length, iris$Petal.Width,
+ colvar=as.numeric(iris$Species))
Example:
x0 <- c(0, 0, 0, 0)
> y0 <- c(0, 0, 0, 0)
> z0 <- c(0, 0, 0, 0)
> x1 <- c(0.89, -0.46, 0.99, 0.96)
> y1 <- c(0.36, 0.88, 0.02, 0.06)
> z1 <- c(-0.28, 0.09, 0.05, 0.24)
> cols <- c("#1B9E77", "#D95F02", "#7570B3", "#E7298A")
> arrows3D(x0, y0, z0, x1, y1, z1, colvar = x1^2, col = cols,
+ lwd = 2, d = 3, clab = c("Quality", "score"),
+ main = "Arrows 3D", bty ="g", ticktype = "detailed")
> # Add starting point of arrow
> points3D(x0, y0, z0, add = TRUE, col="darkred",
+ colkey = FALSE, pch = 19, cex = 1)
> # Add labels to the arrows
> text3D(x1, y1, z1, c("Sepal.L", "Sepal.W", "Petal.L", "Petal.W"),
+ colvar = x1^2, col = cols, add=TRUE, colkey = FALSE)
EXAMPLE:
data(iris)
x <- iris$Sepal.Length
y <- iris$Petal.Length
z <- iris$Sepal.Width
scatter3D(x, y, z, pch = 18, bty = "u", colkey = FALSE,
+ main ="bty= 'u'", col.panel ="steelblue", expand =0.4,
+ col.grid = "darkblue")
> scatter3D(x, y, z, bty = "g", pch = 18, col = gg.col(100))
> # ramp.col: custom palettes
> scatter3D(x, y, z, bty = "g", pch = 18,
+ col = ramp.col(c("blue", "yellow", "red")) )
> scatter3D(x, y, z, phi = 0, bty = "g",
+ pch = 20, cex = 2, ticktype = "detailed")
scatter3D(x, y, z, phi = 0, bty = "g", type = "l", ticktype = "detailed", lwd =
4)
scatter3D(x, y, z, phi = 0, bty = "g", type = "h",
+ ticktype = "detailed", pch = 19, cex = 0.5)
> x <- mtcars$wt
> y <- mtcars$disp
> z <- mtcars$mpg
> # Compute the linear regression (z = ax + by + d)
> fit <- lm(z ~ x + y)
> # predict values on regular xy grid
> grid.lines = 26
> x.pred <- seq(min(x), max(x), length.out = grid.lines)
> y.pred <- seq(min(y), max(y), length.out = grid.lines)
> xy <- expand.grid( x = x.pred, y = y.pred)
> z.pred <- matrix(predict(fit, newdata = xy),
+ nrow = grid.lines, ncol = grid.lines)
> # fitted points for droplines to surface
> fitpoints <- predict(fit)
> # scatter plot with regression plane
> scatter3D(x, y, z, pch = 18, cex = 2,
+ theta = 20, phi = 20, ticktype = "detailed",
+ xlab = "wt", ylab = "disp", zlab = "mpg",
+ surf = list(x = x.pred, y = y.pred, z = z.pred,
+ facets = NA, fit = fitpoints), main = "mtcars")

More Related Content

Similar to Plot3D Package and Example in R.-Data visualizat,on

Advanced Data Visualization Examples with R-Part II
Advanced Data Visualization Examples with R-Part IIAdvanced Data Visualization Examples with R-Part II
Advanced Data Visualization Examples with R-Part IIDr. Volkan OBAN
 
An example of R code for Data visualization
An example of R code for Data visualizationAn example of R code for Data visualization
An example of R code for Data visualizationLiang (Leon) Zhou
 
Advanced Data Visualization in R- Somes Examples.
Advanced Data Visualization in R- Somes Examples.Advanced Data Visualization in R- Somes Examples.
Advanced Data Visualization in R- Somes Examples.Dr. Volkan OBAN
 
Seminar PSU 09.04.2013 - 10.04.2013 MiFIT, Arbuzov Vyacheslav
Seminar PSU 09.04.2013 - 10.04.2013 MiFIT, Arbuzov VyacheslavSeminar PSU 09.04.2013 - 10.04.2013 MiFIT, Arbuzov Vyacheslav
Seminar PSU 09.04.2013 - 10.04.2013 MiFIT, Arbuzov VyacheslavVyacheslav Arbuzov
 
数学カフェ 確率・統計・機械学習回 「速習 確率・統計」
数学カフェ 確率・統計・機械学習回 「速習 確率・統計」数学カフェ 確率・統計・機械学習回 「速習 確率・統計」
数学カフェ 確率・統計・機械学習回 「速習 確率・統計」Ken'ichi Matsui
 
Артём Акуляков - F# for Data Analysis
Артём Акуляков - F# for Data AnalysisАртём Акуляков - F# for Data Analysis
Артём Акуляков - F# for Data AnalysisSpbDotNet Community
 
Surface3d in R and rgl package.
Surface3d in R and rgl package.Surface3d in R and rgl package.
Surface3d in R and rgl package.Dr. Volkan OBAN
 
Cg my own programs
Cg my own programsCg my own programs
Cg my own programsAmit Kapoor
 
ggtimeseries-->ggplot2 extensions
ggtimeseries-->ggplot2 extensions ggtimeseries-->ggplot2 extensions
ggtimeseries-->ggplot2 extensions Dr. Volkan OBAN
 
Microsoft Word Practice Exercise Set 2
Microsoft Word   Practice Exercise Set 2Microsoft Word   Practice Exercise Set 2
Microsoft Word Practice Exercise Set 2rampan
 
R scatter plots
R scatter plotsR scatter plots
R scatter plotsAbhik Seal
 
Frsa
FrsaFrsa
Frsa_111
 
Program to reflecta triangle
Program to reflecta triangleProgram to reflecta triangle
Program to reflecta triangleTanya Makkar
 
What is wrong with this code def plotCountryDensitiesdata.pdf
What is wrong with this code def plotCountryDensitiesdata.pdfWhat is wrong with this code def plotCountryDensitiesdata.pdf
What is wrong with this code def plotCountryDensitiesdata.pdfaccumencomp
 

Similar to Plot3D Package and Example in R.-Data visualizat,on (20)

Advanced Data Visualization Examples with R-Part II
Advanced Data Visualization Examples with R-Part IIAdvanced Data Visualization Examples with R-Part II
Advanced Data Visualization Examples with R-Part II
 
Joclad 2010 d
Joclad 2010 dJoclad 2010 d
Joclad 2010 d
 
An example of R code for Data visualization
An example of R code for Data visualizationAn example of R code for Data visualization
An example of R code for Data visualization
 
Advanced Data Visualization in R- Somes Examples.
Advanced Data Visualization in R- Somes Examples.Advanced Data Visualization in R- Somes Examples.
Advanced Data Visualization in R- Somes Examples.
 
Seminar PSU 09.04.2013 - 10.04.2013 MiFIT, Arbuzov Vyacheslav
Seminar PSU 09.04.2013 - 10.04.2013 MiFIT, Arbuzov VyacheslavSeminar PSU 09.04.2013 - 10.04.2013 MiFIT, Arbuzov Vyacheslav
Seminar PSU 09.04.2013 - 10.04.2013 MiFIT, Arbuzov Vyacheslav
 
数学カフェ 確率・統計・機械学習回 「速習 確率・統計」
数学カフェ 確率・統計・機械学習回 「速習 確率・統計」数学カフェ 確率・統計・機械学習回 「速習 確率・統計」
数学カフェ 確率・統計・機械学習回 「速習 確率・統計」
 
Артём Акуляков - F# for Data Analysis
Артём Акуляков - F# for Data AnalysisАртём Акуляков - F# for Data Analysis
Артём Акуляков - F# for Data Analysis
 
Surface3d in R and rgl package.
Surface3d in R and rgl package.Surface3d in R and rgl package.
Surface3d in R and rgl package.
 
Introduction to R
Introduction to RIntroduction to R
Introduction to R
 
Cg my own programs
Cg my own programsCg my own programs
Cg my own programs
 
ggtimeseries-->ggplot2 extensions
ggtimeseries-->ggplot2 extensions ggtimeseries-->ggplot2 extensions
ggtimeseries-->ggplot2 extensions
 
Oh Composable World!
Oh Composable World!Oh Composable World!
Oh Composable World!
 
Microsoft Word Practice Exercise Set 2
Microsoft Word   Practice Exercise Set 2Microsoft Word   Practice Exercise Set 2
Microsoft Word Practice Exercise Set 2
 
R scatter plots
R scatter plotsR scatter plots
R scatter plots
 
Genomic Graphics
Genomic GraphicsGenomic Graphics
Genomic Graphics
 
Frsa
FrsaFrsa
Frsa
 
Python grass
Python grassPython grass
Python grass
 
R for you
R for youR for you
R for you
 
Program to reflecta triangle
Program to reflecta triangleProgram to reflecta triangle
Program to reflecta triangle
 
What is wrong with this code def plotCountryDensitiesdata.pdf
What is wrong with this code def plotCountryDensitiesdata.pdfWhat is wrong with this code def plotCountryDensitiesdata.pdf
What is wrong with this code def plotCountryDensitiesdata.pdf
 

More from Dr. Volkan OBAN

Conference Paper:IMAGE PROCESSING AND OBJECT DETECTION APPLICATION: INSURANCE...
Conference Paper:IMAGE PROCESSING AND OBJECT DETECTION APPLICATION: INSURANCE...Conference Paper:IMAGE PROCESSING AND OBJECT DETECTION APPLICATION: INSURANCE...
Conference Paper:IMAGE PROCESSING AND OBJECT DETECTION APPLICATION: INSURANCE...Dr. Volkan OBAN
 
Covid19py Python Package - Example
Covid19py  Python Package - ExampleCovid19py  Python Package - Example
Covid19py Python Package - ExampleDr. Volkan OBAN
 
Object detection with Python
Object detection with Python Object detection with Python
Object detection with Python Dr. Volkan OBAN
 
Python - Rastgele Orman(Random Forest) Parametreleri
Python - Rastgele Orman(Random Forest) ParametreleriPython - Rastgele Orman(Random Forest) Parametreleri
Python - Rastgele Orman(Random Forest) ParametreleriDr. Volkan OBAN
 
Linear Programming wi̇th R - Examples
Linear Programming wi̇th R - ExamplesLinear Programming wi̇th R - Examples
Linear Programming wi̇th R - ExamplesDr. Volkan OBAN
 
"optrees" package in R and examples.(optrees:finds optimal trees in weighted ...
"optrees" package in R and examples.(optrees:finds optimal trees in weighted ..."optrees" package in R and examples.(optrees:finds optimal trees in weighted ...
"optrees" package in R and examples.(optrees:finds optimal trees in weighted ...Dr. Volkan OBAN
 
k-means Clustering in Python
k-means Clustering in Pythonk-means Clustering in Python
k-means Clustering in PythonDr. Volkan OBAN
 
Naive Bayes Example using R
Naive Bayes Example using  R Naive Bayes Example using  R
Naive Bayes Example using R Dr. Volkan OBAN
 
k-means Clustering and Custergram with R
k-means Clustering and Custergram with Rk-means Clustering and Custergram with R
k-means Clustering and Custergram with RDr. Volkan OBAN
 
Data Science and its Relationship to Big Data and Data-Driven Decision Making
Data Science and its Relationship to Big Data and Data-Driven Decision MakingData Science and its Relationship to Big Data and Data-Driven Decision Making
Data Science and its Relationship to Big Data and Data-Driven Decision MakingDr. Volkan OBAN
 
Data Visualization with R.ggplot2 and its extensions examples.
Data Visualization with R.ggplot2 and its extensions examples.Data Visualization with R.ggplot2 and its extensions examples.
Data Visualization with R.ggplot2 and its extensions examples.Dr. Volkan OBAN
 
Scikit-learn Cheatsheet-Python
Scikit-learn Cheatsheet-PythonScikit-learn Cheatsheet-Python
Scikit-learn Cheatsheet-PythonDr. Volkan OBAN
 
Python Pandas for Data Science cheatsheet
Python Pandas for Data Science cheatsheet Python Pandas for Data Science cheatsheet
Python Pandas for Data Science cheatsheet Dr. Volkan OBAN
 
Pandas,scipy,numpy cheatsheet
Pandas,scipy,numpy cheatsheetPandas,scipy,numpy cheatsheet
Pandas,scipy,numpy cheatsheetDr. Volkan OBAN
 
ReporteRs package in R. forming powerpoint documents-an example
ReporteRs package in R. forming powerpoint documents-an exampleReporteRs package in R. forming powerpoint documents-an example
ReporteRs package in R. forming powerpoint documents-an exampleDr. Volkan OBAN
 
ReporteRs package in R. forming powerpoint documents-an example
ReporteRs package in R. forming powerpoint documents-an exampleReporteRs package in R. forming powerpoint documents-an example
ReporteRs package in R. forming powerpoint documents-an exampleDr. Volkan OBAN
 
R Machine Learning packages( generally used)
R Machine Learning packages( generally used)R Machine Learning packages( generally used)
R Machine Learning packages( generally used)Dr. Volkan OBAN
 
treemap package in R and examples.
treemap package in R and examples.treemap package in R and examples.
treemap package in R and examples.Dr. Volkan OBAN
 

More from Dr. Volkan OBAN (20)

Conference Paper:IMAGE PROCESSING AND OBJECT DETECTION APPLICATION: INSURANCE...
Conference Paper:IMAGE PROCESSING AND OBJECT DETECTION APPLICATION: INSURANCE...Conference Paper:IMAGE PROCESSING AND OBJECT DETECTION APPLICATION: INSURANCE...
Conference Paper:IMAGE PROCESSING AND OBJECT DETECTION APPLICATION: INSURANCE...
 
Covid19py Python Package - Example
Covid19py  Python Package - ExampleCovid19py  Python Package - Example
Covid19py Python Package - Example
 
Object detection with Python
Object detection with Python Object detection with Python
Object detection with Python
 
Python - Rastgele Orman(Random Forest) Parametreleri
Python - Rastgele Orman(Random Forest) ParametreleriPython - Rastgele Orman(Random Forest) Parametreleri
Python - Rastgele Orman(Random Forest) Parametreleri
 
Linear Programming wi̇th R - Examples
Linear Programming wi̇th R - ExamplesLinear Programming wi̇th R - Examples
Linear Programming wi̇th R - Examples
 
"optrees" package in R and examples.(optrees:finds optimal trees in weighted ...
"optrees" package in R and examples.(optrees:finds optimal trees in weighted ..."optrees" package in R and examples.(optrees:finds optimal trees in weighted ...
"optrees" package in R and examples.(optrees:finds optimal trees in weighted ...
 
k-means Clustering in Python
k-means Clustering in Pythonk-means Clustering in Python
k-means Clustering in Python
 
Naive Bayes Example using R
Naive Bayes Example using  R Naive Bayes Example using  R
Naive Bayes Example using R
 
R forecasting Example
R forecasting ExampleR forecasting Example
R forecasting Example
 
k-means Clustering and Custergram with R
k-means Clustering and Custergram with Rk-means Clustering and Custergram with R
k-means Clustering and Custergram with R
 
Data Science and its Relationship to Big Data and Data-Driven Decision Making
Data Science and its Relationship to Big Data and Data-Driven Decision MakingData Science and its Relationship to Big Data and Data-Driven Decision Making
Data Science and its Relationship to Big Data and Data-Driven Decision Making
 
Data Visualization with R.ggplot2 and its extensions examples.
Data Visualization with R.ggplot2 and its extensions examples.Data Visualization with R.ggplot2 and its extensions examples.
Data Visualization with R.ggplot2 and its extensions examples.
 
Scikit-learn Cheatsheet-Python
Scikit-learn Cheatsheet-PythonScikit-learn Cheatsheet-Python
Scikit-learn Cheatsheet-Python
 
Python Pandas for Data Science cheatsheet
Python Pandas for Data Science cheatsheet Python Pandas for Data Science cheatsheet
Python Pandas for Data Science cheatsheet
 
Pandas,scipy,numpy cheatsheet
Pandas,scipy,numpy cheatsheetPandas,scipy,numpy cheatsheet
Pandas,scipy,numpy cheatsheet
 
ReporteRs package in R. forming powerpoint documents-an example
ReporteRs package in R. forming powerpoint documents-an exampleReporteRs package in R. forming powerpoint documents-an example
ReporteRs package in R. forming powerpoint documents-an example
 
ReporteRs package in R. forming powerpoint documents-an example
ReporteRs package in R. forming powerpoint documents-an exampleReporteRs package in R. forming powerpoint documents-an example
ReporteRs package in R. forming powerpoint documents-an example
 
R Machine Learning packages( generally used)
R Machine Learning packages( generally used)R Machine Learning packages( generally used)
R Machine Learning packages( generally used)
 
treemap package in R and examples.
treemap package in R and examples.treemap package in R and examples.
treemap package in R and examples.
 
Mosaic plot in R.
Mosaic plot in R.Mosaic plot in R.
Mosaic plot in R.
 

Recently uploaded

VIP Call Girls in Amravati Aarohi 8250192130 Independent Escort Service Amravati
VIP Call Girls in Amravati Aarohi 8250192130 Independent Escort Service AmravatiVIP Call Girls in Amravati Aarohi 8250192130 Independent Escort Service Amravati
VIP Call Girls in Amravati Aarohi 8250192130 Independent Escort Service AmravatiSuhani Kapoor
 
Al Barsha Escorts $#$ O565212860 $#$ Escort Service In Al Barsha
Al Barsha Escorts $#$ O565212860 $#$ Escort Service In Al BarshaAl Barsha Escorts $#$ O565212860 $#$ Escort Service In Al Barsha
Al Barsha Escorts $#$ O565212860 $#$ Escort Service In Al BarshaAroojKhan71
 
VIP High Class Call Girls Jamshedpur Anushka 8250192130 Independent Escort Se...
VIP High Class Call Girls Jamshedpur Anushka 8250192130 Independent Escort Se...VIP High Class Call Girls Jamshedpur Anushka 8250192130 Independent Escort Se...
VIP High Class Call Girls Jamshedpur Anushka 8250192130 Independent Escort Se...Suhani Kapoor
 
BPAC WITH UFSBI GENERAL PRESENTATION 18_05_2017-1.pptx
BPAC WITH UFSBI GENERAL PRESENTATION 18_05_2017-1.pptxBPAC WITH UFSBI GENERAL PRESENTATION 18_05_2017-1.pptx
BPAC WITH UFSBI GENERAL PRESENTATION 18_05_2017-1.pptxMohammedJunaid861692
 
Log Analysis using OSSEC sasoasasasas.pptx
Log Analysis using OSSEC sasoasasasas.pptxLog Analysis using OSSEC sasoasasasas.pptx
Log Analysis using OSSEC sasoasasasas.pptxJohnnyPlasten
 
VIP High Profile Call Girls Amravati Aarushi 8250192130 Independent Escort Se...
VIP High Profile Call Girls Amravati Aarushi 8250192130 Independent Escort Se...VIP High Profile Call Girls Amravati Aarushi 8250192130 Independent Escort Se...
VIP High Profile Call Girls Amravati Aarushi 8250192130 Independent Escort Se...Suhani Kapoor
 
Generative AI on Enterprise Cloud with NiFi and Milvus
Generative AI on Enterprise Cloud with NiFi and MilvusGenerative AI on Enterprise Cloud with NiFi and Milvus
Generative AI on Enterprise Cloud with NiFi and MilvusTimothy Spann
 
Delhi Call Girls Punjabi Bagh 9711199171 ☎✔👌✔ Whatsapp Hard And Sexy Vip Call
Delhi Call Girls Punjabi Bagh 9711199171 ☎✔👌✔ Whatsapp Hard And Sexy Vip CallDelhi Call Girls Punjabi Bagh 9711199171 ☎✔👌✔ Whatsapp Hard And Sexy Vip Call
Delhi Call Girls Punjabi Bagh 9711199171 ☎✔👌✔ Whatsapp Hard And Sexy Vip Callshivangimorya083
 
Data-Analysis for Chicago Crime Data 2023
Data-Analysis for Chicago Crime Data  2023Data-Analysis for Chicago Crime Data  2023
Data-Analysis for Chicago Crime Data 2023ymrp368
 
Delhi Call Girls CP 9711199171 ☎✔👌✔ Whatsapp Hard And Sexy Vip Call
Delhi Call Girls CP 9711199171 ☎✔👌✔ Whatsapp Hard And Sexy Vip CallDelhi Call Girls CP 9711199171 ☎✔👌✔ Whatsapp Hard And Sexy Vip Call
Delhi Call Girls CP 9711199171 ☎✔👌✔ Whatsapp Hard And Sexy Vip Callshivangimorya083
 
RA-11058_IRR-COMPRESS Do 198 series of 1998
RA-11058_IRR-COMPRESS Do 198 series of 1998RA-11058_IRR-COMPRESS Do 198 series of 1998
RA-11058_IRR-COMPRESS Do 198 series of 1998YohFuh
 
Ravak dropshipping via API with DroFx.pptx
Ravak dropshipping via API with DroFx.pptxRavak dropshipping via API with DroFx.pptx
Ravak dropshipping via API with DroFx.pptxolyaivanovalion
 
Midocean dropshipping via API with DroFx
Midocean dropshipping via API with DroFxMidocean dropshipping via API with DroFx
Midocean dropshipping via API with DroFxolyaivanovalion
 
꧁❤ Greater Noida Call Girls Delhi ❤꧂ 9711199171 ☎️ Hard And Sexy Vip Call
꧁❤ Greater Noida Call Girls Delhi ❤꧂ 9711199171 ☎️ Hard And Sexy Vip Call꧁❤ Greater Noida Call Girls Delhi ❤꧂ 9711199171 ☎️ Hard And Sexy Vip Call
꧁❤ Greater Noida Call Girls Delhi ❤꧂ 9711199171 ☎️ Hard And Sexy Vip Callshivangimorya083
 
Unveiling Insights: The Role of a Data Analyst
Unveiling Insights: The Role of a Data AnalystUnveiling Insights: The Role of a Data Analyst
Unveiling Insights: The Role of a Data AnalystSamantha Rae Coolbeth
 
(PARI) Call Girls Wanowrie ( 7001035870 ) HI-Fi Pune Escorts Service
(PARI) Call Girls Wanowrie ( 7001035870 ) HI-Fi Pune Escorts Service(PARI) Call Girls Wanowrie ( 7001035870 ) HI-Fi Pune Escorts Service
(PARI) Call Girls Wanowrie ( 7001035870 ) HI-Fi Pune Escorts Serviceranjana rawat
 
Market Analysis in the 5 Largest Economic Countries in Southeast Asia.pdf
Market Analysis in the 5 Largest Economic Countries in Southeast Asia.pdfMarket Analysis in the 5 Largest Economic Countries in Southeast Asia.pdf
Market Analysis in the 5 Largest Economic Countries in Southeast Asia.pdfRachmat Ramadhan H
 
CebaBaby dropshipping via API with DroFX.pptx
CebaBaby dropshipping via API with DroFX.pptxCebaBaby dropshipping via API with DroFX.pptx
CebaBaby dropshipping via API with DroFX.pptxolyaivanovalion
 
Carero dropshipping via API with DroFx.pptx
Carero dropshipping via API with DroFx.pptxCarero dropshipping via API with DroFx.pptx
Carero dropshipping via API with DroFx.pptxolyaivanovalion
 
Industrialised data - the key to AI success.pdf
Industrialised data - the key to AI success.pdfIndustrialised data - the key to AI success.pdf
Industrialised data - the key to AI success.pdfLars Albertsson
 

Recently uploaded (20)

VIP Call Girls in Amravati Aarohi 8250192130 Independent Escort Service Amravati
VIP Call Girls in Amravati Aarohi 8250192130 Independent Escort Service AmravatiVIP Call Girls in Amravati Aarohi 8250192130 Independent Escort Service Amravati
VIP Call Girls in Amravati Aarohi 8250192130 Independent Escort Service Amravati
 
Al Barsha Escorts $#$ O565212860 $#$ Escort Service In Al Barsha
Al Barsha Escorts $#$ O565212860 $#$ Escort Service In Al BarshaAl Barsha Escorts $#$ O565212860 $#$ Escort Service In Al Barsha
Al Barsha Escorts $#$ O565212860 $#$ Escort Service In Al Barsha
 
VIP High Class Call Girls Jamshedpur Anushka 8250192130 Independent Escort Se...
VIP High Class Call Girls Jamshedpur Anushka 8250192130 Independent Escort Se...VIP High Class Call Girls Jamshedpur Anushka 8250192130 Independent Escort Se...
VIP High Class Call Girls Jamshedpur Anushka 8250192130 Independent Escort Se...
 
BPAC WITH UFSBI GENERAL PRESENTATION 18_05_2017-1.pptx
BPAC WITH UFSBI GENERAL PRESENTATION 18_05_2017-1.pptxBPAC WITH UFSBI GENERAL PRESENTATION 18_05_2017-1.pptx
BPAC WITH UFSBI GENERAL PRESENTATION 18_05_2017-1.pptx
 
Log Analysis using OSSEC sasoasasasas.pptx
Log Analysis using OSSEC sasoasasasas.pptxLog Analysis using OSSEC sasoasasasas.pptx
Log Analysis using OSSEC sasoasasasas.pptx
 
VIP High Profile Call Girls Amravati Aarushi 8250192130 Independent Escort Se...
VIP High Profile Call Girls Amravati Aarushi 8250192130 Independent Escort Se...VIP High Profile Call Girls Amravati Aarushi 8250192130 Independent Escort Se...
VIP High Profile Call Girls Amravati Aarushi 8250192130 Independent Escort Se...
 
Generative AI on Enterprise Cloud with NiFi and Milvus
Generative AI on Enterprise Cloud with NiFi and MilvusGenerative AI on Enterprise Cloud with NiFi and Milvus
Generative AI on Enterprise Cloud with NiFi and Milvus
 
Delhi Call Girls Punjabi Bagh 9711199171 ☎✔👌✔ Whatsapp Hard And Sexy Vip Call
Delhi Call Girls Punjabi Bagh 9711199171 ☎✔👌✔ Whatsapp Hard And Sexy Vip CallDelhi Call Girls Punjabi Bagh 9711199171 ☎✔👌✔ Whatsapp Hard And Sexy Vip Call
Delhi Call Girls Punjabi Bagh 9711199171 ☎✔👌✔ Whatsapp Hard And Sexy Vip Call
 
Data-Analysis for Chicago Crime Data 2023
Data-Analysis for Chicago Crime Data  2023Data-Analysis for Chicago Crime Data  2023
Data-Analysis for Chicago Crime Data 2023
 
Delhi Call Girls CP 9711199171 ☎✔👌✔ Whatsapp Hard And Sexy Vip Call
Delhi Call Girls CP 9711199171 ☎✔👌✔ Whatsapp Hard And Sexy Vip CallDelhi Call Girls CP 9711199171 ☎✔👌✔ Whatsapp Hard And Sexy Vip Call
Delhi Call Girls CP 9711199171 ☎✔👌✔ Whatsapp Hard And Sexy Vip Call
 
RA-11058_IRR-COMPRESS Do 198 series of 1998
RA-11058_IRR-COMPRESS Do 198 series of 1998RA-11058_IRR-COMPRESS Do 198 series of 1998
RA-11058_IRR-COMPRESS Do 198 series of 1998
 
Ravak dropshipping via API with DroFx.pptx
Ravak dropshipping via API with DroFx.pptxRavak dropshipping via API with DroFx.pptx
Ravak dropshipping via API with DroFx.pptx
 
Midocean dropshipping via API with DroFx
Midocean dropshipping via API with DroFxMidocean dropshipping via API with DroFx
Midocean dropshipping via API with DroFx
 
꧁❤ Greater Noida Call Girls Delhi ❤꧂ 9711199171 ☎️ Hard And Sexy Vip Call
꧁❤ Greater Noida Call Girls Delhi ❤꧂ 9711199171 ☎️ Hard And Sexy Vip Call꧁❤ Greater Noida Call Girls Delhi ❤꧂ 9711199171 ☎️ Hard And Sexy Vip Call
꧁❤ Greater Noida Call Girls Delhi ❤꧂ 9711199171 ☎️ Hard And Sexy Vip Call
 
Unveiling Insights: The Role of a Data Analyst
Unveiling Insights: The Role of a Data AnalystUnveiling Insights: The Role of a Data Analyst
Unveiling Insights: The Role of a Data Analyst
 
(PARI) Call Girls Wanowrie ( 7001035870 ) HI-Fi Pune Escorts Service
(PARI) Call Girls Wanowrie ( 7001035870 ) HI-Fi Pune Escorts Service(PARI) Call Girls Wanowrie ( 7001035870 ) HI-Fi Pune Escorts Service
(PARI) Call Girls Wanowrie ( 7001035870 ) HI-Fi Pune Escorts Service
 
Market Analysis in the 5 Largest Economic Countries in Southeast Asia.pdf
Market Analysis in the 5 Largest Economic Countries in Southeast Asia.pdfMarket Analysis in the 5 Largest Economic Countries in Southeast Asia.pdf
Market Analysis in the 5 Largest Economic Countries in Southeast Asia.pdf
 
CebaBaby dropshipping via API with DroFX.pptx
CebaBaby dropshipping via API with DroFX.pptxCebaBaby dropshipping via API with DroFX.pptx
CebaBaby dropshipping via API with DroFX.pptx
 
Carero dropshipping via API with DroFx.pptx
Carero dropshipping via API with DroFx.pptxCarero dropshipping via API with DroFx.pptx
Carero dropshipping via API with DroFx.pptx
 
Industrialised data - the key to AI success.pdf
Industrialised data - the key to AI success.pdfIndustrialised data - the key to AI success.pdf
Industrialised data - the key to AI success.pdf
 

Plot3D Package and Example in R.-Data visualizat,on

  • 1. Prepared by Volkan OBAN Plot3D package in R and examples,etc. Reference: http://www.sthda.com/english/wiki/impressive-package-for-3d-and-4d-graph-r- software-and-data-visualization text3D: plot 3-dimensionnal texts The function text3D() is used as follow: text3D(x, y, z, labels, ...) The USArrests data sets will be used in the example below: data(USArrests) with(USArrests, text3D(Murder, Assault, Rape, labels = rownames(USArrests), colvar = UrbanPop, col = gg.col(100), theta = 60, phi = 20, xlab = "Murder", ylab = "Assault", zlab = "Rape", main = "USA arrests", cex = 0.6, bty = "g", ticktype = "detailed", d = 2, clab = c("Urban","Pop"), adj = 0.5, font = 2))
  • 2.
  • 3. # Plot texts with(USArrests, text3D(Murder, Assault, Rape, labels = rownames(USArrests), colvar = UrbanPop, col = gg.col(100), theta = 60, phi = 20, xlab = "Murder", ylab = "Assault", zlab = "Rape", main = "USA arrests", cex = 0.6, bty = "g", ticktype = "detailed", d = 2, clab = c("Urban","Pop"), adj = 0.5, font = 2)) # Add points with(USArrests, scatter3D(Murder, Assault, Rape - 1, colvar = UrbanPop, col = gg.col(100), type = "h", pch = ".", add = TRUE)) plotdev(xlim = c(0, 10), ylim = c(40, 150), zlim = c(7, 25))
  • 4. Histogram3D data(VADeaths) # hist3D and ribbon3D with greyish background, rotated, rescaled,... hist3D(z = VADeaths, scale = FALSE, expand = 0.01, bty = "g", phi = 20, col = "#0072B2", border = "black", shade = 0.2, ltheta = 90, space = 0.3, ticktype = "detailed", d = 2)
  • 5. hist3D (x = 1:5, y = 1:4, z = VADeaths, bty = "g", phi = 20, theta = -60, xlab = "", ylab = "", zlab = "", main = "VADeaths", col = "#0072B2", border = "black", shade = 0.8, ticktype = "detailed", space = 0.15, d = 2, cex.axis = 1e-9) # Use text3D to label x axis text3D(x = 1:5, y = rep(0.5, 5), z = rep(3, 5), labels = rownames(VADeaths), add = TRUE, adj = 0) # Use text3D to label yaxis text3D(x = rep(1, 4), y = 1:4, z = rep(0, 4), labels = colnames(VADeaths), add = TRUE, adj = 1)
  • 6.
  • 7.
  • 9. Example: x0 <- c(0, 0, 0, 0) > y0 <- c(0, 0, 0, 0) > z0 <- c(0, 0, 0, 0) > x1 <- c(0.89, -0.46, 0.99, 0.96) > y1 <- c(0.36, 0.88, 0.02, 0.06) > z1 <- c(-0.28, 0.09, 0.05, 0.24) > cols <- c("#1B9E77", "#D95F02", "#7570B3", "#E7298A") > arrows3D(x0, y0, z0, x1, y1, z1, colvar = x1^2, col = cols, + lwd = 2, d = 3, clab = c("Quality", "score"), + main = "Arrows 3D", bty ="g", ticktype = "detailed") > # Add starting point of arrow > points3D(x0, y0, z0, add = TRUE, col="darkred", + colkey = FALSE, pch = 19, cex = 1) > # Add labels to the arrows > text3D(x1, y1, z1, c("Sepal.L", "Sepal.W", "Petal.L", "Petal.W"), + colvar = x1^2, col = cols, add=TRUE, colkey = FALSE)
  • 10. EXAMPLE: data(iris) x <- iris$Sepal.Length y <- iris$Petal.Length z <- iris$Sepal.Width scatter3D(x, y, z, pch = 18, bty = "u", colkey = FALSE, + main ="bty= 'u'", col.panel ="steelblue", expand =0.4, + col.grid = "darkblue")
  • 11.
  • 12. > scatter3D(x, y, z, bty = "g", pch = 18, col = gg.col(100)) > # ramp.col: custom palettes > scatter3D(x, y, z, bty = "g", pch = 18, + col = ramp.col(c("blue", "yellow", "red")) )
  • 13. > scatter3D(x, y, z, phi = 0, bty = "g", + pch = 20, cex = 2, ticktype = "detailed")
  • 14. scatter3D(x, y, z, phi = 0, bty = "g", type = "l", ticktype = "detailed", lwd = 4)
  • 15. scatter3D(x, y, z, phi = 0, bty = "g", type = "h", + ticktype = "detailed", pch = 19, cex = 0.5)
  • 16. > x <- mtcars$wt > y <- mtcars$disp > z <- mtcars$mpg > # Compute the linear regression (z = ax + by + d) > fit <- lm(z ~ x + y) > # predict values on regular xy grid > grid.lines = 26 > x.pred <- seq(min(x), max(x), length.out = grid.lines) > y.pred <- seq(min(y), max(y), length.out = grid.lines) > xy <- expand.grid( x = x.pred, y = y.pred) > z.pred <- matrix(predict(fit, newdata = xy), + nrow = grid.lines, ncol = grid.lines) > # fitted points for droplines to surface > fitpoints <- predict(fit) > # scatter plot with regression plane > scatter3D(x, y, z, pch = 18, cex = 2, + theta = 20, phi = 20, ticktype = "detailed", + xlab = "wt", ylab = "disp", zlab = "mpg", + surf = list(x = x.pred, y = y.pred, z = z.pred, + facets = NA, fit = fitpoints), main = "mtcars")