1. The first question about a project plan should be – has it been designed?
Global Project Design (GPD) provides a capability – called Project Design -- to rapidly create and
evaluate project plans that are realistic and reliable. The plans are designed by the teams (project
managers, stakeholders and other members on the project team) on the project -- including
schedule, cost, use of constrained resources, and risk management. In a collaborative, visual
modeling session the participants capture a model oft he project plus the full impact of changes,
variation in assumptions, architecture, and other real-world execution parameters.
With Project Design teams develop a model of a project which integrates three fundamental
systems: products, processes, and teams. A graphical depiction of the relationship amongst these
three promotes a common view shared by management and project/program teams. A simulation
engine, based on the model, generates forecasts with analysis across many scenarios. These
forecasts provide root cause based detail of likely outcomes, including progress, risks, costs, quality,
and schedule (e.g. Gantt charts are output, not input). GPD’s approach provides a powerful design
space trade-off capability that delivers rapid and rigorous analysis of options. The value is a high
degree of certainty in meeting product functionality, schedule and cost objectives.
Design is an iterative and social process -- the evaluation of choices and outcomes early-on, before
committing to a course of action. By rapidly exploring possibilities -- through dialogue, analysis, and
prototyping -- awareness is built and better results are achieved. As things change (they always do,
don't they?) a good design is easily adjusted. Project Design is this forward-looking capability applied
to the complex portfolio and programs typical today. Much like design practices and tools
revolutionized the product development of companies (e.g. 3D visualization, parametric modeling,
QFD, CAD, CAE), Project Design is transforming awareness, speed, and performance of teams.
GPD’s TeamPortTM
is a method and platform to support Project Design. The platform enables
collaborative visual capture of the product, process, and team architectures for a proposed project or
program. These architectures emerge similarly to traditional work breakdown structures, integrated
master plans, and workflow. They differentiate themselves by the high degree of consistency and
completeness that can be achieved at an agreed to and meaningful level of granularity. The
TeamPortTM
software platform further allows the user to subsequently track the evolution of
2. projects and better understand the impact of any changes in key assumptions, requirements, scope,
progress, uncertainty, skills, utilization, and processes.
In a workshop spanning several days working with a GPD team, the major stakeholders and team
leaders bring their specific skills, experience, and knowledge of the proposed project to the table.
Collaboratively the major elements of the three architectures are captured graphically. The GPD
team facilitates relying on its experience and modeling skills, supporting the workshop participants to
develop a realistic project model. The result is a project model representing the participants’ best
estimate of the overall scope including:
The product structure breakdown down to a level of granularity considered appropriate
(roughly equivalent to the notional functional breakdown structure plus other key elements
deemed necessary by the participants because of criticality),
A process structure consisting of all required activities/actions by the team members to
produce the required product (including dependencies amongst the activities and teams),
The organizational structure (geographical location including time zones, team skill levels,
roles and responsibilities, degree of availability, work schedules, etc.).
Specific features of global work are modeled including time zones, distributed decision-making,
concurrent and mutual dependence, communication patterns, and travel. Depending on the
complexity, size and, scope of the proposed project and number of participants in the initial
modeling session, a converged model can be generated in one to several days. Very early in the
workshop the participants understand how various areas of concern (team makeup, skills,
The figure illustrates a team dialog based on graphical relationships at a high level between the product breakdown
structure depicted by red squares, the work breakdown structure depicted by blue triangles and the organization
breakdown structure depicted by yellow circles. Lines (yellow) of responsibility between and among teams, mutual
and concurrent dependencies between work activities (black dashed curves) are shown; these can be hidden or
highlighted in layers for clarity when working with the model.
3. availability, role of time zones, to name a few) affect the overall design of the project. GPD has
shown that the overall sense of a complex, global project can be obtained without resorting to a very
detailed level of the equivalent work breakdown structure. Relevant knowledge, available to teams
early on, is captured while avoiding unavailable or unnecessary detail.
More details about Global Project Design, Project Design and TeamPortTM
can be found at:
www.teamport.com as well as direct questions to:
Dr. Bryan Moser, GPD President and Founder, bryan@gpdesign.com
Mr. Dai Ike, GPD Sr. Vice President, Japan, dai.ike@gpdesign.com
Dr. William Grossmann, GPD Sr. Vice President, Europe, william.grossmann@gpdesign.com
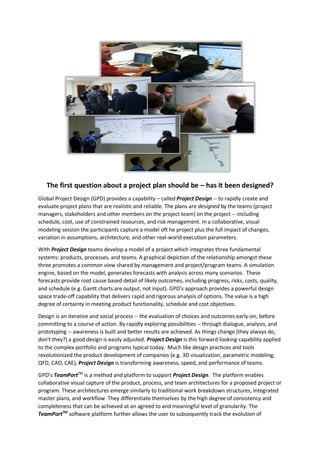
The figure shows a typical result of a TeamPortTM forecast. The pie chart denotes the effort in man-hours of the
various project teams and support organizations. The pie slice representing the engineers’ effort is further queried
(to the right of the pie chart) as to the distribution of activity across work, assistance, QA, rework, communications,
etc. A snapshot of a piece of a Gantt chart generated by the TeamPort TM simulator shows one teams work and
coordination on the schedule. The generated Gantt chart can also be queried according to teams and their
corresponding schedule for work, coordination, wait, etc.