First Observation of the Earth’s Permanent FreeOscillation s on Ocean Bottom ...
Kaiser & O'Keefe.2015.Comparison of detectors
1. Tools and Technology
Data Acquisition Varies by Bat Phonic Group
for 2 Types of Bat Detectors When
Weatherproofed and Paired in Field Settings
ZACHARY D. E. KAISER, Center for Bat Research, Outreach, and Conservation, Department of Biology, Indiana State University, Terre Haute,
IN 47809, USA
JOY M. O’KEEFE,1
Center for Bat Research, Outreach, and Conservation, Department of Biology, Indiana State University, Terre Haute, IN 47809,
USA
ABSTRACT Manufacturers of acoustic bat detectors use proprietary microphones with different frequency
responses, sensitivities, and directionality. Researchers implement various waterproofing strategies to protect
microphones from inclement weather. These factors cause different detector models to have unique sampling
areas and likely results in dissimilar data recording. We tested whether SM2BATþ (SM2) and Anabat SD2
(Anabat) bat detectors record dissimilar data when weatherproofed in a manner suitable for long-term passive
sampling. We deployed detectors at 71 random points near Indianapolis, Indiana (USA), from May to
August, 2012–2013. We used 458 polyvinyl chloride tubes to weatherproof directional Anabat microphones
and the stock foam shielding to cover omnidirectional SM2 microphones. Anabat and SM2 microphones
were paired at 2-m and 5-m heights. We adjusted file parameters to make Anabat and SM2 data comparable.
We identified files to phonic group (low, midrange, and Myotis) using Bat Call ID software. The effects of
detector type, phonic group, height, and their interactions on mean files recorded per site were assessed using
generalized estimating equations and least-significant-differences pairwise comparisons. Anabats recorded
more low and midrange files, but fewer Myotis files per site than did SM2s. When comparing the same model
of detectors, deployment height did not affect data acquisition. Weatherproofing may limit the ability of
Anabats to record Myotis, but Anabat microphones may have greater detection ranges for low and midrange
bats. We demonstrated that the ability to record bat calls in different frequency ranges varies with
microphone type and weatherproofing strategy, which implies that best practices for presence–absence
surveys may also vary for bats in different phonic groups. Ó 2015 The Wildlife Society.
KEY WORDS acoustic monitoring, Anabat SD2, bats, BCID, echolocation, generalized estimating equations, phonic
group, SM2BATþ, ultrasonic microphone.
Insectivorous bats of eastern North America are nocturnal,
volant, and exceptionally agile in cluttered landscapes;
consequently, these small mammals are extremely difficult
to study. Capture techniques (e.g., mist-netting), which are
labor-intensive and oftentimes low-yielding, have tradition-
ally provided biologists with information about the presence
or absence of bat species within particular habitats (Kunz and
Kurta 1988, O’Farrell and Gannon 1999). However, with
population declines of many bat species across North
America due to habitat loss and degradation (Weller et al.
2009), wind-energy-related fatalities (Arnett and Baerwald
2013), and the white-nose syndrome fungal disease (Cryan
et al. 2013), sampling via capture techniques has become
increasingly ineffective. Ultrasonic bat-detector technologies
provide viable alternatives for studying presence–absence or
the relative activity of bat species (Murray et al. 1999,
O’Farrell and Gannon 1999, Staton and Poulton 2012). Bat
detectors sample larger areas and often record higher species
richness than do capture techniques (Murray et al. 1999,
O’Farrell and Gannon 1999). Furthermore, certain bat-
detector models can record autonomously (Miller 2001),
which allows numerous areas to be sampled simultaneously
with minimal effort (Gorresen et al. 2008). Accordingly,
acoustic monitoring via bat detectors has become a popular
research method; however, limitations of this sampling
technique, if not addressed, may result in incorrect
conclusions and hinder effective management.
Acoustic bat detectors suffer from unavoidable sampling
biases (Murray et al. 1999, O’Farrell and Gannon 1999,
Hayes 2000). Bat detectors sample finite airspaces; thus, only
a limited area exists in which echolocating bats will be
detected (Limpens and McCracken 2004). The size of the
airspace a bat detector samples (henceforth, “sampling area”)
Received: 6 June 2014; Accepted: 11 April 2015
1
E-mail: joyokeefe@gmail.com
Wildlife Society Bulletin; DOI: 10.1002/wsb.572
Kaiser and O’Keefe Data Acquisition by Bat Detectors 1
2. is a function of microphone design and local recording
conditions. Sampling areas are dictated by the microphone’s
sensitivity (Larson and Hayes 2000), frequency response
(Waters and Walsh 1994, Adams et al. 2012), directionality
(Downes 1982, Waters and Walsh 1994, Limpens and
McCracken 2004), and weatherproofing (Britzke et al. 2010,
Sprong et al. 2012), as well as environmental factors that
affect the transmission of sound waves through air (Limpens
and McCracken 2004). Climatic conditions influence the
rate at which sound attenuates in air (Griffin 1971, Lawrence
and Simmons 1982, Pettersson 2004), thereby affecting the
size of the sampling area. Clutter (e.g., vegetation) creates
interference (Schnitzler and Kalko 2001, Broders et al. 2004,
Obrist et al. 2011) by refracting, reflecting, or scattering
ultrasounds (Pettersson 2004), and the orientation of the
microphone in relation to clutter affects the size of the
sampling area (Limpens and McCracken 2004). Detectors
deployed in uncluttered environments have larger sampling
areas and record higher relative bat activity than do detectors
placed near vegetation (Weller and Zabel 2002).
The data-acquisition abilities of bat detectors are dictated
by relationships between the microphones’ sampling area and
its response to varying sound-sources in dynamic environ-
mental and atmospheric conditions (Limpens and
McCracken 2004). The amount of bat activity a detector
will record varies due to the amplitude, frequency, and signal
type of the emitted ultrasounds (Downes 1982, Forbes and
Newhook 1990, Limpens and McCracken 2004, Adams
et al. 2012). High-frequency sounds attenuate more rapidly
and travel shorter distances in air than do low-frequency
sounds (Lawrence and Simmons 1982, Parsons 1996,
Pettersson 2004). Broadband frequency-modulated signals
have lower source amplitudes and, thus, travel shorter
distances than do narrowband constant-frequency or quasi-
constant-frequency calls (Schnitzler and Kalko 2001,
Limpens and McCracken 2004). Therefore, it may be
more difficult to detect species with high-frequency
frequency-modulated calls (e.g., Myotis septentrionalis)
than species with low-frequency quasi-constant-frequency
calls (e.g., Lasiurus cinereus); however, it is important to
consider that detectability is largely influenced by the
distance of the sound source from the microphone (Corben
and Fellers 2001) because of the effects of geometric
spreading and atmospheric absorption (Lawrence and
Simmons 1982, Pettersson 2004).
There are several factors that affect the capabilities of bat
detectors when deployed in field settings. Experiments
suggest that detector height (Staton and Poulton 2012), the
orientation and elevation of the microphone in relation to
clutter (Weller and Zabel 2002), as well as microphone
sensitivity (Waters and Walsh 1994, Larson and Hayes 2000,
Adams et al. 2012) and weatherproofing (Britzke et al. 2010,
Sprong et al. 2012) influence data acquisition. Although
studies have shown that detectors of the same model can vary
in their capabilities (Larson and Hayes 2000, Weller and
Zabel 2002, Britzke et al. 2010, Sprong et al. 2012), we still
have only limited information on differences in data
acquisition across different models or brands (especially
those released in the past decade due to the rapid growth of
the commercial market for bat detectors). Manufacturers of
acoustic bat detectors use distinct hardware components,
including proprietary microphones (Waters and Walsh 1994,
Pettersson 2004, Adams et al. 2012). Consequently,
sampling areas and detection ranges vary between different
detector models (Parsons 1996, Adams et al. 2012, Sprong
et al. 2012) and, therefore, data acquisition will also likely
vary (Waters and Walsh 1994).
To our knowledge, only a few studies have compared bat
detectors produced by different manufacturers (e.g., Forbes
and Newhook 1990, Waters and Walsh 1994, Parsons 1996,
Adams et al. 2012, Sprong et al. 2012), and with the
exception of Sprong et al. (2012), no study accounted for the
effects of weatherproofing on data acquisition. Waters and
Walsh (1994) found that detectors with greater microphone
sensitivities consistently recorded more bat calls per hour and
Parsons (1996) found significant differences among brands
in regard to minimum and maximum detection distances.
More recently, D. Solick (Western Ecosystems Technology,
Inc., personal communication) demonstrated that Wildlife
Acoustics SM2BATþ (Wildlife Acoustics, Inc., Concord,
MA) and Pettersson D500x (Pettersson Elektronik AB,
Uppsala, Sweden) full-spectrum detectors could not replicate
the data-acquisition abilities of an Anabat SD1 (Titley
Scientific, Inc., Columbia, MO), which is a frequency
division detector. The differences observed were likely due to
incompatible software features or microphone differences.
Adams et al. (2012), using both ultrasonic playbacks and field
recordings, determined that variation in directionality and
microphone frequency responses led to performance differ-
ences among 5 models of modern bat detectors. In this same
study, SM2s outperformed Anabat SD2s; however, these
systems were not weatherproofed when field-tested. Sprong
et al. (2012), also using ultrasonic playbacks in a controlled
setting, demonstrated that the effects of weatherproofing
vary by detector model and microphone type. Because earlier
field studies did not account for the effects of varying
weatherproofing strategies on recordings of free-flying bats,
further research is required.
We initiated a field study near Indianapolis, Indiana, USA,
to compare data acquisition between 2 types of automated
bat detectors: the Wildlife Acoustics SM2BATþ (hence-
forth, “SM2”) and Anabat SD2 (henceforth, “Anabat”;
Titley Scientific, Inc.). We chose Anabats and SM2s because
these 2 models are widely used for passive acoustic sampling,
and they vary greatly in terms of microphone design,
technical specifications, and weatherproofing strategies.
SM2s use omnidirectional microphones with porous,
foam, weatherproof coverings, whereas Anabats use direc-
tional microphones that are often weatherproofed in
impermeable polyvinyl chloride (PVC) tubes. Thus, each
has a distinct sampling area attributable to microphone
design, directionality, and weatherproofing. We aimed to
determine whether these 2 models, when deployed side-by-
side in the field and weatherproofed in a manner suitable for
long-term passive sampling, would record similar numbers of
echolocation files per phonic group. Overall, we expected
2 Wildlife Society Bulletin 9999
3. that data acquisition for these detectors would be dissimilar.
Also, like Weller and Zabel (2002), we aimed to determine
how microphone elevation influences data acquisition for
each detector type. We expected that microphones elevated
higher above understory vegetation would record more bat
activity than would microphones deployed nearer to the
ground.
STUDY AREA
This study was conducted on 1,045 ha of property west–
southwest of the Indianapolis International Airport between
the cities of Mooresville and Plainfield, Indiana (Fig. 1). The
East Fork of White Lick Creek, an 84-km-long perennial
stream, flowed south through the study site (Whitaker et al.
2004). Interstate 70 (I-70), running northeast–southwest,
divided the study site into “northern” and “southern”
sections, with State Road 67 forming the eastern and
southern borders, and State Road 267 forming the western
border (Fig. 1). The study site north of I-70 was limited to a
narrow (50–200-m-wide), forested riparian corridor, because
the surrounding landscape was heavily developed with
airport runways and busy highways to the east, a warehouse
district to the west, residential subdivisions to the north, and
large electrical substations and accompanying power lines to
the south. Anthropogenic activity was commonplace and
commercial planes flew within a few hundred meters of the
Figure 1. Location of 71 acoustic sampling points (black dots) near a riparian corridor west of Indianapolis International Airport in central Indiana, USA,
surveyed from May to August 2012 and 2013. The black polygon delineates the potential foraging area for Indiana bats (Myotis sodalis), which was derived from
combined foraging telemetry data from 2002 to 2011.
Kaiser and O’Keefe Data Acquisition by Bat Detectors 3
4. tree canopy throughout the night. Agricultural lands
dominated the study site south of I-70, although parcels
of land have been permanently set aside as forested wildlife
refuges, replanted wetlands or forests, or local parks available
for recreation (Sparks et al. 2009). Overall, the area in and
around the study site had been heavily modified by human
activities and consisted of numerous fragmented land-cover
types, including farmland, wetlands, pasture–grasslands,
residential–commercial developments, forested riparian
corridors, and remnant deciduous forests.
Since 1996, the study site has been home to a long-term
study of the summer foraging and roosting ecology of the
federally endangered Indiana bat (Myotis sodalis; Whitaker
et al. 2004). From 1997 to 2013, 9 bat species have been
regularly captured in mist nets in the study area, including
big brown bats (Eptesicus fuscus), silver-haired bats (Lasio-
nycteris noctivagans), hoary bats (Lasiurus cinereus), eastern
red bats (Lasiurus borealis), evening bats (Nycticeius humer-
alis), tri-colored bats (Perimyotis subflavus), northern long-
eared bats (M. septentrionalis), little brown bats (M.
lucifugus), and Indiana bats (Whitaker et al. 2004, O’Keefe
et al. 2014).
MATERIALS AND METHODS
We combined 95% minimum convex polygons, derived from
foraging telemetry data collected for Indiana bats in previous
years (2002–2011; Sparks et al. 2005, J. Whitaker, Indiana
State University, personal communication), to create a single
polygon in ArcMap 10.0 that outlined potential Indiana bat
foraging habitat within our study site (Fig. 1). Using
ArcMap, we generated random points within this polygon to
represent potential sampling locations. We used an aerial
map to manually discard random points that were
inaccessible (e.g., located on private property, buildings,
roadways, or within agricultural fields). The remaining
random points were numbered sequentially and sampling
order was determined using a random number generator. If
sampling locations were determined to be inadequate when
in the field, the next random point was used. Our sampling
effort was generally restricted because private property and
human activity was so commonplace within the study site.
Therefore, we discarded locations where bat detector
equipment was in jeopardy of being stolen or tampered
with (e.g., public parks) or damaged (e.g., active cow
pastures). From 16 May to 6 August 2012 and 15 May to 7
August 2013, we deployed bat detectors at 71 random points
within this polygon, sampling 35 sites in 2012 and 36 sites in
2013. We sampled in several land-cover types, including
wetland–riparian areas (31% of our sampling effort),
deciduous forests (28%), pasture–grasslands (21%), replanted
forests 20 years old (16%), and farmlands (4%). We did not
sample land-cover types in proportion to their availability on
the landscape.
We used omnidirectional SMX-US microphones (Wildlife
Acoustics, Inc., Concord, MA) and directional High Mount
(Titley Scientific, Columbia, MO) microphones with the
SM2s and Anabats, respectively. Wildlife Acoustics released
a directional horn for the SMX-US microphone after we
began collecting data in 2012 and, thus, we were unable to
test this directional set-up during our study. To reduce
sampling-area variation among the Anabat units we
deployed, each season we calibrated microphones in
accordance with Larson and Hayes (2000) using a constant
40-kHz tone emitted from an Anabat Chirper (Titley
Scientific). Anabats and microphones were purchased in
2011 and sensitivity settings ranged from 5.5 to 6.5. At the
time of this study, there were no published methods for
calibrating SM2 microphones; however, we purchased all
detectors prior to beginning fieldwork in 2012 and used new
SM2 microphones each year. Anabats recorded zero-
crossing data with a division ratio of 8. SM2s recorded
monaural, full-spectrum data with a bit depth of 16, a
sampling rate of 384,000 kHz, and a WAC0 audio
compression. The following settings were used with the
SM2, trigger: trig left ¼ 18 dB, trig win left ¼ 2.0 s; gain:
48 dB, left microphone ¼ þ0.0 dB; high-pass filter: HPF
left ¼ fs/24; and low-pass filter: LPF left ¼ OFF. We
programmed detectors to passively record from predusk
(2000 hr EDT) until postdawn (0800 hr EDT) each night
for 2 consecutive detector-nights at each sampling point. A
detector-night was defined as one uninterrupted night of
recording. We included data in our analyses only if a full
detector-night of sampling was achieved; and in 2012 and
2013 we discarded 2 nights and 16 nights of sampling,
respectively, because of Anabat malfunctions. Consequently,
we only included data from 33 of 36 sites sampled in 2013 in
our analysis.
We paired one Anabat with one SM2 at each of 35 points
in 2012, and 2 Anabats with 2 SM2s at each of 36 points in
2013. To replicate current protocols for passive acoustic
monitoring studies, we used what we have observed (via
published research, e.g., Britzke et al. 2010, and presenta-
tions at regional and national bat conferences) to be the most
popular weatherproofing solution for each detector type. We
used the foam shielding included with SMX-US micro-
phones and placed Anabat microphones in 458 PVC tubes
(Britzke et al. 2010). To record the best calls possible, we
selected a point with the least amount of clutter 25 m from
the random point and oriented microphones toward
potential bat flyways (Larson and Hayes 2000). From 16
May to 6 August 2012, we employed a double-observer
method similar to Duchamp et al. (2006), with one SM2 and
one Anabat paired and programmed to record simultaneous-
ly at each sampling site. Each microphone was connected to
its respective detector with a 10-m cable and elevated 2 m on
a metal post (Weller and Zabel 2002). Each Anabat
microphone was positioned 15 cm above the SM2 micro-
phone to reduce the Anabat’s PVC enclosure from blocking a
large portion of the SM2’s sampling area; we assumed this
distance was negligible in terms of differences in sampling
space for the 2 microphones (Fig. 2). From 15 May to 7
August 2013, we used a similar set-up, but we added a second
SM2–Anabat pairing at 5 m above ground, again with
Anabat microphones positioned 15 cm above SM2 micro-
phones. On account of concerns about theft or disturbance to
our research efforts in the open environment where we
4 Wildlife Society Bulletin 9999
5. worked, we did not feel comfortable testing a microphone
height 5 m. We used identical microphone orientations for
the SM2–Anabat pairings at both 2-m and 5-m heights, and
we randomly determined each coupling of detectors prior to
deployment. To simplify discussion, 2-m microphone
elevations are referred to as “low” and 5-m microphone
elevations are referred to as “high.”
Echolocation Data Analysis
For this study, a bat call, also referred to as a “file,” is defined
as a series of !3 consecutive echolocation pulses emitted by a
single bat (Ford et al. 2005). A pulse is defined as a single
echolocation sound wave within the larger bat call. Using
WAC2WAV 3.3.0 (Wildlife Acoustics, Inc.) software, we
converted full-spectrum SM2 data to zero-crossing format
with parameters identical to those of the Anabat (division
ratio ¼ 8, max. file duration ¼ 15 sec, and min. time between
calls ¼ 2 sec). We applied the SMX-US-to-UT filter in
WAC2WAV to achieve a flatter frequency response, as
suggested by Wildlife Acoustics (J. King, Wildlife Acoustics,
Inc., personal communication). We used Bat Call ID 2.5b
(henceforth, “BCID”; Bat Call Identification, Inc., Kansas
City, MO) automated software to identify bat call files to 1 of
3 phonic groups (low, midrange, or Myotis; Romeling et al.
2012). The software referred to a call library for bats that
occur in Indiana (1,546 calls of 9 species), required a
minimum of 3 pulses within 15 seconds for file identification
(Romeling et al. 2012), and reported a conservative !90%
phonic-group confidence level. BCID categorized files into
phonic groups based on a clustering algorithm and call
parameters such as duration, minimum frequency, slope at
the flattest portion of the call, and frequency at the knee of
the call (R. Allen, Bat Call Identification, Inc., personal
communication; e.g., Romeling et al. 2012). The low phonic
group (min. call frequencies 30 kHz) contained E. fuscus, L.
noctivagans, and L. cinereus; the midrange phonic group
(non-Myotis bats with min. frequency 30, but 50 kHz)
contained L. borealis, N. humeralis, and P. subflavus; and the
Myotis phonic group (min. call frequencies between 30 and
60 kHz) contained M. lucifugus, M. septentrionalis, and M.
sodalis (Romeling et al. 2012). We excluded M. leibii and M.
grisescens from BCID analyses because these species have not
been regularly captured with mist nets in the study site over
the past 15 years (Whitaker et al. 2006, J. O’Keefe,
unpublished data). We excluded files that could not be
identified to phonic group by BCID because of insufficient
pulse counts or poor call quality.
Statistical Analyses
We conducted separate analyses on the data we collected in
2012 and 2013. For 2012, we compared low Anabat
microphones versus low SM2 microphones (i.e., both
elevated 2 m). For each phonic group, we tallied the total
number of files recorded per night for each detector type
from the BCID outputs. We then calculated the mean file
count per night per phonic group per sampling site for each
detector. We used generalized estimating equation models,
accounting for repeated measures by site, with a negative
binomial distribution and log link to test the effects of phonic
group, detector type, and their interaction on mean file count
per site per detector type (response variable). We conducted a
similar analysis for 2013 data, but added height and its
corresponding 2-way and 3-way interactions as independent
factors. We used least-significant-differences pairwise
comparisons to compare responses for significant tests.
We used SPSS 20.0.0 (IBM Corporation, Armonk, NY) for
all tests and assessed significance at a ¼ 0.05.
RESULTS
Anabats recorded 10,092 identifiable bat calls over the course
of the study, whereas SM2s recorded 5,888 identifiable bat
calls (Table 1). We recorded more identifiable files for both
detectortypesin2013(whenwedeployeddetectorsatboth2 m
and5 m;Table1), butinboth years a greater proportion offiles
were identifiable from Anabat recordings. For SM2s, BCID
could not identify 43.1–51.7% of all files recorded, whereas
BCID couldnot identify38.6–44.6% ofall Anabat files.These
percentages do not include nonbat files (e.g., noise), because
these files were discarded by BCID’s default filter.
In 2012, data acquisition varied by detector type, phonic
group, and detector type  phonic group (P 0.002;
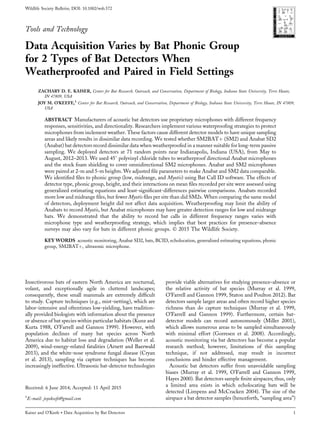
Figure 2. Acoustic sampling points were surveyed for bats from May to
August 2012 and 2013 in central Indiana, USA. Acoustic microphones were
set up such that Anabat microphones housed in 458 polyvinyl chloride tubes
were 15 cm above SM2 microphones. We paired one Anabat microphone
with one SM2 microphone at 2 m above ground in 2012 and, in 2013, we
added a second SM2-Anabat pairing at 5 m above ground.
Kaiser and O’Keefe Data Acquisition by Bat Detectors 5
6. Table 2). Anabats recorded more files from all phonic groups
combined (x ¼ 13.72 Æ 3.14 files/site/night) than SM2s
(9.05 Æ 2.28). Low-phonic-group calls were recorded most
often by both detectors, followed by midrange calls, and then
Myotis (Fig. 3A). However, least-significant-differences
pairwise comparisons showed that differences were only
statistically significant for low versus Myotis (P ¼ 0.008) and
midrange versus Myotis (P ¼ 0.011). Odds ratios indicated
that, relative to Myotis, low- and midrange-phonic-group
calls were 3.8 times and 2.1 times more likely to be recorded,
respectively. When considering the detector type  phonic
group interaction, Anabats recorded more low (x difference
¼ 22.3 Æ 9.9, P ¼ 0.023) and midrange calls (x difference
¼ 14.3 Æ 4.4, P ¼ 0.001) than SM2s, but recorded fewer
Myotis calls than SM2s (x difference ¼ À1.8 Æ 0.7,
P ¼ 0.013; Fig. 3A).
In 2013, detector type was not a significant factor in
explaining differences in data acquisition (P ¼ 0.754;
Table 2). Anabats and SM2s recorded, on average, similar
mean file counts per site per night (7.26 Æ 1.24 and
7.03 Æ 1.43, respectively). However, data acquisition did
vary by phonic group and detector type  phonic group in
2013 (P 0.001; Table 2). As in 2012, low-phonic-group
calls were recorded most often by both detectors, followed by
midrange calls, and then Myotis. Significant differences were
observed between each phonic group pair (Fig. 3B). Relative
to Myotis, the odds of recording low- and midrange-phonic-
group calls were 14.7 and 3.6 times greater, respectively;
whereas odds of recording low-phonic-group calls were 2.6
times greater relative to midrange calls. The detector
type  phonic group effect was similar to 2012; Anabats
recorded more low (x difference ¼ 10.7 Æ 3.6, P ¼ 0.003) and
midrange calls (x difference ¼ 6.6 Æ 1.5, P 0.001) than
SM2s, but recorded fewer Myotis calls than SM2s (x
difference ¼ À1.2 Æ 0.4, P ¼ 0.004; Fig. 3B). Height and its
2-way and 3-way interactions were not significant factors
explaining differences in data acquisition (Table 2). When
comparing between detector types, Anabats and SM2s
performed similarly at both 2-m and 5-m heights (Table 1;
Fig. 4).
DISCUSSION
As expected, the omnidirectional SMX-US microphone of
the SM2BATþ and the directional High Mount micro-
phone of the Anabat SD2 recorded different mean file counts
per site for all phonic groups. Although we did not directly
test for the source of this variability, the observed data-
acquisition differences are likely attributable to a combina-
tion of directionality (Waters and Walsh 1994), the
interaction between frequency response and directionality
(Adams et al. 2012), and weatherproofing differences
(Britzke et al. 2010, Sprong et al. 2012). Overall, Anabats
recorded more identifiable bat calls than SM2s when
weatherproofed, but the relative performance of each
detector type varied by phonic group. Although our results
contrast with earlier comparative studies of bat detectors
(e.g., Adams et al. 2012), the observed disparities likely relate
to differences in methods and study environments. We
observed that slight differences in detector height may
matter less than differences in detector models when
designing passive acoustic studies.
Table 1. Total number of identifiable bat files and mean (ÆSE) bat files recorded per night by phonic group for Anabat SD2 and SM2BATþ acoustic
detectors deployed at sites near the Indianapolis International Airport in central Indiana, USA, May to August 2012 and 2013. Anabat and SM2 data are
presented for low (2-m) and high (5-m) microphone elevations.
Total bat files recorded Mean bat files recorded (ÆSE)
Phonic group Phonic group
Year Mic ht Detector No. of sites sampled No. of nights sampled Low Mid Myotis Low SE Mid SE Myotis SE
2012 Low Anabat 35 68 1,812 1,606 164 39.8 12.1 23.7 7.2 2.7 0.7
SM2 35 68 771 619 263 17.5 7.7 9.3 3.0 4.5 1.2
2013 Low Anabat 33 61 2,337 1,012 46 35.8 10.2 14.1 3.8 0.8 0.2
SM2 33 61 1,288 636 152 20.1 7.1 8.7 3.7 2.4 0.8
High Anabat 33 63 2,111 965 39 31.4 7.9 13.9 2.8 0.8 0.2
SM2 33 63 1,622 444 93 26.0 9.4 6.3 1.7 1.8 0.4
Table 2. Significance tests for generalized estimating equation models for differences in data acquisition by bat detectors deployed near the Indianapolis
International Airport in central Indiana, USA, May to August 2012 and 2013.
2012 2013
(2-m mics; 35 sites) (2-m and 5-m mics; 33 sites)
Effect df Wald x2
P df Wald x2
P
Detector type 1 9.326 0.002 1 0.098 0.754
Phonic group 2 29.144 0.001 2 75.898 0.001
Detector type  phonic group 2 76.725 0.002 2 28.216 0.001
Height 1 0.375 0.540
Height  detector type 1 0.186 0.666
Height  phonic group 2 2.594 0.273
Height  phonic group  detector type 2 3.393 0.183
6 Wildlife Society Bulletin 9999
7. Both Anabats and SM2s recorded low-phonic-group files
most often, followed by midrange bat calls, and lastly Myotis.
Differences in detection rates for these 3 phonic groups may
relate to both the capabilities of bat detectors and to
disproportionate detectability and species abundance among
phonic groups. Low-frequency ultrasounds travel farther in air
and attenuate less rapidly than high-frequency ultrasounds
(Lawrence and Simmons 1982, Parsons 1996, Pettersson
2004). Furthermore, broadband frequency-modulated signals
used by Myotis bats have lower source amplitudes and travel
shorter distances than the quasi-constant-frequency or
frequency-modulated calls used by low and midrange
frequency bats (Schnitzler and Kalko 2001, Limpens and
McCracken 2004). Consequently, when surveying with
acoustic bat detectors, we are more likely to detect low-
phonic-group bats than high-frequency bats such as Myotis
species (Adams et al.2012).Itispossible that differencesinthe
relative abundance of bats in each phonic group may also
partially explain the observed variation by phonic group. For
example, low-phonic-group bats (i.e., primarily E. fuscus) are
captured most often within our study site, followed by
midrange species (i.e., L. borealis and P. subflavus), and lastly
Myotis species (O’Keefe et al. 2014). However, we note that
there are likely differences in the probability of detecting each
phonicgroupviacapturesurveys,becauseweavoidedsampling
in high-clutter areas where Myotis bats might be more active
(Aldrich and Rautenbach 1987, Owen et al. 2004), and some
speciesmaybelesssusceptibletocapturethanothers(O’Farrell
and Gannon 1999).
Overall, the observed data-acquisition inconsistencies
between the 2 detector models we tested are likely
attributable to microphone sensitivity, frequency response,
and directionality differences (Waters and Walsh 1994,
Adams et al. 2012), but weatherproofing strategies also
create variability (Britzke et al. 2010, Sprong et al. 2012, C.
Corben, www.hoarybat.com, Columbia, Missouri, personal
communication), especially in regard to recording specific
phonic groups. When Anabats and SM2s are weath-
erproofed in a manner typical of most long-term passive
Figure 3. Mean bat call files recorded per phonic group per site from May to August 2012 (A) and 2013 (B) for Anabat SD2 and SM2BATþ acoustic detectors
deployed at sites near the Indianapolis International Airport in central Indiana, USA. In each year, all possible pairwise comparisons were significantly different
for the detector type  phonic group interaction (P 0.05), as indicated by the different letters above each bar.
Figure 4. Mean bat call files recorded per phonic group by detector height
for Anabat SD2 and SM2BATþ acoustic detectors deployed at sites near the
Indianapolis International Airport in central Indiana, USA, May to
August 2013. We did not observe significant effects of detector height, nor
of its 2-way or 3-way interactions with detector type and phonic group.
Kaiser and O’Keefe Data Acquisition by Bat Detectors 7
8. acoustic monitoring studies, our results suggest that SMX-
US microphones detect more Myotis bat activity, but less
low- and midrange-phonic-group bat activity, than do
Anabats. The omnidirectional SMX-US is capable of
recording echolocating bats with flight paths above, below,
and behind the microphone. The greater directionality of an
Anabat microphone (relative to the SMX-US) limits its
ability to sample areas not directly in front of the microphone
(Sprong et al. 2012) and the PVC weatherproofing enclosure
likely further exacerbates this phenomenon. For example,
Sprong et al. (2012) found that Anabat SD2 microphones
without weatherproofing could not detect nearby (i.e., 1 m
from microphone) ultrasounds broadcasted 1808 behind the
microphone. Additionally, the foam weatherproofing of the
SMX-US is more permeable to sound than the PVC and,
thus, the SM2s used in our study were likely more exposed to
ultrasounds in the environment. A less directional and more
exposed microphone, such as the SMX-US, should
theoretically have a better chance of recording a low-
intensity Myotis call (or any bat call) before the call attenuates
(Waters and Walsh 1994). This correlates with our finding
that SM2s recorded more Myotis than did Anabats; however,
resonance created by the PVC tube likely further inhibited
the Anabat’s ability to record sounds above 40 kHz (i.e.,
Myotis bats in our study site; Corben 2011). This does not
explain why SM2s, on average, recorded fewer low- and
midrange-phonic-group files than did Anabats. Relative to
Myotis, low- and midrange-phonic-group calls possess
higher source amplitudes, travel farther in air, and are easier
to detect with bat detectors at greater distances (Lawrence
and Simmons 1982, Corben 2004). The fact that fewer low
and midrange bats were recorded by SM2s suggests that
Anabat microphones may be more sensitive to these
particular frequency ranges, and are capable of recording
these “louder” ultrasounds at distances outside the sampling
area of SM2s (Waters and Walsh 1994, Limpens and
McCracken 2004). In fact, Adams et al. (2012) observed that
SM2s had a greater rate of attenuation for low-frequency
ultrasounds (e.g., 25 kHz) relative to Anabats, which
supports the idea that the interaction between frequency
response and directionality influences data acquisition.
Our results differed from Solick et al. (2011) and Adams
et al. (2012) in 2 ways: 1) we recorded more files with
Anabats, whereas those studies recorded more files with
SM2s; and 2) we recorded more low- and midrange-
frequency calls with Anabats, whereas Adams et al. (2012)
recorded more low- and midrange-frequency calls (e.g.,
25 kHz and 55 kHz) with SM2s. It seems unlikely that
SMX-US microphones would sample farther than Anabats,
because omnidirectional microphones are typically less
sensitive than their directional counterparts (Waters and
Walsh 1994, Limpens and MacCracken 2004, Adams et al.
2012). Adams et al. (2012) attributed variation in data
acquisition to the abilities of specific detectors to detect
certain frequency ranges at varying distances from the
microphone. In the study by Adams et al. (2012), Anabats
did not record signals 85 kHz, whereas SM2s did; and
Anabats detected low-frequency ultrasounds (e.g., 25 kHz)
at greater distances than SM2s. This corresponds with our
finding that Anabats recorded fewer high-frequency Myotis
calls, but seemed to have greater detection ranges for low-
frequency sounds when compared with SM2s.
We attribute the disparity between our results and those of
Solick et al. (2011) and Adams et al. (2012) to differences
among our studies with respect to weatherproofing,
deployment height–microphone orientation, gain–trigger
settings (D. Solick, personal communication; Adams et al.
2012), data postprocessing, the use of artificial ultrasonic
calls by Adams et al. (2012), and the fact that each study was
conducted in a different environment (Parsons 1996). We
weatherproofed Anabats, paired microphones on a vertical
post and not in a horizontal plane, postprocessed data
differently (e.g., WAC0 conversion to zero-crossing format
using WAC2WAV software), and unlike Adams et al.
(2012) we did not use synthetic calls. In addition, each of
these studies was conducted in a different fine-scale space
and climatic region. Though necessary, making comparisons
across studies that occur in different field settings is
challenging because the rate at which sound attenuates—
and thus, the sampling area—will vary on account of
differences in climate and vegetation (Parsons 1996, C.
Corben, personal communication); further, local bat
assemblages also may be dissimilar.
Height (2 m vs. 5 m) did not affect the total number of bat
files recorded by either SM2s or Anabats. We expected
microphones elevated at greater heights above the
understory vegetation would record significantly more
bat activity (Weller and Zabel 2002, Staton and Poulton
2012); however, mean file counts per site were similar for
both detector types. We expected high SM2s to outperform
low SM2s, because many of the calls collected in 2012 with
2-m microphones were laden with noise, perhaps due to
close proximity to understory vegetation. However, 2-m
and 5-m SM2 microphones performed similarly in 2013,
suggesting that these microphones either had overlapping
sampling areas or they are just inherently sensitive to
environmental noise when deployed using their default
gain settings. Anabats at 2 m and 5 m heights also
performed similarly, which further suggests that a distance
of 3 m between microphones may be insubstantial for
discerning differences in bat activity due to overlapping
sampling areas. It is likely that we would have observed
more pronounced differences in bat activity if we had been
able to compare microphones deployed at more dissimilar
heights (Staton and Poulton 2012).
We postprocessed full-spectrum SM2 data to zero-crossing
format using WAC2WAV 3.3.0 software in order to match the
file parameters of Anabats, but we do not know whether
postprocessing data from one file format to another affects total
file counts. Originally, we intended to conduct a spectral analysis
and automatic identification of SM2 data using Sonobat 3.1 NE
(SonoBat, Arcata, CA); however, after one season of data
collection, we noticed that SM2 calls were burdened with noise
and audio distortion in the form of clipping. We struggled to
identify these data, and some bat calls were visually indiscernible
fromnoise.Wepostprocessedfull-spectrumfilestozero-crossing
8 Wildlife Society Bulletin 9999
9. format (required by BCID) in WAC2WAV, hoping BCID
could better distinguish bat calls from noise. When testing the
“skip noise” feature in WAC2WAV, many bat call files were
classified as noise. Therefore, we did not implement this feature,
but rather relied on the default BCID filter to remove files
containing noise. In 2013, we had the option to record directly in
zero-crossingformat withSM2s,whichwould haveresolvedthis
potential postprocessing issue. However, we were instructed by
Wildlife Acoustics that SM2s detect more bats in triggered wav
mode versus zero-crossing mode, so we continued with our 2012
methods. It is no longer possible to test the effects of
postprocessingwithWAC2WAV,becausethissoftwarepackage
has recently been retired by Wildlife Acoustics. Instead, we
recommend recording in the format best suited to your research
question and avoiding file conversions, if possible.
Acoustic bat detectors sample small areas over relatively
narrow periods of time and data acquisition among different
models may vary significantly (Waters and Walsh 1994,
Parsons 1996, Solick et al. 2011, Adams et al. 2012, this
study). However, different models, microphones, and
weatherproofing strategies will continue to be used, often
interchangeably, in bat research across the globe. Without a
complete understanding of the capabilities and limitations
of modern bat detectors, studies designed to assess bat
activity will yield inaccurate estimates and may undersample
some phonic groups or bat species. It is likely that passive
acoustic sampling will continue to play larger roles in future
bat-monitoring efforts, so decisions about acoustic equip-
ment and deployment could have significant effects on
species management. For instance, the U.S. Fish and
Wildlife Service has recently implemented major changes to
the summer survey protocol for the federally endangered
Indiana bat (USFWS 2015) by requiring passive acoustic
sampling using only directional microphones (e.g., Anabat
SD2, among other models). In this case, the stock SMX-US
omnidirectional microphone (without Wildlife Acoustic’s
directional horn) could not be used, even though our results
suggest this microphone detects more Myotis bat activity
than directional Anabat microphones housed in PVC. On
the other hand, Anabats may be better suited for acoustic
surveys at wind energy facilities if the target species are low-
and midrange-phonic-group bats (e.g., L. noctivagans, L.
cinereus, and L. borealis), which comprise the bulk of wind-
energy-related fatalities in North America (Arnett and
Baerwald 2013). These are merely 2 examples, but if we
want to better portray reality with acoustic sampling efforts,
it is imperative that further comparative studies be
conducted to determine the capabilities and limitations
of different bat-detector models and how each performs
relative to another. It is also crucial to develop a
standardized approach for weatherproofing systems, hard-
ware–software settings, and deployment techniques, if
possible. It is unlikely that any single methodology will
universally satisfy the research or management goals of all
acoustic studies (Adams et al. 2012), but minimizing
variation will undoubtedly be beneficial. Therefore, as
recommended by Adams et al. (2012), we also encourage
authors to present detailed information about their
methods, especially technical hardware–software settings
used with bat detectors.
Lastly, deploying a combination of bat detector models
may be the best option for reducing bias and obtaining more
accurate results during acoustic surveys. We stress that our
results represent one location and one bat assemblage.
Results will likely vary with location, species assemblage,
habitat type, and weather. Also, we recognize that the scope
of this study was limited as a result of comparing only 2
different bat-detector systems. Including several other
brands of detectors would have enhanced this study;
however, we were limited financially in acquiring such
equipment. Bat biologists must make every effort to
understand and reduce our sampling biases when studying
these small, volant, nocturnal mammals. Additional
comparative studies will continue to inform best practices
for bat research, which will ultimately aid in the
management and conservation of these valuable wildlife
species.
ACKNOWLEDGMENTS
We thank the Indianapolis Airport Authority for funding and
property access. Special thanks to B. Walters and J. Helms
(Indiana State University), D. Solick (WEST, Inc.), S.
Amelon (U.S. Forest Service), C. R. Allen (Bat Call ID), and
C. Corben for logistical help, advice on project design,
software, and hardware support. For field assistance, we thank
G. Auteri, J. Cox, A. Gondran, D. Howard, M. Johnson, V.
Kuczynska, A. Nolder, C.Schweizer, J. Weber, andS. Wiram.
We thank Drs. C. Murphy and S. Lima for comments on
experimental design, analyses, and earlier drafts of this
manuscript. We also thank S. DeStefano and 2 anonymous
reviewers who provided comments on this manuscript.
LITERATURE CITED
Adams, A. M., M. K. Jantzen, R. M. Hamilton, and M. B. Fenton. 2012. Do
you hear what I hear? Implications of detector selection for acoustic
monitoring of bats. Methods in Ecology and Evolution 3:992À998.
Aldrich, H. D. N., and L. L. Rautenbach. 1987. Morphology, echolocation
and resource partitioning in insectivorous bats. Journal of Animal Ecology
56:763À778.
Arnett, E. B., and E. Baerwald. 2013. Impacts of wind energy development
on bats: implications for conservations. Pages 435–456 in R. A. Adams
and S. C. Pederson, editors. Bat ecology, evolution, and conservation.
Springer Science Press, New York, New York, USA.
Britzke, E. R., B. A. Slack, M. P. Armstrong, and S. C. Loeb. 2010. Effects
of orientation and weatherproofing on the detection of bat echolocation
calls. Journal of Fish and Wildlife Management 1:136À141.
Broders, H. G., C. S. Findlay, and L. Zheng. 2004. Effects of clutter on
echolocation call structure of Myotis septentrionalis and M. lucifugus.
Journal of Mammalogy 85:273À281.
Corben, C. 2004. Zero-crossings analysis for bat identification: an overview.
Pages 95À107 in R. M. Brigham, E. K. V. Kalko, G. Jones, S. Parsons,
and H. J. G. A. Limpens, editors. Bat echolocation research: tools,
techniques and analysis. Bat Conservation International, Austin, Texas,
USA.
Corben, C. 2011. Weather protection. http://users.lmi.net/corben/Weather
%20Protection.htm. Accessed on 29 Sep 2014.
Corben, C., and G. M. Fellers. 2001. Choosing the ‘correct’ bat detector—a
reply. Acta Chiropterologica 3:253À256.
Cryan, P. M., C. U. Meteyer, J. G. Boyles, and D. S. Blehert. 2013. White-
nose syndrome in bats: illuminating the darkness. BMC Biology 11:47.
Downes, C. 1982. A comparison of sensitivities of three bat detectors.
Journal of Mammalogy 63:345À347.
Kaiser and O’Keefe Data Acquisition by Bat Detectors 9
10. Duchamp, J. E., M. Yates, R. M. Muzika, and R. K. Swihart. 2006.
Estimating probabilities of detection for bat echolocation calls: an
application of the double observer method. Wildlife Society Bulletin
34:408À412.
Forbes, B., and E. M. Newhook. 1990. A comparison of the performance of
three models of bat detectors. Journal of Mammalogy 71:108À110.
Ford, W. M., M. A. Menzel, J. L. Rodrigue, J. M. Menzel, and J. B.
Johnson. 2005. Relating bat species presence to simple habitat measures in
a central Appalachian forest. Biological Conservation 126:528À539.
Gorresen, P. M., A. C. Miles, C. M. Todd, F. J. Bonaccorso, and T. J.
Weller. 2008. Assessing bat detectability and occupancy with multiple
automated echolocation detectors. Journal of Mammalogy 89:11À17.
Griffin, D. R. 1971. The importance of atmospheric attenuation for the
echolocation of bats (Chiroptera). Animal Behaviour 19:55À61.
Hayes, J. P. 2000. Assumptions and practical considerations in the design
and interpretation of echolocation-monitoring studies. Acta Chiropter-
ologica 2:225À236.
Kunz, T. H., and A. Kurta. 1988. Capture methods and holding devices.
Pages 1À29 in T. H. Kunz, editor. Ecological and behavioral methods for
the study of bats. Smithsonian Institution Press, Washington, D.C., USA.
Larson, D. J., and J. P. Hayes. 2000. Variability in sensitivity of Anabat II bat
detectors and a method of calibration. Acta Chiropterologica 2:209À213.
Lawrence, B. D., and J. A. Simmons. 1982. Measurements of atmospheric
attenuation at ultrasonic frequencies and the significance for echolocating
bats. Journal of Acoustical Society of America 71:585À590.
Limpens, H. J. G. A., and G. F. McCracken. 2004. Choosing a bat detector:
theoretical and practical aspects. Pages 28–37 in R. M. Brigham, E. K. V.
Kalko, G. Jones, S. Parsons, H. J. G. A. Limpens, editors. Bat
echolocation research: tools, techniques and analysis. Bat Conservation
International, Austin, Texas, USA.
Miller, B. W. 2001. A method for detecting relative activity of free flying
bats using a new activity index for acoustic monitoring. Acta
Chiropterologica 3:93À105.
Murray, K. L., E. R. Britzke, and B. M. Hadley. 1999. Surveying bat
communities: a comparison between mist nets and the Anabat II bat
detector system. Acta Chiropterologica 1:105À112.
Obrist, M. K., E. Rathey, F. Bontadina, A. Martinoli, M. Conedera, P.
Christe, and M. Moretti. 2011. Response of bat species to sylvo-pastoral
abandonment. Forest Ecology and Management 261:789À798.
O’Farrell, M. J., and W. L. Gannon. 1999. A comparison of acoustic versus
capture techniques for the inventory of bats. Journal of Mammalogy
80:24À30.
O’Keefe, J. M., S. M. Bergeson, C. Byrne, L. K. Castor, Z. D. Kaiser, B. L.
Walters, and J. O. Whitaker, Jr. 2014. 2013 monitoring program for the
Indiana myotis (Myotis sodalis) near the Six Points Interchange in
Hendricks and Marion Counties, Indiana as required under the Six
Points Interchange Habitat Conservation Plan. Center for Bat Research,
Outreach, and Conservation. Indiana State University, Terre Haute,
USA.
Owen, S. F., M. A. Menzel, and J. W. Edwards. 2004. Bat activity in
harvested and intact forest stands in the Allegheny Mountains. Northern
Journal of Applied Forestry 21:154À159.
Parsons, S. 1996. A comparison of the performance of a brand of broad-band
and several brands of narrow-band bat detectors in two different habitat
types. Bioacoustics 7:33À43.
Pettersson, L. 2004. The properties of sound and bat detectors. Pages 9À12
in R. M. Brigham, E. K. V. Kalko, G. Jones, S. Parsons, H. J. G. A.
Limpens, editors. Bat echolocation research: tools, techniques and
analysis. Bat Conservation International, Austin, Texas, USA.
Romeling, S., C. R. Allen, and L. W. Robbins. 2012. Acoustically detecting
Indiana bats: how long does it take? Bat Research News 53:51À58.
Schnitzler, H., and E. K. V. Kalko. 2001. Echolocation by insect-eating bats.
BioScience 51:557À569.
Solick, D., C. Nations, and J. Gruver. 2011. Activities rates and call quality
by full-spectrum detectors. Bat Research News 52:59.
Sparks, D. W., V. W. Brack, Jr., J. O. Whitaker, Jr., and R. Lotspeich. 2009.
Reconciliation ecology and the Indiana bat at Indianapolis International
Airport. Pages 1À15 in P. B. Larauge and M. E. Castille, editors.
Airports: performance, risks, and problems. Nova Science Hauppauge,
New York, New York, USA.
Sparks, D. W., C. M. Ritzi, J. E. Duchamp, and J. O. Whitaker, Jr. 2005.
Foraging habitat of the Indiana bat (Myotis sodalis) at an urban-rural
interface. Journal of Mammalogy 86:713–718.
Sprong, L., M. Keith, and E. C. J. Seamark. 2012. Assessing the effect of
waterproofing on three different bat detectors. African Bat Conservation
News, ISSN 1812–1268.
Staton, T., and S. Poulton. 2012. Seasonal variation in bat activity in relation
to detector height: a case study. Acta Chiropterologica 14:401–408.
U.S. Fish and Wildlife Service [USFWS]. 2015. Range-wide Indiana bat
summer survey guidelines, April 2015. http://www.fws.gov/midwest/
endangered/mammals/inba/surveys/pdf/
2015IndianaBatSummerSurveyGuidelines01April2015.pdf Accessed 5
Apr 2015.
Waters, D. A., and A. L. Walsh. 1994. The influence of bat detector brand
on the quantitative estimation of bat activity. Bioacoustics 5:205À221.
Weller, T. J., P. M. Cryan, and T. J. O’Shea. 2009. Broadening the focus of
bat conservation and research in the USA for the 21st century. Endangered
Species Research 8:129À145.
Weller, T. J., and C. J. Zabel. 2002. Variation in bat detections due to
detector orientation in a forest. Wildlife Society Bulletin 30:922À930.
Whitaker, J. O., Jr., D. W. Sparks, and V. W. Brack. 2004. Bats of the
Indianapolis International Airport area, 1991À2001. Proceedings of the
Indiana Academy of Science 113:151À161.
Whitaker, J. O., Jr., D. W. Sparks, and V. W. Brack, Jr. 2006. Use of
artificial roost structures by bats at Indianapolis International Airport.
Environmental Management 38:28À36.
Associate Editor: DeStefano.
10 Wildlife Society Bulletin 9999