JLL Detroit Office Employment Update
•
1 like•187 views

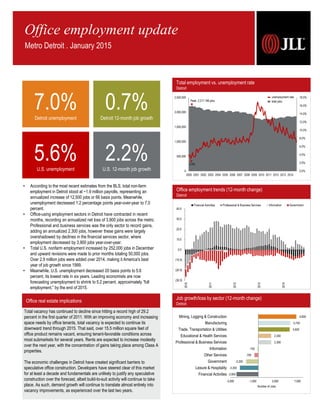
According to the most recent estimates from the BLS, total non-farm employment in Detroit stood at ~1.9 million payrolls, representing an annualized increase of 12,500 jobs or 66 basis points. Meanwhile, unemployment decreased 1.2 percentage points year-over-year to 7.0 percent.

Recommended
Recommended
More Related Content
What's hot
What's hot (15)
Viewers also liked
Viewers also liked (20)
Similar to JLL Detroit Office Employment Update
Similar to JLL Detroit Office Employment Update (20)
More from Andrew Batson
More from Andrew Batson (20)
Recently uploaded
Recently uploaded (20)
JLL Detroit Office Employment Update
- 1. Office real estate implications Sources: JLL Research, Bureau of Labor Statistics Job growth/loss by sector (12-month change) Detroit Total vacancy has continued to decline since hitting a record high of 29.2 percent in the first quarter of 2011. With an improving economy and increasing space needs by office tenants, total vacancy is expected to continue its downward trend through 2015. That said, over 15.5 million square feet of office product remains vacant, ensuring tenant-favorable conditions across most submarkets for several years. Rents are expected to increase modestly over the next year, with the concentration of gains taking place among Class A properties. The economic challenges in Detroit have created significant barriers to speculative office construction. Developers have steered clear of this market for at least a decade and fundamentals are unlikely to justify any speculative construction over the forecast, albeit build-to-suit activity will continue to take place. As such, demand growth will continue to translate almost entirely into vacancy improvements, as experienced over the last two years. Total employment vs. unemployment rate Detroit (30.0) (20.0) (10.0) 0.0 10.0 20.0 30.0 40.0 2010 2011 2012 2013 2014 Financial Activities Professional & Business Services Information Government Office employment trends (12-month change) Detroit Office employment update Metro Detroit . January 2015 0.0% 2.0% 4.0% 6.0% 8.0% 10.0% 12.0% 14.0% 16.0% 18.0% 0 500,000 1,000,000 1,500,000 2,000,000 2,500,000 2000 2001 2002 2003 2004 2005 2006 2007 2008 2009 2010 2011 2012 2013 2014 Peak: 2,217,186 jobs unemployment rate total jobs 3.0% -3,900 -3,300 -2,200 -700 -100 2,300 2,300 5,600 5,700 6,800 -5,000 -1,000 3,000 7,000 Financial Activities Leisure & Hospitality Government Other Services Information Professional & Business Services Educational & Health Services Trade, Transportation & Utilities Manufacturing Mining, Logging & Construction Number of Jobs 7.0%Detroit unemployment 0.7%Detroit 12-month job growth 5.6%U.S. unemployment 2.2%U.S. 12-month job growth • According to the most recent estimates from the BLS, total non-farm employment in Detroit stood at ~1.9 million payrolls, representing an annualized increase of 12,500 jobs or 66 basis points. Meanwhile, unemployment decreased 1.2 percentage points year-over-year to 7.0 percent. • Office-using employment sectors in Detroit have contracted in recent months, recording an annualized net loss of 3,900 jobs across the metro. Professional and business services was the only sector to record gains, adding an annualized 2,300 jobs, however these gains were largely overshadowed by declines in the financial services sector, where employment decreased by 3,900 jobs year-over-year. • Total U.S. nonfarm employment increased by 252,000 jobs in December and upward revisions were made to prior months totaling 50,000 jobs. Over 2.9 million jobs were added over 2014, making it America's best year of job growth since 1999. • Meanwhile, U.S. unemployment decreased 20 basis points to 5.6 percent, its lowest rate in six years. Leading economists are now forecasting unemployment to shrink to 5.2 percent, approximately “full employment,” by the end of 2015.
- 2. November 2012 November 2013 November 2014 Total Non-farm Employment 1,864,000 2.0% 1,886,100 2.0% 1,898,600 0.7% Unemployment Rate 9.2% 8.2% 7.0 % Detroit Supersectors November 2012 November 2013 November 2014 Mining, Logging and Construction 58,400 1.0% 59,300 1.5% 66,100 11.5% Manufacturing 223,400 4.5% 235,100 5.2% 240,800 2.4% Trade, Transportation, & Utilities 355,400 2.3% 356,500 0.3% 362,100 1.6% Information 26,600 -0.4% 27,200 2.3% 27,100 -0.4% Financial Activities 100,100 2.6% 100,300 0.2% 96,400 -3.9% Professional & Business Services 354,600 4.0% 366,900 3.5% 369,200 0.6% Educational & Health Services 298,800 1.0% 299,400 0.2% 301,700 0.8% Leisure & Hospitality 174,600 1.5% 172,400 -1.3% 169,100 -1.9% Other Services 76,500 3.0% 77,500 1.3% 76,800 -0.9% Government 195,600 -3.0% 191,500 -2.1% 189,300 -1.1% JLL Americas Research • Detroit Office Employment Update 2 Industry employment stratification Detroit © 2015 Jones Lang LaSalle IP, Inc. All rights reserved. All information contained herein is from sources deemed reliable; however, no representation or warranty is made to the accuracy thereof. Employment statistics Detroit Professional & Business Services, 369,200, 19% Trade, Transportation &Utilities, 362,100, 19% Educational & Health Services, 301,700, 16% Manufacturing, 240,800, 13% Government, 189,300, 10% Leisure & Hospitality, 169,100, 9% Financial Activities, 96,400, 5% Other Services, 76,800, 4% Mining, Logging & Construction, 66,100, 3% Information, 27,100, 1% Andrew Batson Senior Research Analyst Great Lakes Region tel +1 248 581 3300 Andrew.Batson@am.jll.com 226 East Hudson Avenue Suite 200 Royal Oak, MI 48067 www.jll.com/detroit News on the street Detroit businesses expanding, contracting, etc. Commonwealth/McCann Ι Advertising Agencies: Relocating Commonwealth/McCann plans to move its Detroit office down the street into about 50,000 square feet at One Detroit Center early next year. The advertising agency’s office is currently in the Francis Palms Building at 2111 Woodward, where it occupies 42,000 square feet. The move will involve all of Commonwealth/McCann’s 250-300 employees. Duffey Petrosky & Company I Advertising Agencies: Expanding Duffey Petrosky & Company plans to add 120 jobs after recently being awarded a $1 million performance-based grant by the Michigan Strategic Fund. The Farmington Hills marketing agency plans to renovate its existing operation in the city to accommodate expected growth in advertising and marketing. The company, which was founded in 1997, currently has 114 employees. Edmunds.com Ι Internet Content Providers: Relocating Web-based car-shopping firm Edmunds.com has had a presence in the Detroit area for the better part of a decade. But Avi Steinlauf, the Santa Monica-based company's CEO, said he wanted the company to be more a part of the city's renaissance. So Edmunds.com relocated its suburban office to 5,000 square feet of space at 150 West Jefferson in the heart of downtown. The site will be a base for all of Edmunds.com's 100 or so employees in the eastern half of the United States. Fifth Third Bancorp Ι Banks & Credit Unions: Relocating Fifth Third (NASDAQ: FITB) announced that it will lease 62,000 square feet in the One Woodward building to serve as its regional headquarters. As part of the lease agreement, the One Woodward building will be renamed Fifth Third Bank at One Woodward. The move will take place over two years and will involve the relocation of over 150 full-time employees. Fifth Third will keep about 20,000 square feet and up to 40 employees in Southfield, where it currently leases 105,000 square feet. General Motors Ι Automobile Manufacturing: Expanding The former Lowe Campbell Ewald headquarters building in Warren recently sold to General Motors (NYSE:GM). GM paid $2 million for the 150,000-square-foot building, which is on Van Dyke Avenue north of East 12 Mile Road across the street from the GM Technical Center. GM said the building will serve as an extension of the Technical Center, providing additional office space for employees and visitors. Millennium Medical Group Ι Healthcare: Consolidating Millennium Medical Group, a multispecialty group practice with about 85 physicians, has consolidated 13 of its offices and 80 physicians into a 100,000-square-foot medical hub in Farmington Hills. Millennium is a division of the 350-physician Michigan Healthcare Professionals Network. Millennium’s new consolidated offices are in the Tri-Atria Office Building at 32255 Northwestern Highway. Robert Kramp Senior Vice President – Americas Midwest & Great Lakes Research Director tel +1 312 228 2470 Robert.Kramp@am.jll.com 200 East Randolph Street, 47th Floor Chicago, IL 60601 www.us.joneslanglasalle.com/research