Presentation1, radiological application of diffusion weighted images in abdome and pelvic diseases.
•
11 j'aime•1,586 vues

Health&Medicine.

Recommandé
Contenu connexe
Tendances
Tendances (20)
Similaire à Presentation1, radiological application of diffusion weighted images in abdome and pelvic diseases.
Similaire à Presentation1, radiological application of diffusion weighted images in abdome and pelvic diseases. (20)
Plus de Abdellah Nazeer
Plus de Abdellah Nazeer (20)
Dernier
Dernier (20)
Presentation1, radiological application of diffusion weighted images in abdome and pelvic diseases.
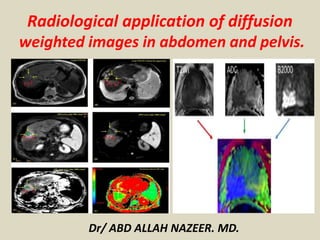
- 1. Dr/ ABD ALLAH NAZEER. MD. Radiological application of diffusion weighted images in abdomen and pelvis.
- 2. DWI in the abdomen and pelvis is a valuable adjunct to traditional techniques and improves the sensitivity of MRI for lesion detection, especially metastases. Furthermore, DWI may enhance the ability to characterize lesions, particularly when gadolinium administration is contraindicated or contrast-enhanced images are suboptimal. Even in the presence of dynamic contrast-enhanced imaging, DWI may yield supportive evidence and increase the confidence in a specific diagnosis. DWI should always be used in conjunction with the information provided by additional sequences. DWI and ADC maps provide an opportunity for tissue characterization using a quantitative method, thus offering a new opportunity for longitudinal assessment of tumors undergoing therapy; however, further research is necessary to determine the role of such quantitative analysis in clinical practice. Given these merits and the ubiquitous availability of DWI on current MRI systems, DWI may be implemented as a routine sequence in standard abdominal MRI protocols and considered of the most value when IV contrast agents cannot be administered.
- 3. With advances in hardware and coil systems, diffusion-weighted (DW) MR imaging can now be applied to liver imaging with improved image quality. DW MR imaging enables qualitative and quantitative assessment of tissue diffusivity (apparent diffusion coefficient) without the use of gadolinium chelates, which makes it a highly attractive technique, particularly in patients with severe renal dysfunction at risk for nephrogenic systemic fibrosis. In this review, acquisition parameters, postprocessing, and quantification methods applied to liver DW MR imaging will be discussed. The current clinical uses of DW MR imaging (liver lesion detection and characterization, compared and combined with conventional sequences) and the emerging applications of DW MR imaging (tumor treatment response and diagnosis of liver fibrosis and cirrhosis) will be reviewed. Also, limitations, mainly image quality and reproducibility of diffusion parameters, and future directions of liver DW MR imaging will be discussed.
- 4. DWI may be used to diagnosis also with a significant success for follow-up of patients with Inflammatory appendiceal mass (IAM). As a monitoring imaging method, DWI may also aid in determining of most appropriate timing for interval appendectomy as well as may help in diagnosing alternative diagnoses (e.g. malignancy and inflammatory bowel disease) that can mimic IAM. A combination of DWI and conventional MRI was the most sensitive and the most accurate, with corresponding sensitivity and accuracy of 0.92 and 0.92, respectively. Using DWI alone the sensitivity and accuracy was found to be 0.78 and 0.77, respectively. Using conventional MRI alone, sensitivity of 0.81 and accuracy of 0.82 was found for the consensus of the two observers.
- 5. An 11-year-old boy with a normal appendix. a: Axial TSE T2-weighted image showing the appendix. Arrow: appendix. b, c: Diffusion-weighted MR image of the appendix with b value of 400 s/mm2 and 800 s/mm2 showing hypointensity of the appendix. Arrow: appendix. d: ADC image showing hyperintensity of the appendix. ROI was placed on the appendix. ADC was 2.08 103 mm2 /s. Arrow: appendix
- 6. An 11-year-old girl with acute appendicitis and fluid collection. a: Axial TSE T2-weighted image showing the appendix. Arrow: appendix, f: fluid. b, c: Diffusion-weighted MR image of the appendix with b value of 400 s/mm2 and 800 s/mm2 showing marked hyperintensity. Arrow: appendix; f: fluid. d: ADC image showing hypointensity of the appendix (marked restricted diffusion). ROI was placed on the appendix. ADC was 1.12 103 mm2 /s. Arrow: appendix, f: fluid.
- 7. An 8-year-old boy with acute appendicitis. a: Axial TSE T2-weighted image showing the appendix (arrow). b, c: Diffusion-weighted MR image of the appendix (arrow) with b value of 400 s/mm2 and 800 s/mm2 showing marked hyperintensity. d: ADC image showing hypointensity of the appendix (marked restricted diffusion). ROI was placed on the appendix (arrow). ADC was 0.97 103 mm2 /s.
- 8. Pregnant women with acute appendicitis. Apparent diffusion coefficient (ADC) map corresponding to A and B also shows appendix with excellent conspicuity and confirms restricted diffusion in appendix. High ADC values in periappendiceal fluid indicate T2 shine-through from simple fluid.
- 9. A 34-year-old man with acute right lower quadrant pain for a day had acute appendicitis at surgery. A, Non- enhanced computed tomography (NECT) shows enlargement of the appendix with some stranding of surrounding fatty tissue (arrows). B, Diffusion weighted imaging (DWI) clearly depicts an enlarged hyperintense tubular structure (arrows) and C, Apparent diffusion coefficient (ADC) map shows diffusion restriction (arrows).
- 10. A 18-year-old man with right lower quadrant pain for the last two days. Following surgery, microscopy revealed lymphoid hyperplasia without findings of acute appendicitis. Non- enhanced computed tomography (NECT) (not shown here) shows only slight enlargement of the appendix with fine peri appendiceal fatty tissue. Combined imaging report was positive for acute appendicitis. A, Diffusion weighted imaging (DWI) shows enlargement of the appendix with hyperintense signal (arrows) and B, Apparent diffusion coefficient (ADC) map shows restricted diffusion of the appendix (arrows).
- 11. A 37 -year-old female patient with right lower quadrant pain for the last two days. Surgery revealed acute appendicitis. A, Non-enhanced computed tomography (NECT) shows a slightly enlarged appendix (8.6 mm) with fine surrounding fatty tissue planes that was reported as normal by NECT only review (arrows). B, Diffusion weighted imaging (DWI) depicts a strong hyperintense signal of the enlarged appendix (arrows) with some peri appendiceal fat blurring, and C, Apparent diffusion coefficient (ADC) map reveals diffusion restriction (arrows).
- 12. A 48-year-old male with acute right lower quadrant (RLQ) pain for 4 days. Clinical, laboratory and imaging findings suggested IAM. The patient underwent interval appendectomy at the fourth week of follow-up. (a) CT at presentation shows a RLQ mass (IAM) bordered by cecum laterally, ileum anteriorly and gerota fascia posteriorly (arrow). (b, c) DWI (b = 1000) and ADC map at presentation show restricted diffusion (arrow). (d, e) Four weeks after initial presentation, DWI (b = 1000) and ADC map reveal total recovery at the localization of previous IAM, both qualitatively and quantitatively. (f) Microscopy of appendectomy specimen shows no any inflammatory cells.
- 13. 54-year-old male with right lower quadrant (RLQ) pain for last 5 days. Clinical, laboratory and imaging findings were suggestive of IAM at presentation. Although there was relief of pain and improvement of laboratory tests following two weeks antibiotic therapy, on control DWI there was not any change of the RLQ mass (not shown in the figure). Colonoscopy performed at second week of follow-up showed a cecal mass. Surgery revealed cecal adenocarcinoma with appendiceal mucocele. (a) CT at presentation shows a complex RLQ inflammatory mass (arrows). (b, c) DWI (b = 500) and ADC map at presentation show restricted diffusion of the mass (arrows).
- 14. A 37-year-old female with right lower quadrant (RLQ) pain for last 3 days. Clinical, laboratory and imaging findings were suggestive of IAM at presentation. At the sixth moth of follow-up the patient came over with RLQ pain suggestive of relapse of appendicitis. Imaging findings were compatible with IAM. (a, b) DWI and ADC map reveal a RLQ mass with diffusion restriction at the time of first presentation (arrows). (c, d) Control DWI and ADC map show complete regression of IAM with antibiotic therapy. (e, f) Six months following the first presentation there was recurrence of IAM depicted on DWI and ADC map (arrows).
- 17. A 34-year-old man with transsphinteric anal fistula of positive inflammation activity with abscess. (A) Axial T2-weighted image shows a perianal fistula (arrow) that exhibits slightly high signal intensity. (B and C) Axial and sagittal fat-suppression T2-weighted images show a perianal fistula (arrow) that exhibits high signal intensity. (D) Axial diffusion tensor imaging reveals high signal intensity at the fistula (arrow). (E) Axial apparent diffusion coefficient (ADC) map shows a value of 0.377 × 10⁻³ mm2/s for the fistula. (F) Axial fractional anisotropy (FA) map shows a value of 0.073.
- 18. Inflammatory Bowel Disease DWI has been found promising for detecting active inflammation in patients with Crohn's disease. The reported sensitivity and specificity are 80% and 95% . DWI of the bowel is subject to motion and artifact from bowel gas; therefore, glucagon and oral contrast agents are recommended to minimize these technical challenges. Even without bowel preparation, MR colonography with DWI has been found 90% sensitive and 87% specific in detecting inflamed segments of colon in patients with ulcerative colitis.
- 19. Axial T2-weighted MR image shows fluid-filled loops of bowel (thin arrows) in right lower quadrant with mesenteric phlegmon (thick arrow). Axial diffusion-weighted MR image (b = 650 s/mm2) highlights active inflammation in diseased bowel wall (thin arrows), distinct from fluid within bowel lumen (asterisk). Restricted diffusion in mesenteric phlegmon (thick arrow) is also evident.
- 20. Active distal ileal Crohn’s disease. Axial diffusion weighted imaging (A) (b = 150) and (B) apparent diffusion coefficient map as well as (C) axial and (D) coronal fat-suppressed post-gadolinium 3D-GRE T1-weighted images. There is a long segment of distal ilial diffuse thickening associated with diffusion restriction (A and B) as well as significant contrast enhancement (C) and vasa recta engorgement (comb sign) (D) in keeping with active Crohn’s disease. GRE: Gradient recalled echo.
- 22. Diverticulitis: Although CT is the primary imaging modality for the diagnosis of acute diverticulitis, this condition can also be diagnosed with MRI as an incidental finding or in pregnant patients. In these cases, DWI is helpful in alerting the radiologist to the inflammation. Many radiologists routinely recommend follow-up colonoscopy to exclude underlying cancer, even though this recommendation has been questioned. DWI has potential for differentiating acute colonic diverticulitis and malignancy, allowing this recommendation to be eliminated. MRI with T2-weighted sequences combined with DWI was found 100% sensitive and specific for differentiating diverticulitis from cancer in the sigmoid colon.
- 29. Active colonic ulcerative colitis. A: Axial diffusion-weighted imaging (b = 650 s/mm2); B: ADC map images. There is diffuse thickening involving the colon associated wish diffuse mucosal diffusion restriction (arrows A) in keeping with active ulcerative colitis. ADC: Analog-digital conversion.
- 30. Hepatic cyst with high signal intensity on DWI (b50) and on ADC map (T2 shine-through).
- 31. Polycystic renal disease demonstrates high signal intensity both on DWI (b50) and on ADC map (T2 shine-through).
- 32. The gallbladder has high signal intensity both on DWI (b400) and on ADC map (T2 shine-through).
- 33. The bladder shows high signal intensity on DWI (b0) and on ADC map (T2 shine-through).
- 34. The peripheral zone of the prostate can demonstrate high signal intensity both on DWI (b50) and on ADC map (T2 shine-through).
- 35. A hepatic nodule with typical features of adenoma shows high signal intensity on DWI (b400) and low ADC values, thus demonstrating restricted diffusion.
- 36. A hepatic nodule with typical features of focal nodular hyperplasia shows restricted diffusion, with high signal intensity on DWI (b400 in this case) and low ADC values.
- 37. Hepatic hemangioma with restricted diffusion, demonstrating high signal intensity on DWI (b400) and low ADC values.
- 43. Incidental mass in tail of pancreas, related to intra-pancreatic accessory spleen.
- 44. Role of DWI as a biomarker Hepatic carcinogenesis is a multistep process; with progression from cirrhotic nodules to dysplastic nodules to well differentiated HCC. Hyperintensity on DWI in hypovascular nodules in patients with cirrhosis has been shown to predict progression to hypervascular HCC. DWI can predict the histopathologic grade of HCC. There is an inverse correlation between tumor grade and ADC value, with poorly differentiated HCC showing more restricted diffusion than well differentiated HCC although one study showed no significant association between DWI and HCC tumor grade. DWI shows promise as an imaging biomarker, since restricted diffusion can indicate presence of progenitor cell markers, vascular endothelial growth factor (VEGF) expression, and microvascular invasion
- 45. Hepatocellular carcinoma in an 81-year-old woman. (a) Gadolinium-enhanced T1-weighted MR image shows a hypervascular mass (arrow). (b) On a fat-suppressed fast spin-echo T2-weighted MR image, the mass is slightly hyperintense (arrow). (c) Diffusion-weighted image (b = 500 sec/mm2) shows the mass with high signal intensity (arrow). (d) On an ADC map, the mass demonstrates restricted diffusion (arrow).
- 46. A 66-year-old lady with multifocal infiltrative hepatocellular carcinoma with improved detection on diffusion- weighted imaging. (A) Axial T2 weighted image demonstrates multifocal areas of T2 hyperintense masses (white arrows) which demonstrate heterogeneous arterial hyperenhancement on post gadolinium late arterial phase images (B) and washout appearance on portal venous phase images (C). (D) Axial DWI image at b-600 and (E) ADC image show that these masses demonstrate restricted diffusion and are better appreciated than the dynamic phase images. Serum Alpha feto-protein value of 1552. DWI: Diffusion-weighted imaging.
- 47. Multiplanar images through the liver in a patient with hepato-cholangio-carcinoma status post left hepatectomy. A lesion adjacent to a vessel is hyperintense on DWI axial (A) and coronal (B) images. The lesion is dark on ADC map (C), indicating restricted diffusion. Lesion is more apparent on DWI images than post-contrast axial (D), and T2 axial (E) and coronal (F) images; this is due to proximity of the lesion to the hepatic vein as well demonstrated in the coronal DWI (D).
- 48. Axial MRI images through the liver demonstrating a small simple cyst. A subcentimeter lesion is present in hepatic segment 7; the lesion demonstrates high signal intensity on T2 weighted images (A) and b 500 s/mm2 DWI (B). However, it is bright on ADC map (C) indicating high diffusion consistent with T2 shine through phenomena. Shine through phenomena is not rare in cysts.
- 49. Value of diffusion-weighted magnetic resonance imaging in lesion detection in a 51-year-old male with metastatic leiomyosarcoma of the thigh. A: Axial contrast enhanced CT scan demonstrated a subtle hypodensity in the right lobe of liver (black arrow); B: Axial post gadolinium T1-weighted MR image demonstrates a single metastatic lesion (black arrow); C-E: DW-MR image at b-600 demonstrates additional lesions (white arrows). DW-MR: Diffusion-weighted magnetic resonance; CT: Computed tomography.
- 50. Biopsy-proven cholangiocarcinoma in posterior right hepatic lobe adjacent to inferior vena cava.
- 51. Lesion (arrow) nearly isointense to background liver on axial T2-weighted single-shot fast spin-echo image (A) is well shown on low-b-value diffusion-weighted (b = 50) image (B). Retained signal on high-b-value (b800) image (C) suggests solid lesion, which as new finding in setting of cirrhosis is worrisome for hepatocellular carcinoma. Note abdominal ascites (asterisk), which decreases in signal intensity on high-b-value images, suggestive of simple fluid. This fluid was bright on ADC map (D). Dynamic imaging was not performed due to contraindication to gadolinium. This example also shows potential inconspicuity of solid lesion on ADC map (D) on background of cirrhotic liver.
- 52. Hemorrhagic cyst of the kidney showing restricted diffusion: high signal intensity on DWI (b800) and low ADC values.
- 53. Perirenal hematoma showing restricted diffusion: high signal intensity on DWI (b800) and low ADC values.
- 54. Coronal T1-weighted 3D spoiled gradient-echo images obtained before (A) and after (B) gadolinium administration show left renal mass (arrow) with subtle enhancement. Lesion was iso- to slightly hypointense to kidney on low-b-value images (not shown) but is hyperintense compared with renal parenchyma on high-b-value diffusion-weighted image (C) and hypointense on apparent diffusion coefficient map (D). Findings are consistent with restricted diffusion, confirming solid neoplasm in this context and papillary RCC was confirmed at histopathology after partial nephrectomy.
- 55. Renal cell carcinoma in a 54-year-old woman. (a) Fast spin-echo T2-weighted MR image shows a mass (arrow) that arises from the left kidney. The mass demonstrates intermediate signal intensity, a finding that is consistent with a solid mass or hemorrhagic cyst. (b) Axial diffusion-weighted image (b = 500 sec/mm2) shows the mass with high signal intensity (arrow). (c) On an axial ADC map, the mass (arrow) demonstrates low signal intensity (restricted diffusion), a finding that is consistent with a solid tumor.
- 56. Normal lateroaortic lymph node showing restricted diffusion: high signal intensity on DWI (b800) and low ADC values.
- 57. Cancer esophagus with porta hepatis lymph node metastasis.
- 58. Hepatic metastasis from colon adenocarcinoma with necrotic center, where the ADC values are significantly higher.
- 59. Adrenal metastasis from renal cell carcinoma shows very high signal intensity on DWI (b800) and low ADC values.
- 60. Normal proliferative endometrium can show restricted diffusion (high signal intensity on DWI b50 and low ADC values)
- 61. Uterine leiomyoma showing low signal intensity both on T2 weighted DWI and on ADC map (T2 blackout effect).
- 73. Mucinous tumour of the rectum shows high signal intensity both on DWI (b50) and ADC map - T2 shine through.
- 74. Rectal cancer shows high signal intensity even at very high b values (b1000).
- 75. Stage T3 rectal cancer. A and B: Axial high-resolution T2-weighted images as well as axial (C) diffusion-weighted imaging (b = 650 s/mm2) and (D) ADC map images. There is a large polypoidal mass lesion arising from the right anterolateral lower rectal wall (A and B) with two foci of tumoral extension beyond the low-signal serosal layer (arrows, B) that show diffusion restriction (C and D) in keeping with stage T3 rectal tumor. ADC: Analog- digital conversion.
- 76. Anal canal cancer shows high signal intensity on DWI (b800) and low ADC values.
- 79. Prostate cancer in a 64-year-old man. (a) On an axial T2-weighted MR image obtained with an endorectal coil, the peripheral zone of the prostate gland appears normal (ie, has high signal intensity), but a questionable focus of hypointensity is seen in the anterior left central portion of the gland (arrow). (b) Axial ADC map more clearly depicts the questionable area as a hypointense focal region of restricted diffusion (arrow).
- 80. Thank You.