Product layout in Food Industry and Line Balancing
•Download as PPTX, PDF•
3 likes•8,284 views

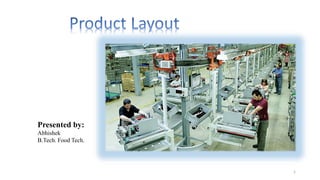
The product or line layout is the basic type of layout commonly used by the food industry. Line balancing is done to analyze the net output of our production line and processing time at various steps.

Recommended
More Related Content
What's hot
What's hot (20)
Viewers also liked
Similar to Product layout in Food Industry and Line Balancing
Similar to Product layout in Food Industry and Line Balancing (20)
More from Abhishek Thakur
More from Abhishek Thakur (11)
Recently uploaded
Recently uploaded (20)
Product layout in Food Industry and Line Balancing
- 1. Presented by: Abhishek B.Tech. Food Tech. 1
- 2. Layout Planning • Layout planning is planning that involves decisions about the physical arrangement of economic activity centers needed by a facility’s various processes. • Layout plans translate the broader decisions about the competitive priorities, process strategy, quality, and capacity of its processes into actual physical arrangements. • Economic activity center: Anything that consumes space -- a person or a group of people, a customer reception area, a teller window, a machine, a workstation, a department, an aisle, or a storage room. 2
- 3. Objectives of facility layout Main: smooth flow of work, material and information Supporting objectives: 3
- 4. Types of Layouts • Four basic layout types consisting of: • Process layouts - Group similar resources together • Product layouts - Designed to produce a specific product efficiently • Hybrid layouts - Combine aspects of both process and product layouts • Fixed-Position layouts - Product is two large to move; e.g. a building 4
- 5. Selection Search Analysis Systematic Layout Planning Muther (1961) 0 Data gathering 10 Evaluation 4 Space requirements 5 Space available 6 Space relationship diagram 1 Flow 2 Activities 3 Relationship diagram 7 Reasons to modify 8 Restrictions 9 Layout alternatives 5
- 6. Used for Repetitive or Continuous Processing Product Layout N. Ramesh(2014) 6
- 7. Advantages of Product Layout • High rate of output • Low unit cost • Labor specialization • Low material handling cost • High utilization of labor and equipment • Established routing and scheduling • Routing accounting and purchasing 7
- 8. Disadvantages of Product Layout • Creates dull, repetitive jobs • Poorly skilled workers may not maintain equipment or quality of output • Fairly inflexible to changes in volume • Highly susceptible to shutdowns • Needs preventive maintenance 8
- 9. Designing Line-Flow Layouts • Line balancing is the assignment of work to stations in a line so as to achieve the desired output rate with the smallest number of workstations. • Work elements are the smallest units of work that can be performed independently. • Immediate predecessors are work elements that must be done before the next element can begin. • Precedence diagram allows one to visualize immediate predecessors better; work elements are denoted by circles, with the time required to perform the work shown below each circle. 9
- 10. Cycle Time Cycle time is the maximum time allowed at each workstation to complete its set of tasks on a unit. tmax < Cycle time < ∑t Wiley 4th edition, 2004 10
- 11. Determine the Minimum Number of Workstations Required Theoretical Nmin is not necessarily will be the Nactual. The latter is affected by other technical and practical considerations, too. Nmin ≤ Nactual (rounded up to the next integer) 11
- 12. A diagram that shows elemental tasks and their precedence requirements. A simplified precedence diagrama b c d e 0.1 min. 0.7 min. 1.0 min. 0.5 min. 0.2 min. Precedence Diagram 12
- 13. Efficiency %= 100 x (1 – Percentage of idle time) Calculate Percent Idle Time and efficiency Wiley 4th edition, 2004 13
- 14. Designing Product Layouts – con’t Step 1: Identify tasks & immediate predecessors Step 2: Determine output rate Step 3: Determine cycle time Step 4: Compute the Theoretical Minimum number of Stations Step 5: Assign tasks to workstations (balance the line) Step 6: Compute efficiency, idle time & balance delay 14
- 15. Step 1: Identify Tasks & Immediate Predecessors Example 10.4 Vicki's Pizzeria and the Precedence Diagram Immediate Task Time Work Element Task Description Predecessor (seconds A Roll dough None 50 B Place on cardboard backing A 5 C Sprinkle cheese B 25 D Spread Sauce C 15 E Add pepperoni D 12 F Add sausage D 10 G Add mushrooms D 15 H Shrinkwrap pizza E,F,G 18 I Pack in box H 15 Total task time 165 15
- 16. Layout Calculations • Step 2: Determine output rate • Vicki needs to produce 60 pizzas per hour • Step 3: Determine cycle time • The amount of time each workstation is allowed to complete its tasks • Limited by the bottleneck task (the longest task in a process): sec./unit60 units/hr60 sec/min60min/hr x60 units/hroutputdesired sec./daytimeavailable )(sec./unittimeCycle hourperpizzasorunits/hr,72 sec./unit50 sec./hr.3600 timeneck taskbottle timeavailable outputMaximum 16
- 17. Layout Calculations con’t • Step 4: Compute the theoretical minimum number of stations • TM = number of stations needed to achieve 100% efficiency (every second is used) • Always round up (no partial workstations) • Serves as a lower bound for our analysis stations3or2.75, nsec/statio60 seconds165 timecycle timestask TM 17
- 18. Layout Calculations con’t • Step 5: Assign tasks to workstations • Start at the first station & choose the longest eligible task following precedence relationships • Continue adding the longest eligible task that fits without going over the desired cycle time • When no additional tasks can be added within the desired cycle time, begin assigning tasks to the next workstation until finished 18
- 19. Last Layout Calculation • Step 6: Compute efficiency and balance delay • Efficiency (%) is the ratio of total productive time divided by total time • Balance delay (%) is the amount by which the line falls short of 100% 91.7%100 sec.60xstations3 sec.165 NC t (%)Efficiency 8.3%91.7%100%delayBalance 19
- 20. Other Product Layout Considerations • Shape of the line (S, U, O, L): • Share resources, enhance communication & visibility, impact location of loading & unloading • Paced versus Un-paced lines • Paced lines use an automatically enforced cycle time • Number of Product Models produced • Single • Mixed-model lines 20
- 21. A U-Shaped Production Line 21
- 22. 22
- 23. Thank you for your attention 23