2575
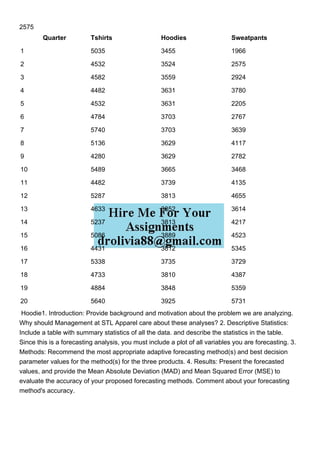
Quarter Tshirts Hoodies Sweatpants
1 5035 3455 1966
2 4532 3524 2575
3 4582 3559 2924
4 4482 3631 3780
5 4532 3631 2205
6 4784 3703 2767
7 5740 3703 3639
8 5136 3629 4117
9 4280 3629 2782
10 5489 3665 3468
11 4482 3739 4135
12 5287 3813 4655
13 4633 3852 3614
14 5237 3813 4217
15 5086 3889 4523
16 4431 3812 5345
17 5338 3735 3729
18 4733 3810 4387
19 4884 3848 5359
20 5640 3925 5731
Hoodie1. Introduction: Provide background and motivation about the problem we are analyzing.
Why should Management at STL Apparel care about these analyses? 2. Descriptive Statistics:
Include a table with summary statistics of all the data. and describe the statistics in the table.
Since this is a forecasting analysis, you must include a plot of all variables you are forecasting. 3.
Methods: Recommend the most appropriate adaptive forecasting method(s) and best decision
parameter values for the method(s) for the three products. 4. Results: Present the forecasted
values, and provide the Mean Absolute Deviation (MAD) and Mean Squared Error (MSE) to
evaluate the accuracy of your proposed forecasting methods. Comment about your forecasting
method's accuracy..
INCLUSIVE EDUCATION PRACTICES FOR TEACHERS AND TRAINERS.pptx
2575 QuarterTshirtsHoodiesSweatpants1503.pdf
1. 2575
Hoodie1. Introduction: Provide background and motivation about the problem we are analyzing.
Why should Management at STL Apparel care about these analyses? 2. Descriptive Statistics:
Include a table with summary statistics of all the data. and describe the statistics in the table.
Since this is a forecasting analysis, you must include a plot of all variables you are forecasting. 3.
Methods: Recommend the most appropriate adaptive forecasting method(s) and best decision
parameter values for the method(s) for the three products. 4. Results: Present the forecasted
values, and provide the Mean Absolute Deviation (MAD) and Mean Squared Error (MSE) to
evaluate the accuracy of your proposed forecasting methods. Comment about your forecasting
method's accuracy.
Quarter Tshirts Hoodies Sweatpants
1 5035 3455 1966
2 4532 3524 2575
3 4582 3559 2924
4 4482 3631 3780
5 4532 3631 2205
6 4784 3703 2767
7 5740 3703 3639
8 5136 3629 4117
9 4280 3629 2782
10 5489 3665 3468
11 4482 3739 4135
12 5287 3813 4655
13 4633 3852 3614
14 5237 3813 4217
15 5086 3889 4523
16 4431 3812 5345
17 5338 3735 3729
18 4733 3810 4387
19 4884 3848 5359
20 5640 3925 5731