SlideShare a Scribd company logo
1 of 9
Download to read offline
Habitat distribution of Adansonia digitata
inferred from ensemble modelling with BiodiversityR
Species distribution modelling is currently underway for
150+ priority species selected by the PATSPO project,
using similar methods of model calibrations as used for
http://www.worldagroforestry.org/atlas-central-america.
However, more sophisticated methods such as spatial
folding, spatial and environmental thinning are employed
to reduce sampling bias and the effects of spatial auto-
correlation. For native species, presence observations
from across the African continent were gathered.
Here provisional results are shown, calibrated with
presence observations that are available online. In a later
phase, additional presence observations will be included
in model calibrations and evaluations. These will be
provided by experienced botanists that will also verify the
distribution maps.
Figure 1 was created by combining information from the
www.vegetationmap4africa.org with the results of habitat
distribution mapping. Where a section of the projected
range of the species overlapped with its expected
distribution in vegetation types, the section was given the
same colouring as the vegetation map. Sections that did
not match documented vegetation types were plotted in
the grey33 R colour.
Figure 1. Projected presence
distribution of the species in
Ethiopia. Administrative
boundaries from
www.gadm.org version 3.6.
Figure 2. Administrative boundaries for Ethiopia from
www.gadm.org version 3.6.
Figure 3. Distribution of potential natural vegetation
types in Ethiopia from www.vegetationmap4africa.org
Figure 4. Projected presence
distribution of the species
across Africa. Administrative
boundaries tmap version 2.2
(Tennekes 2018).
Roeland Kindt1, Lars Graudal12, Jens-Peter B Lillesø2, Abrham Abiyu1, Soren Moestrup12, Paulo van Breugel3
1 World Agroforestry Centre, Tree Productivity and Diversity
2 University of Copenhagen, Department of Geosciences and Natural Resource Management (IGN)
3 HAS University of Applied Sciences, 's-Hertogenbosch
Habitat distribution of Afrocarpus falcatus
inferred from ensemble modelling with BiodiversityR
Species distribution modelling is currently underway for
150+ priority species selected by the PATSPO project,
using similar methods of model calibrations as used for
http://www.worldagroforestry.org/atlas-central-america.
However, more sophisticated methods such as spatial
folding, spatial and environmental thinning are employed
to reduce sampling bias and the effects of spatial auto-
correlation. For native species, presence observations
from across the African continent were gathered.
Here provisional results are shown, calibrated with
presence observations that are available online. In a later
phase, additional presence observations will be included
in model calibrations and evaluations. These will be
provided by experienced botanists that will also verify the
distribution maps.
Figure 1 was created by combining information from the
www.vegetationmap4africa.org with the results of habitat
distribution mapping. Where a section of the projected
range of the species overlapped with its expected
distribution in vegetation types, the section was given the
same colouring as the vegetation map. Sections that did
not match documented vegetation types were plotted in
the grey33 R colour.
Roeland Kindt1, Lars Graudal12, Jens-Peter B Lillesø2, Abrham Abiyu1, Soren Moestrup12
1 World Agroforestry Centre, Tree Productivity and Diversity 2 University of Copenhagen, Department of Geosciences and Natural Resource Management (IGN)
Figure 1. Projected presence
distribution of the species in
Ethiopia. Administrative
boundaries from
www.gadm.org version 3.6.
Figure 2. Administrative boundaries for Ethiopia from
www.gadm.org version 3.6.
Figure 3. Distribution of potential natural vegetation
types in Ethiopia from www.vegetationmap4africa.org
Figure 4. Projected presence
distribution of the species
across Africa. Administrative
boundaries tmap version 2.2
(Tennekes 2018).
Habitat distribution of Balanites aegyptiaca
inferred from ensemble modelling with BiodiversityR
Species distribution modelling is currently underway for
150+ priority species selected by the PATSPO project,
using similar methods of model calibrations as used for
http://www.worldagroforestry.org/atlas-central-america.
However, more sophisticated methods such as spatial
folding, spatial and environmental thinning are employed
to reduce sampling bias and the effects of spatial auto-
correlation. For native species, presence observations
from across the African continent were gathered.
Here provisional results are shown, calibrated with
presence observations that are available online. In a later
phase, additional presence observations will be included
in model calibrations and evaluations. These will be
provided by experienced botanists that will also verify the
distribution maps.
Figure 1 was created by combining information from the
www.vegetationmap4africa.org with the results of habitat
distribution mapping. Where a section of the projected
range of the species overlapped with its expected
distribution in vegetation types, the section was given the
same colouring as the vegetation map. Sections that did
not match documented vegetation types were plotted in
the grey33 R colour.
Figure 1. Projected presence
distribution of the species in
Ethiopia. Administrative
boundaries from
www.gadm.org version 3.6.
Figure 2. Administrative boundaries for Ethiopia from
www.gadm.org version 3.6.
Figure 3. Distribution of potential natural vegetation
types in Ethiopia from www.vegetationmap4africa.org
Figure 4. Projected presence
distribution of the species
across Africa. Administrative
boundaries tmap version 2.2
(Tennekes 2018).
Roeland Kindt1, Lars Graudal12, Jens-Peter B Lillesø2, Abrham Abiyu1, Soren Moestrup12, Paulo van Breugel3
1 World Agroforestry Centre, Tree Productivity and Diversity
2 University of Copenhagen, Department of Geosciences and Natural Resource Management (IGN)
3 HAS University of Applied Sciences, 's-Hertogenbosch
Habitat distribution of Cordia africana
inferred from ensemble modelling with BiodiversityR
Species distribution modelling is currently underway for
150+ priority species selected by the PATSPO project,
using similar methods of model calibrations as used for
http://www.worldagroforestry.org/atlas-central-america.
However, more sophisticated methods such as spatial
folding, spatial and environmental thinning are employed
to reduce sampling bias and the effects of spatial auto-
correlation. For native species, presence observations
from across the African continent were gathered.
Here provisional results are shown, calibrated with
presence observations that are available online. In a later
phase, additional presence observations will be included
in model calibrations and evaluations. These will be
provided by experienced botanists that will also verify the
distribution maps.
Figure 1 was created by combining information from the
www.vegetationmap4africa.org with the results of habitat
distribution mapping. Where a section of the projected
range of the species overlapped with its expected
distribution in vegetation types, the section was given the
same colouring as the vegetation map. Sections that did
not match documented vegetation types were plotted in
the grey33 R colour.
Roeland Kindt1, Lars Graudal12, Jens-Peter B Lillesø2, Abrham Abiyu1, Soren Moestrup12
1 World Agroforestry Centre, Tree Productivity and Diversity 2 University of Copenhagen, Department of Geosciences and Natural Resource Management (IGN)
Figure 1. Projected presence
distribution of the species in
Ethiopia. Administrative
boundaries from
www.gadm.org version 3.6.
Figure 2. Administrative boundaries for Ethiopia from
www.gadm.org version 3.6.
Figure 3. Distribution of potential natural vegetation
types in Ethiopia from www.vegetationmap4africa.org
Figure 4. Projected presence
distribution of the species
across Africa. Administrative
boundaries tmap version 2.2
(Tennekes 2018).
Habitat distribution of Faidherbia albida
inferred from ensemble modelling with BiodiversityR
Species distribution modelling is currently underway for
150+ priority species selected by the PATSPO project,
using similar methods of model calibrations as used for
http://www.worldagroforestry.org/atlas-central-america.
However, more sophisticated methods such as spatial
folding, spatial and environmental thinning are employed
to reduce sampling bias and the effects of spatial auto-
correlation. For native species, presence observations
from across the African continent were gathered.
Here provisional results are shown, calibrated with
presence observations that are available online. In a later
phase, additional presence observations will be included
in model calibrations and evaluations. These will be
provided by experienced botanists that will also verify the
distribution maps.
Figure 1 was created by combining information from the
www.vegetationmap4africa.org with the results of habitat
distribution mapping. Where a section of the projected
range of the species overlapped with its expected
distribution in vegetation types, the section was given the
same colouring as the vegetation map. Sections that did
not match documented vegetation types were plotted in
the grey33 R colour.
Roeland Kindt1, Lars Graudal12, Jens-Peter B Lillesø2, Abrham Abiyu1, Soren Moestrup12
1 World Agroforestry Centre, Tree Productivity and Diversity 2 University of Copenhagen, Department of Geosciences and Natural Resource Management (IGN)
Figure 1. Projected presence
distribution of the species in
Ethiopia. Administrative
boundaries from
www.gadm.org version 3.6.
Figure 2. Administrative boundaries for Ethiopia from
www.gadm.org version 3.6.
Figure 3. Distribution of potential natural vegetation
types in Ethiopia from www.vegetationmap4africa.org
Figure 4. Projected presence
distribution of the species
across Africa. Administrative
boundaries tmap version 2.2
(Tennekes 2018).
Habitat distribution of Hagenia abyssinica
inferred from ensemble modelling with BiodiversityR
Species distribution modelling is currently underway for
150+ priority species selected by the PATSPO project,
using similar methods of model calibrations as used for
http://www.worldagroforestry.org/atlas-central-america.
However, more sophisticated methods such as spatial
folding, spatial and environmental thinning are employed
to reduce sampling bias and the effects of spatial auto-
correlation. For native species, presence observations
from across the African continent were gathered.
Here provisional results are shown, calibrated with
presence observations that are available online. In a later
phase, additional presence observations will be included
in model calibrations and evaluations. These will be
provided by experienced botanists that will also verify the
distribution maps.
Figure 1 was created by combining information from the
www.vegetationmap4africa.org with the results of habitat
distribution mapping. Where a section of the projected
range of the species overlapped with its expected
distribution in vegetation types, the section was given the
same colouring as the vegetation map. Sections that did
not match documented vegetation types were plotted in
the grey33 R colour.
Roeland Kindt1, Lars Graudal12, Jens-Peter B Lillesø2, Abrham Abiyu1, Soren Moestrup12
1 World Agroforestry Centre, Tree Productivity and Diversity 2 University of Copenhagen, Department of Geosciences and Natural Resource Management (IGN)
Figure 1. Projected presence
distribution of the species in
Ethiopia. Administrative
boundaries from
www.gadm.org version 3.6.
Figure 2. Administrative boundaries for Ethiopia from
www.gadm.org version 3.6.
Figure 3. Distribution of potential natural vegetation
types in Ethiopia from www.vegetationmap4africa.org
Figure 4. Projected presence
distribution of the species
across Africa. Administrative
boundaries tmap version 2.2
(Tennekes 2018).
Habitat distribution of Juniperus procera
inferred from ensemble modelling with BiodiversityR
Species distribution modelling is currently underway for
150+ priority species selected by the PATSPO project,
using similar methods of model calibrations as used for
http://www.worldagroforestry.org/atlas-central-america.
However, more sophisticated methods such as spatial
folding, spatial and environmental thinning are employed
to reduce sampling bias and the effects of spatial auto-
correlation. For native species, presence observations
from across the African continent were gathered.
Here provisional results are shown, calibrated with
presence observations that are available online. In a later
phase, additional presence observations will be included
in model calibrations and evaluations. These will be
provided by experienced botanists that will also verify the
distribution maps.
Figure 1 was created by combining information from the
www.vegetationmap4africa.org with the results of habitat
distribution mapping. Where a section of the projected
range of the species overlapped with its expected
distribution in vegetation types, the section was given the
same colouring as the vegetation map. Sections that did
not match documented vegetation types were plotted in
the grey33 R colour.
Roeland Kindt1, Lars Graudal12, Jens-Peter B Lillesø2, Abrham Abiyu1, Soren Moestrup12
1 World Agroforestry Centre, Tree Productivity and Diversity 2 University of Copenhagen, Department of Geosciences and Natural Resource Management (IGN)
Figure 1. Projected presence
distribution of the species in
Ethiopia. Administrative
boundaries from
www.gadm.org version 3.6.
Figure 2. Administrative boundaries for Ethiopia from
www.gadm.org version 3.6.
Figure 3. Distribution of potential natural vegetation
types in Ethiopia from www.vegetationmap4africa.org
Figure 4. Projected presence
distribution of the species
across Africa. Administrative
boundaries tmap version 2.2
(Tennekes 2018).
Habitat distribution of Tamarindus indica
inferred from ensemble modelling with BiodiversityR
Species distribution modelling is currently underway for
150+ priority species selected by the PATSPO project,
using similar methods of model calibrations as used for
http://www.worldagroforestry.org/atlas-central-america.
However, more sophisticated methods such as spatial
folding, spatial and environmental thinning are employed
to reduce sampling bias and the effects of spatial auto-
correlation. For native species, presence observations
from across the African continent were gathered.
Here provisional results are shown, calibrated with
presence observations that are available online. In a later
phase, additional presence observations will be included
in model calibrations and evaluations. These will be
provided by experienced botanists that will also verify the
distribution maps.
Figure 1 was created by combining information from the
www.vegetationmap4africa.org with the results of habitat
distribution mapping. Where a section of the projected
range of the species overlapped with its expected
distribution in vegetation types, the section was given the
same colouring as the vegetation map. Sections that did
not match documented vegetation types were plotted in
the grey33 R colour.
Figure 1. Projected presence
distribution of the species in
Ethiopia. Administrative
boundaries from
www.gadm.org version 3.6.
Figure 2. Administrative boundaries for Ethiopia from
www.gadm.org version 3.6.
Figure 3. Distribution of potential natural vegetation
types in Ethiopia from www.vegetationmap4africa.org
Figure 4. Projected presence
distribution of the species
across Africa. Administrative
boundaries tmap version 2.2
(Tennekes 2018).
Roeland Kindt1, Lars Graudal12, Jens-Peter B Lillesø2, Abrham Abiyu1, Soren Moestrup12, Paulo van Breugel3
1 World Agroforestry Centre, Tree Productivity and Diversity
2 University of Copenhagen, Department of Geosciences and Natural Resource Management (IGN)
3 HAS University of Applied Sciences, 's-Hertogenbosch
Habitat distribution of Ziziphus jujuba
inferred from ensemble modelling with BiodiversityR
Species distribution modelling is currently underway for
150+ priority species selected by the PATSPO project,
using similar methods of model calibrations as used for
http://www.worldagroforestry.org/atlas-central-america.
However, more sophisticated methods such as spatial
folding, spatial and environmental thinning are employed
to reduce sampling bias and the effects of spatial auto-
correlation. For native species, presence observations
from across the African continent were gathered.
Here provisional results are shown, calibrated with
presence observations that are available online. In a later
phase, additional presence observations will be included
in model calibrations and evaluations. These will be
provided by experienced botanists that will also verify the
distribution maps.
Figure 1 was created by combining information from the
www.vegetationmap4africa.org with the results of habitat
distribution mapping. Where a section of the projected
range of the species overlapped with its expected
distribution in vegetation types, the section was given the
same colouring as the vegetation map. Sections that did
not match documented vegetation types were plotted in
the grey33 R colour.
Roeland Kindt1, Lars Graudal12, Jens-Peter B Lillesø2, Abrham Abiyu1, Soren Moestrup12
1 World Agroforestry Centre, Tree Productivity and Diversity 2 University of Copenhagen, Department of Geosciences and Natural Resource Management (IGN)
Figure 1. Projected presence
distribution of the species in
Ethiopia. Administrative
boundaries from
www.gadm.org version 3.6.
Figure 2. Administrative boundaries for Ethiopia from
www.gadm.org version 3.6.
Figure 3. Distribution of potential natural vegetation
types in Ethiopia from www.vegetationmap4africa.org
Figure 4. Projected presence
distribution of the species
across Africa. Administrative
boundaries tmap version 2.2
(Tennekes 2018).

More Related Content

Similar to Wall posters on habitat distribution of nine tree species in Ethiopia

Chasing a Unicorn for Model Host-Microbiome-Systems
Chasing a Unicorn for Model Host-Microbiome-Systems Chasing a Unicorn for Model Host-Microbiome-Systems
Chasing a Unicorn for Model Host-Microbiome-Systems Jonathan Eisen
 
Andy J Value Of A Coordinate Montpellier Nov 2009
Andy J   Value Of A Coordinate Montpellier Nov 2009Andy J   Value Of A Coordinate Montpellier Nov 2009
Andy J Value Of A Coordinate Montpellier Nov 2009CIAT
 
The first in-depth insight into the genetic diversity of a buffelgrass (Cench...
The first in-depth insight into the genetic diversity of a buffelgrass (Cench...The first in-depth insight into the genetic diversity of a buffelgrass (Cench...
The first in-depth insight into the genetic diversity of a buffelgrass (Cench...ILRI
 
Improving the correlation hunting in a large quantity of SOM component planes
Improving the correlation hunting in a largequantity of SOM component planesImproving the correlation hunting in a largequantity of SOM component planes
Improving the correlation hunting in a large quantity of SOM component planesaskroll
 
Seed morphometric studies of some Kenaf ( Hibiscus canabinus ) accessions
Seed morphometric studies of some Kenaf ( Hibiscus canabinus ) accessions Seed morphometric studies of some Kenaf ( Hibiscus canabinus ) accessions
Seed morphometric studies of some Kenaf ( Hibiscus canabinus ) accessions researchagriculture
 

Similar to Wall posters on habitat distribution of nine tree species in Ethiopia (6)

Chasing a Unicorn for Model Host-Microbiome-Systems
Chasing a Unicorn for Model Host-Microbiome-Systems Chasing a Unicorn for Model Host-Microbiome-Systems
Chasing a Unicorn for Model Host-Microbiome-Systems
 
Andy J Value Of A Coordinate Montpellier Nov 2009
Andy J   Value Of A Coordinate Montpellier Nov 2009Andy J   Value Of A Coordinate Montpellier Nov 2009
Andy J Value Of A Coordinate Montpellier Nov 2009
 
Andy Jarvis - Value Of A Coordinate Montpellier Nov 2009
Andy Jarvis  - Value Of A Coordinate Montpellier Nov 2009Andy Jarvis  - Value Of A Coordinate Montpellier Nov 2009
Andy Jarvis - Value Of A Coordinate Montpellier Nov 2009
 
The first in-depth insight into the genetic diversity of a buffelgrass (Cench...
The first in-depth insight into the genetic diversity of a buffelgrass (Cench...The first in-depth insight into the genetic diversity of a buffelgrass (Cench...
The first in-depth insight into the genetic diversity of a buffelgrass (Cench...
 
Improving the correlation hunting in a large quantity of SOM component planes
Improving the correlation hunting in a largequantity of SOM component planesImproving the correlation hunting in a largequantity of SOM component planes
Improving the correlation hunting in a large quantity of SOM component planes
 
Seed morphometric studies of some Kenaf ( Hibiscus canabinus ) accessions
Seed morphometric studies of some Kenaf ( Hibiscus canabinus ) accessions Seed morphometric studies of some Kenaf ( Hibiscus canabinus ) accessions
Seed morphometric studies of some Kenaf ( Hibiscus canabinus ) accessions
 

More from World Agroforestry (ICRAF)

Resilience of rubber based agroforestry facing global change
Resilience of rubber based agroforestry facing global changeResilience of rubber based agroforestry facing global change
Resilience of rubber based agroforestry facing global changeWorld Agroforestry (ICRAF)
 
How can we overcome obstacles and mobilize investments for successful, sustai...
How can we overcome obstacles and mobilize investments for successful, sustai...How can we overcome obstacles and mobilize investments for successful, sustai...
How can we overcome obstacles and mobilize investments for successful, sustai...World Agroforestry (ICRAF)
 
Forest and agroforesty options for building resilience in refugee situations:...
Forest and agroforesty options for building resilience in refugee situations:...Forest and agroforesty options for building resilience in refugee situations:...
Forest and agroforesty options for building resilience in refugee situations:...World Agroforestry (ICRAF)
 
How local application of agroecological principles can transform food systems
How local application of agroecological principles can transform food systemsHow local application of agroecological principles can transform food systems
How local application of agroecological principles can transform food systemsWorld Agroforestry (ICRAF)
 
Agroforestry systems for restoration in Brazil: reconciling social and ecolo...
Agroforestry systems for restoration in Brazil:  reconciling social and ecolo...Agroforestry systems for restoration in Brazil:  reconciling social and ecolo...
Agroforestry systems for restoration in Brazil: reconciling social and ecolo...World Agroforestry (ICRAF)
 
Vulnerabilities of forests and forest dependent people
Vulnerabilities of forests and forest dependent peopleVulnerabilities of forests and forest dependent people
Vulnerabilities of forests and forest dependent peopleWorld Agroforestry (ICRAF)
 
Pests and diseases of trees in Africa: review of a growing emergency
Pests and diseases of trees in Africa: review of a growing emergencyPests and diseases of trees in Africa: review of a growing emergency
Pests and diseases of trees in Africa: review of a growing emergencyWorld Agroforestry (ICRAF)
 
Not all roads lead to Rome: Inclusive business models and responsible finance...
Not all roads lead to Rome: Inclusive business models and responsible finance...Not all roads lead to Rome: Inclusive business models and responsible finance...
Not all roads lead to Rome: Inclusive business models and responsible finance...World Agroforestry (ICRAF)
 
Decent work and economic growth: Potential impacts of SDG 8 on forests and fo...
Decent work and economic growth: Potential impacts of SDG 8 on forests and fo...Decent work and economic growth: Potential impacts of SDG 8 on forests and fo...
Decent work and economic growth: Potential impacts of SDG 8 on forests and fo...World Agroforestry (ICRAF)
 
Forest conservation and socio-economic benefits through community forest conc...
Forest conservation and socio-economic benefits through community forest conc...Forest conservation and socio-economic benefits through community forest conc...
Forest conservation and socio-economic benefits through community forest conc...World Agroforestry (ICRAF)
 
Sustainable land management for improved livelihoods and environmental sustai...
Sustainable land management for improved livelihoods and environmental sustai...Sustainable land management for improved livelihoods and environmental sustai...
Sustainable land management for improved livelihoods and environmental sustai...World Agroforestry (ICRAF)
 
Rangeland Management in Africa Research and case studies
Rangeland Management in Africa Research and case studiesRangeland Management in Africa Research and case studies
Rangeland Management in Africa Research and case studiesWorld Agroforestry (ICRAF)
 
Sustainable transition of shifting cultivation systems for land degradation n...
Sustainable transition of shifting cultivation systems for land degradation n...Sustainable transition of shifting cultivation systems for land degradation n...
Sustainable transition of shifting cultivation systems for land degradation n...World Agroforestry (ICRAF)
 
Understanding farmer behavior and options to improve outcomes
Understanding farmer behavior and options to improve outcomesUnderstanding farmer behavior and options to improve outcomes
Understanding farmer behavior and options to improve outcomesWorld Agroforestry (ICRAF)
 
NRM Innovations for Risk Management and Agricultural Transformation in Semiar...
NRM Innovations for Risk Management and Agricultural Transformation in Semiar...NRM Innovations for Risk Management and Agricultural Transformation in Semiar...
NRM Innovations for Risk Management and Agricultural Transformation in Semiar...World Agroforestry (ICRAF)
 
Combining land restoration and livelihoods - examples from Niger
Combining land restoration and livelihoods - examples from NigerCombining land restoration and livelihoods - examples from Niger
Combining land restoration and livelihoods - examples from NigerWorld Agroforestry (ICRAF)
 
Applying the Research in Development Approach to Scale Restoration
Applying the Research in Development Approach to Scale RestorationApplying the Research in Development Approach to Scale Restoration
Applying the Research in Development Approach to Scale RestorationWorld Agroforestry (ICRAF)
 

More from World Agroforestry (ICRAF) (20)

Resilience of rubber based agroforestry facing global change
Resilience of rubber based agroforestry facing global changeResilience of rubber based agroforestry facing global change
Resilience of rubber based agroforestry facing global change
 
DryDev Closeout Webinar 30th June 2020
DryDev Closeout Webinar 30th June 2020DryDev Closeout Webinar 30th June 2020
DryDev Closeout Webinar 30th June 2020
 
Farmland Biodiversity
Farmland BiodiversityFarmland Biodiversity
Farmland Biodiversity
 
How can we overcome obstacles and mobilize investments for successful, sustai...
How can we overcome obstacles and mobilize investments for successful, sustai...How can we overcome obstacles and mobilize investments for successful, sustai...
How can we overcome obstacles and mobilize investments for successful, sustai...
 
Forest and agroforesty options for building resilience in refugee situations:...
Forest and agroforesty options for building resilience in refugee situations:...Forest and agroforesty options for building resilience in refugee situations:...
Forest and agroforesty options for building resilience in refugee situations:...
 
How local application of agroecological principles can transform food systems
How local application of agroecological principles can transform food systemsHow local application of agroecological principles can transform food systems
How local application of agroecological principles can transform food systems
 
Agroforestry systems for restoration in Brazil: reconciling social and ecolo...
Agroforestry systems for restoration in Brazil:  reconciling social and ecolo...Agroforestry systems for restoration in Brazil:  reconciling social and ecolo...
Agroforestry systems for restoration in Brazil: reconciling social and ecolo...
 
Vulnerabilities of forests and forest dependent people
Vulnerabilities of forests and forest dependent peopleVulnerabilities of forests and forest dependent people
Vulnerabilities of forests and forest dependent people
 
Pests and diseases of trees in Africa: review of a growing emergency
Pests and diseases of trees in Africa: review of a growing emergencyPests and diseases of trees in Africa: review of a growing emergency
Pests and diseases of trees in Africa: review of a growing emergency
 
Not all roads lead to Rome: Inclusive business models and responsible finance...
Not all roads lead to Rome: Inclusive business models and responsible finance...Not all roads lead to Rome: Inclusive business models and responsible finance...
Not all roads lead to Rome: Inclusive business models and responsible finance...
 
Decent work and economic growth: Potential impacts of SDG 8 on forests and fo...
Decent work and economic growth: Potential impacts of SDG 8 on forests and fo...Decent work and economic growth: Potential impacts of SDG 8 on forests and fo...
Decent work and economic growth: Potential impacts of SDG 8 on forests and fo...
 
Forest conservation and socio-economic benefits through community forest conc...
Forest conservation and socio-economic benefits through community forest conc...Forest conservation and socio-economic benefits through community forest conc...
Forest conservation and socio-economic benefits through community forest conc...
 
Sustainable land management for improved livelihoods and environmental sustai...
Sustainable land management for improved livelihoods and environmental sustai...Sustainable land management for improved livelihoods and environmental sustai...
Sustainable land management for improved livelihoods and environmental sustai...
 
Rangeland Management in Africa Research and case studies
Rangeland Management in Africa Research and case studiesRangeland Management in Africa Research and case studies
Rangeland Management in Africa Research and case studies
 
Sustainable transition of shifting cultivation systems for land degradation n...
Sustainable transition of shifting cultivation systems for land degradation n...Sustainable transition of shifting cultivation systems for land degradation n...
Sustainable transition of shifting cultivation systems for land degradation n...
 
Understanding farmer behavior and options to improve outcomes
Understanding farmer behavior and options to improve outcomesUnderstanding farmer behavior and options to improve outcomes
Understanding farmer behavior and options to improve outcomes
 
Scaling watershed development in India
Scaling watershed development in IndiaScaling watershed development in India
Scaling watershed development in India
 
NRM Innovations for Risk Management and Agricultural Transformation in Semiar...
NRM Innovations for Risk Management and Agricultural Transformation in Semiar...NRM Innovations for Risk Management and Agricultural Transformation in Semiar...
NRM Innovations for Risk Management and Agricultural Transformation in Semiar...
 
Combining land restoration and livelihoods - examples from Niger
Combining land restoration and livelihoods - examples from NigerCombining land restoration and livelihoods - examples from Niger
Combining land restoration and livelihoods - examples from Niger
 
Applying the Research in Development Approach to Scale Restoration
Applying the Research in Development Approach to Scale RestorationApplying the Research in Development Approach to Scale Restoration
Applying the Research in Development Approach to Scale Restoration
 

Recently uploaded

TEST BANK For Radiologic Science for Technologists, 12th Edition by Stewart C...
TEST BANK For Radiologic Science for Technologists, 12th Edition by Stewart C...TEST BANK For Radiologic Science for Technologists, 12th Edition by Stewart C...
TEST BANK For Radiologic Science for Technologists, 12th Edition by Stewart C...ssifa0344
 
GUIDELINES ON SIMILAR BIOLOGICS Regulatory Requirements for Marketing Authori...
GUIDELINES ON SIMILAR BIOLOGICS Regulatory Requirements for Marketing Authori...GUIDELINES ON SIMILAR BIOLOGICS Regulatory Requirements for Marketing Authori...
GUIDELINES ON SIMILAR BIOLOGICS Regulatory Requirements for Marketing Authori...Lokesh Kothari
 
GBSN - Microbiology (Unit 1)
GBSN - Microbiology (Unit 1)GBSN - Microbiology (Unit 1)
GBSN - Microbiology (Unit 1)Areesha Ahmad
 
Green chemistry and Sustainable development.pptx
Green chemistry  and Sustainable development.pptxGreen chemistry  and Sustainable development.pptx
Green chemistry and Sustainable development.pptxRajatChauhan518211
 
Pulmonary drug delivery system M.pharm -2nd sem P'ceutics
Pulmonary drug delivery system M.pharm -2nd sem P'ceuticsPulmonary drug delivery system M.pharm -2nd sem P'ceutics
Pulmonary drug delivery system M.pharm -2nd sem P'ceuticssakshisoni2385
 
Biological Classification BioHack (3).pdf
Biological Classification BioHack (3).pdfBiological Classification BioHack (3).pdf
Biological Classification BioHack (3).pdfmuntazimhurra
 
Chemistry 4th semester series (krishna).pdf
Chemistry 4th semester series (krishna).pdfChemistry 4th semester series (krishna).pdf
Chemistry 4th semester series (krishna).pdfSumit Kumar yadav
 
Seismic Method Estimate velocity from seismic data.pptx
Seismic Method Estimate velocity from seismic  data.pptxSeismic Method Estimate velocity from seismic  data.pptx
Seismic Method Estimate velocity from seismic data.pptxAlMamun560346
 
Biopesticide (2).pptx .This slides helps to know the different types of biop...
Biopesticide (2).pptx  .This slides helps to know the different types of biop...Biopesticide (2).pptx  .This slides helps to know the different types of biop...
Biopesticide (2).pptx .This slides helps to know the different types of biop...RohitNehra6
 
9654467111 Call Girls In Raj Nagar Delhi Short 1500 Night 6000
9654467111 Call Girls In Raj Nagar Delhi Short 1500 Night 60009654467111 Call Girls In Raj Nagar Delhi Short 1500 Night 6000
9654467111 Call Girls In Raj Nagar Delhi Short 1500 Night 6000Sapana Sha
 
Botany krishna series 2nd semester Only Mcq type questions
Botany krishna series 2nd semester Only Mcq type questionsBotany krishna series 2nd semester Only Mcq type questions
Botany krishna series 2nd semester Only Mcq type questionsSumit Kumar yadav
 
❤Jammu Kashmir Call Girls 8617697112 Personal Whatsapp Number 💦✅.
❤Jammu Kashmir Call Girls 8617697112 Personal Whatsapp Number 💦✅.❤Jammu Kashmir Call Girls 8617697112 Personal Whatsapp Number 💦✅.
❤Jammu Kashmir Call Girls 8617697112 Personal Whatsapp Number 💦✅.Nitya salvi
 
Disentangling the origin of chemical differences using GHOST
Disentangling the origin of chemical differences using GHOSTDisentangling the origin of chemical differences using GHOST
Disentangling the origin of chemical differences using GHOSTSérgio Sacani
 
Bacterial Identification and Classifications
Bacterial Identification and ClassificationsBacterial Identification and Classifications
Bacterial Identification and ClassificationsAreesha Ahmad
 
Botany 4th semester series (krishna).pdf
Botany 4th semester series (krishna).pdfBotany 4th semester series (krishna).pdf
Botany 4th semester series (krishna).pdfSumit Kumar yadav
 
Stunning ➥8448380779▻ Call Girls In Panchshil Enclave Delhi NCR
Stunning ➥8448380779▻ Call Girls In Panchshil Enclave Delhi NCRStunning ➥8448380779▻ Call Girls In Panchshil Enclave Delhi NCR
Stunning ➥8448380779▻ Call Girls In Panchshil Enclave Delhi NCRDelhi Call girls
 
Recombinant DNA technology (Immunological screening)
Recombinant DNA technology (Immunological screening)Recombinant DNA technology (Immunological screening)
Recombinant DNA technology (Immunological screening)PraveenaKalaiselvan1
 
Pests of cotton_Borer_Pests_Binomics_Dr.UPR.pdf
Pests of cotton_Borer_Pests_Binomics_Dr.UPR.pdfPests of cotton_Borer_Pests_Binomics_Dr.UPR.pdf
Pests of cotton_Borer_Pests_Binomics_Dr.UPR.pdfPirithiRaju
 
High Class Escorts in Hyderabad ₹7.5k Pick Up & Drop With Cash Payment 969456...
High Class Escorts in Hyderabad ₹7.5k Pick Up & Drop With Cash Payment 969456...High Class Escorts in Hyderabad ₹7.5k Pick Up & Drop With Cash Payment 969456...
High Class Escorts in Hyderabad ₹7.5k Pick Up & Drop With Cash Payment 969456...chandars293
 

Recently uploaded (20)

TEST BANK For Radiologic Science for Technologists, 12th Edition by Stewart C...
TEST BANK For Radiologic Science for Technologists, 12th Edition by Stewart C...TEST BANK For Radiologic Science for Technologists, 12th Edition by Stewart C...
TEST BANK For Radiologic Science for Technologists, 12th Edition by Stewart C...
 
GUIDELINES ON SIMILAR BIOLOGICS Regulatory Requirements for Marketing Authori...
GUIDELINES ON SIMILAR BIOLOGICS Regulatory Requirements for Marketing Authori...GUIDELINES ON SIMILAR BIOLOGICS Regulatory Requirements for Marketing Authori...
GUIDELINES ON SIMILAR BIOLOGICS Regulatory Requirements for Marketing Authori...
 
GBSN - Microbiology (Unit 1)
GBSN - Microbiology (Unit 1)GBSN - Microbiology (Unit 1)
GBSN - Microbiology (Unit 1)
 
Green chemistry and Sustainable development.pptx
Green chemistry  and Sustainable development.pptxGreen chemistry  and Sustainable development.pptx
Green chemistry and Sustainable development.pptx
 
CELL -Structural and Functional unit of life.pdf
CELL -Structural and Functional unit of life.pdfCELL -Structural and Functional unit of life.pdf
CELL -Structural and Functional unit of life.pdf
 
Pulmonary drug delivery system M.pharm -2nd sem P'ceutics
Pulmonary drug delivery system M.pharm -2nd sem P'ceuticsPulmonary drug delivery system M.pharm -2nd sem P'ceutics
Pulmonary drug delivery system M.pharm -2nd sem P'ceutics
 
Biological Classification BioHack (3).pdf
Biological Classification BioHack (3).pdfBiological Classification BioHack (3).pdf
Biological Classification BioHack (3).pdf
 
Chemistry 4th semester series (krishna).pdf
Chemistry 4th semester series (krishna).pdfChemistry 4th semester series (krishna).pdf
Chemistry 4th semester series (krishna).pdf
 
Seismic Method Estimate velocity from seismic data.pptx
Seismic Method Estimate velocity from seismic  data.pptxSeismic Method Estimate velocity from seismic  data.pptx
Seismic Method Estimate velocity from seismic data.pptx
 
Biopesticide (2).pptx .This slides helps to know the different types of biop...
Biopesticide (2).pptx  .This slides helps to know the different types of biop...Biopesticide (2).pptx  .This slides helps to know the different types of biop...
Biopesticide (2).pptx .This slides helps to know the different types of biop...
 
9654467111 Call Girls In Raj Nagar Delhi Short 1500 Night 6000
9654467111 Call Girls In Raj Nagar Delhi Short 1500 Night 60009654467111 Call Girls In Raj Nagar Delhi Short 1500 Night 6000
9654467111 Call Girls In Raj Nagar Delhi Short 1500 Night 6000
 
Botany krishna series 2nd semester Only Mcq type questions
Botany krishna series 2nd semester Only Mcq type questionsBotany krishna series 2nd semester Only Mcq type questions
Botany krishna series 2nd semester Only Mcq type questions
 
❤Jammu Kashmir Call Girls 8617697112 Personal Whatsapp Number 💦✅.
❤Jammu Kashmir Call Girls 8617697112 Personal Whatsapp Number 💦✅.❤Jammu Kashmir Call Girls 8617697112 Personal Whatsapp Number 💦✅.
❤Jammu Kashmir Call Girls 8617697112 Personal Whatsapp Number 💦✅.
 
Disentangling the origin of chemical differences using GHOST
Disentangling the origin of chemical differences using GHOSTDisentangling the origin of chemical differences using GHOST
Disentangling the origin of chemical differences using GHOST
 
Bacterial Identification and Classifications
Bacterial Identification and ClassificationsBacterial Identification and Classifications
Bacterial Identification and Classifications
 
Botany 4th semester series (krishna).pdf
Botany 4th semester series (krishna).pdfBotany 4th semester series (krishna).pdf
Botany 4th semester series (krishna).pdf
 
Stunning ➥8448380779▻ Call Girls In Panchshil Enclave Delhi NCR
Stunning ➥8448380779▻ Call Girls In Panchshil Enclave Delhi NCRStunning ➥8448380779▻ Call Girls In Panchshil Enclave Delhi NCR
Stunning ➥8448380779▻ Call Girls In Panchshil Enclave Delhi NCR
 
Recombinant DNA technology (Immunological screening)
Recombinant DNA technology (Immunological screening)Recombinant DNA technology (Immunological screening)
Recombinant DNA technology (Immunological screening)
 
Pests of cotton_Borer_Pests_Binomics_Dr.UPR.pdf
Pests of cotton_Borer_Pests_Binomics_Dr.UPR.pdfPests of cotton_Borer_Pests_Binomics_Dr.UPR.pdf
Pests of cotton_Borer_Pests_Binomics_Dr.UPR.pdf
 
High Class Escorts in Hyderabad ₹7.5k Pick Up & Drop With Cash Payment 969456...
High Class Escorts in Hyderabad ₹7.5k Pick Up & Drop With Cash Payment 969456...High Class Escorts in Hyderabad ₹7.5k Pick Up & Drop With Cash Payment 969456...
High Class Escorts in Hyderabad ₹7.5k Pick Up & Drop With Cash Payment 969456...
 

Wall posters on habitat distribution of nine tree species in Ethiopia

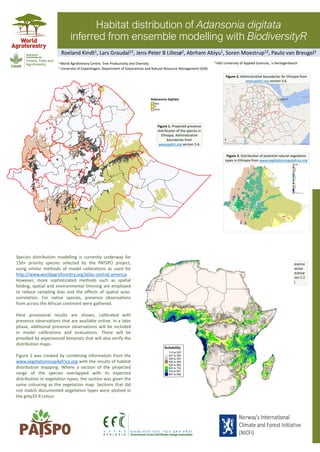
  • 1. Habitat distribution of Adansonia digitata inferred from ensemble modelling with BiodiversityR Species distribution modelling is currently underway for 150+ priority species selected by the PATSPO project, using similar methods of model calibrations as used for http://www.worldagroforestry.org/atlas-central-america. However, more sophisticated methods such as spatial folding, spatial and environmental thinning are employed to reduce sampling bias and the effects of spatial auto- correlation. For native species, presence observations from across the African continent were gathered. Here provisional results are shown, calibrated with presence observations that are available online. In a later phase, additional presence observations will be included in model calibrations and evaluations. These will be provided by experienced botanists that will also verify the distribution maps. Figure 1 was created by combining information from the www.vegetationmap4africa.org with the results of habitat distribution mapping. Where a section of the projected range of the species overlapped with its expected distribution in vegetation types, the section was given the same colouring as the vegetation map. Sections that did not match documented vegetation types were plotted in the grey33 R colour. Figure 1. Projected presence distribution of the species in Ethiopia. Administrative boundaries from www.gadm.org version 3.6. Figure 2. Administrative boundaries for Ethiopia from www.gadm.org version 3.6. Figure 3. Distribution of potential natural vegetation types in Ethiopia from www.vegetationmap4africa.org Figure 4. Projected presence distribution of the species across Africa. Administrative boundaries tmap version 2.2 (Tennekes 2018). Roeland Kindt1, Lars Graudal12, Jens-Peter B Lillesø2, Abrham Abiyu1, Soren Moestrup12, Paulo van Breugel3 1 World Agroforestry Centre, Tree Productivity and Diversity 2 University of Copenhagen, Department of Geosciences and Natural Resource Management (IGN) 3 HAS University of Applied Sciences, 's-Hertogenbosch
  • 2. Habitat distribution of Afrocarpus falcatus inferred from ensemble modelling with BiodiversityR Species distribution modelling is currently underway for 150+ priority species selected by the PATSPO project, using similar methods of model calibrations as used for http://www.worldagroforestry.org/atlas-central-america. However, more sophisticated methods such as spatial folding, spatial and environmental thinning are employed to reduce sampling bias and the effects of spatial auto- correlation. For native species, presence observations from across the African continent were gathered. Here provisional results are shown, calibrated with presence observations that are available online. In a later phase, additional presence observations will be included in model calibrations and evaluations. These will be provided by experienced botanists that will also verify the distribution maps. Figure 1 was created by combining information from the www.vegetationmap4africa.org with the results of habitat distribution mapping. Where a section of the projected range of the species overlapped with its expected distribution in vegetation types, the section was given the same colouring as the vegetation map. Sections that did not match documented vegetation types were plotted in the grey33 R colour. Roeland Kindt1, Lars Graudal12, Jens-Peter B Lillesø2, Abrham Abiyu1, Soren Moestrup12 1 World Agroforestry Centre, Tree Productivity and Diversity 2 University of Copenhagen, Department of Geosciences and Natural Resource Management (IGN) Figure 1. Projected presence distribution of the species in Ethiopia. Administrative boundaries from www.gadm.org version 3.6. Figure 2. Administrative boundaries for Ethiopia from www.gadm.org version 3.6. Figure 3. Distribution of potential natural vegetation types in Ethiopia from www.vegetationmap4africa.org Figure 4. Projected presence distribution of the species across Africa. Administrative boundaries tmap version 2.2 (Tennekes 2018).
  • 3. Habitat distribution of Balanites aegyptiaca inferred from ensemble modelling with BiodiversityR Species distribution modelling is currently underway for 150+ priority species selected by the PATSPO project, using similar methods of model calibrations as used for http://www.worldagroforestry.org/atlas-central-america. However, more sophisticated methods such as spatial folding, spatial and environmental thinning are employed to reduce sampling bias and the effects of spatial auto- correlation. For native species, presence observations from across the African continent were gathered. Here provisional results are shown, calibrated with presence observations that are available online. In a later phase, additional presence observations will be included in model calibrations and evaluations. These will be provided by experienced botanists that will also verify the distribution maps. Figure 1 was created by combining information from the www.vegetationmap4africa.org with the results of habitat distribution mapping. Where a section of the projected range of the species overlapped with its expected distribution in vegetation types, the section was given the same colouring as the vegetation map. Sections that did not match documented vegetation types were plotted in the grey33 R colour. Figure 1. Projected presence distribution of the species in Ethiopia. Administrative boundaries from www.gadm.org version 3.6. Figure 2. Administrative boundaries for Ethiopia from www.gadm.org version 3.6. Figure 3. Distribution of potential natural vegetation types in Ethiopia from www.vegetationmap4africa.org Figure 4. Projected presence distribution of the species across Africa. Administrative boundaries tmap version 2.2 (Tennekes 2018). Roeland Kindt1, Lars Graudal12, Jens-Peter B Lillesø2, Abrham Abiyu1, Soren Moestrup12, Paulo van Breugel3 1 World Agroforestry Centre, Tree Productivity and Diversity 2 University of Copenhagen, Department of Geosciences and Natural Resource Management (IGN) 3 HAS University of Applied Sciences, 's-Hertogenbosch
  • 4. Habitat distribution of Cordia africana inferred from ensemble modelling with BiodiversityR Species distribution modelling is currently underway for 150+ priority species selected by the PATSPO project, using similar methods of model calibrations as used for http://www.worldagroforestry.org/atlas-central-america. However, more sophisticated methods such as spatial folding, spatial and environmental thinning are employed to reduce sampling bias and the effects of spatial auto- correlation. For native species, presence observations from across the African continent were gathered. Here provisional results are shown, calibrated with presence observations that are available online. In a later phase, additional presence observations will be included in model calibrations and evaluations. These will be provided by experienced botanists that will also verify the distribution maps. Figure 1 was created by combining information from the www.vegetationmap4africa.org with the results of habitat distribution mapping. Where a section of the projected range of the species overlapped with its expected distribution in vegetation types, the section was given the same colouring as the vegetation map. Sections that did not match documented vegetation types were plotted in the grey33 R colour. Roeland Kindt1, Lars Graudal12, Jens-Peter B Lillesø2, Abrham Abiyu1, Soren Moestrup12 1 World Agroforestry Centre, Tree Productivity and Diversity 2 University of Copenhagen, Department of Geosciences and Natural Resource Management (IGN) Figure 1. Projected presence distribution of the species in Ethiopia. Administrative boundaries from www.gadm.org version 3.6. Figure 2. Administrative boundaries for Ethiopia from www.gadm.org version 3.6. Figure 3. Distribution of potential natural vegetation types in Ethiopia from www.vegetationmap4africa.org Figure 4. Projected presence distribution of the species across Africa. Administrative boundaries tmap version 2.2 (Tennekes 2018).
  • 5. Habitat distribution of Faidherbia albida inferred from ensemble modelling with BiodiversityR Species distribution modelling is currently underway for 150+ priority species selected by the PATSPO project, using similar methods of model calibrations as used for http://www.worldagroforestry.org/atlas-central-america. However, more sophisticated methods such as spatial folding, spatial and environmental thinning are employed to reduce sampling bias and the effects of spatial auto- correlation. For native species, presence observations from across the African continent were gathered. Here provisional results are shown, calibrated with presence observations that are available online. In a later phase, additional presence observations will be included in model calibrations and evaluations. These will be provided by experienced botanists that will also verify the distribution maps. Figure 1 was created by combining information from the www.vegetationmap4africa.org with the results of habitat distribution mapping. Where a section of the projected range of the species overlapped with its expected distribution in vegetation types, the section was given the same colouring as the vegetation map. Sections that did not match documented vegetation types were plotted in the grey33 R colour. Roeland Kindt1, Lars Graudal12, Jens-Peter B Lillesø2, Abrham Abiyu1, Soren Moestrup12 1 World Agroforestry Centre, Tree Productivity and Diversity 2 University of Copenhagen, Department of Geosciences and Natural Resource Management (IGN) Figure 1. Projected presence distribution of the species in Ethiopia. Administrative boundaries from www.gadm.org version 3.6. Figure 2. Administrative boundaries for Ethiopia from www.gadm.org version 3.6. Figure 3. Distribution of potential natural vegetation types in Ethiopia from www.vegetationmap4africa.org Figure 4. Projected presence distribution of the species across Africa. Administrative boundaries tmap version 2.2 (Tennekes 2018).
  • 6. Habitat distribution of Hagenia abyssinica inferred from ensemble modelling with BiodiversityR Species distribution modelling is currently underway for 150+ priority species selected by the PATSPO project, using similar methods of model calibrations as used for http://www.worldagroforestry.org/atlas-central-america. However, more sophisticated methods such as spatial folding, spatial and environmental thinning are employed to reduce sampling bias and the effects of spatial auto- correlation. For native species, presence observations from across the African continent were gathered. Here provisional results are shown, calibrated with presence observations that are available online. In a later phase, additional presence observations will be included in model calibrations and evaluations. These will be provided by experienced botanists that will also verify the distribution maps. Figure 1 was created by combining information from the www.vegetationmap4africa.org with the results of habitat distribution mapping. Where a section of the projected range of the species overlapped with its expected distribution in vegetation types, the section was given the same colouring as the vegetation map. Sections that did not match documented vegetation types were plotted in the grey33 R colour. Roeland Kindt1, Lars Graudal12, Jens-Peter B Lillesø2, Abrham Abiyu1, Soren Moestrup12 1 World Agroforestry Centre, Tree Productivity and Diversity 2 University of Copenhagen, Department of Geosciences and Natural Resource Management (IGN) Figure 1. Projected presence distribution of the species in Ethiopia. Administrative boundaries from www.gadm.org version 3.6. Figure 2. Administrative boundaries for Ethiopia from www.gadm.org version 3.6. Figure 3. Distribution of potential natural vegetation types in Ethiopia from www.vegetationmap4africa.org Figure 4. Projected presence distribution of the species across Africa. Administrative boundaries tmap version 2.2 (Tennekes 2018).
  • 7. Habitat distribution of Juniperus procera inferred from ensemble modelling with BiodiversityR Species distribution modelling is currently underway for 150+ priority species selected by the PATSPO project, using similar methods of model calibrations as used for http://www.worldagroforestry.org/atlas-central-america. However, more sophisticated methods such as spatial folding, spatial and environmental thinning are employed to reduce sampling bias and the effects of spatial auto- correlation. For native species, presence observations from across the African continent were gathered. Here provisional results are shown, calibrated with presence observations that are available online. In a later phase, additional presence observations will be included in model calibrations and evaluations. These will be provided by experienced botanists that will also verify the distribution maps. Figure 1 was created by combining information from the www.vegetationmap4africa.org with the results of habitat distribution mapping. Where a section of the projected range of the species overlapped with its expected distribution in vegetation types, the section was given the same colouring as the vegetation map. Sections that did not match documented vegetation types were plotted in the grey33 R colour. Roeland Kindt1, Lars Graudal12, Jens-Peter B Lillesø2, Abrham Abiyu1, Soren Moestrup12 1 World Agroforestry Centre, Tree Productivity and Diversity 2 University of Copenhagen, Department of Geosciences and Natural Resource Management (IGN) Figure 1. Projected presence distribution of the species in Ethiopia. Administrative boundaries from www.gadm.org version 3.6. Figure 2. Administrative boundaries for Ethiopia from www.gadm.org version 3.6. Figure 3. Distribution of potential natural vegetation types in Ethiopia from www.vegetationmap4africa.org Figure 4. Projected presence distribution of the species across Africa. Administrative boundaries tmap version 2.2 (Tennekes 2018).
  • 8. Habitat distribution of Tamarindus indica inferred from ensemble modelling with BiodiversityR Species distribution modelling is currently underway for 150+ priority species selected by the PATSPO project, using similar methods of model calibrations as used for http://www.worldagroforestry.org/atlas-central-america. However, more sophisticated methods such as spatial folding, spatial and environmental thinning are employed to reduce sampling bias and the effects of spatial auto- correlation. For native species, presence observations from across the African continent were gathered. Here provisional results are shown, calibrated with presence observations that are available online. In a later phase, additional presence observations will be included in model calibrations and evaluations. These will be provided by experienced botanists that will also verify the distribution maps. Figure 1 was created by combining information from the www.vegetationmap4africa.org with the results of habitat distribution mapping. Where a section of the projected range of the species overlapped with its expected distribution in vegetation types, the section was given the same colouring as the vegetation map. Sections that did not match documented vegetation types were plotted in the grey33 R colour. Figure 1. Projected presence distribution of the species in Ethiopia. Administrative boundaries from www.gadm.org version 3.6. Figure 2. Administrative boundaries for Ethiopia from www.gadm.org version 3.6. Figure 3. Distribution of potential natural vegetation types in Ethiopia from www.vegetationmap4africa.org Figure 4. Projected presence distribution of the species across Africa. Administrative boundaries tmap version 2.2 (Tennekes 2018). Roeland Kindt1, Lars Graudal12, Jens-Peter B Lillesø2, Abrham Abiyu1, Soren Moestrup12, Paulo van Breugel3 1 World Agroforestry Centre, Tree Productivity and Diversity 2 University of Copenhagen, Department of Geosciences and Natural Resource Management (IGN) 3 HAS University of Applied Sciences, 's-Hertogenbosch
  • 9. Habitat distribution of Ziziphus jujuba inferred from ensemble modelling with BiodiversityR Species distribution modelling is currently underway for 150+ priority species selected by the PATSPO project, using similar methods of model calibrations as used for http://www.worldagroforestry.org/atlas-central-america. However, more sophisticated methods such as spatial folding, spatial and environmental thinning are employed to reduce sampling bias and the effects of spatial auto- correlation. For native species, presence observations from across the African continent were gathered. Here provisional results are shown, calibrated with presence observations that are available online. In a later phase, additional presence observations will be included in model calibrations and evaluations. These will be provided by experienced botanists that will also verify the distribution maps. Figure 1 was created by combining information from the www.vegetationmap4africa.org with the results of habitat distribution mapping. Where a section of the projected range of the species overlapped with its expected distribution in vegetation types, the section was given the same colouring as the vegetation map. Sections that did not match documented vegetation types were plotted in the grey33 R colour. Roeland Kindt1, Lars Graudal12, Jens-Peter B Lillesø2, Abrham Abiyu1, Soren Moestrup12 1 World Agroforestry Centre, Tree Productivity and Diversity 2 University of Copenhagen, Department of Geosciences and Natural Resource Management (IGN) Figure 1. Projected presence distribution of the species in Ethiopia. Administrative boundaries from www.gadm.org version 3.6. Figure 2. Administrative boundaries for Ethiopia from www.gadm.org version 3.6. Figure 3. Distribution of potential natural vegetation types in Ethiopia from www.vegetationmap4africa.org Figure 4. Projected presence distribution of the species across Africa. Administrative boundaries tmap version 2.2 (Tennekes 2018).