Borum Call Girls Service ☎ ️93326-06886 ❤️🔥 Enjoy 24/7 Escort Service
Abc Analysis
1. ABC Analysis
Separating the vital few from the trivial many
The Concept
Over 100 years ago, Vilfredo Pareto made the statement that “twenty percent of the population
owned 80 percent of the property in Italy.” In 1940, Joseph Juran, a mechanical engineer,
reapplied Pareto’s principle. In doing so, he created Pareto analysis or ABC analysis. Juran said
that by using this analysis you could separate the “vital few” from the “trivial many.” Managers
use this analysis today to prioritize tasks by those that are of most “worth.”
How To Use ABC Analysis: Sally’s Grocery Store
While ABC analysis can be used for many different things, we are going to look at it from an
inventory perspective. To better understand this tool, we are going to talk about Sally who owns
a grocery store. She is fairly profitable, but would like to focus on the items that create more
revenue. As you work this analysis, I will refer back to Sally’s grocery store, and how her
analysis went.
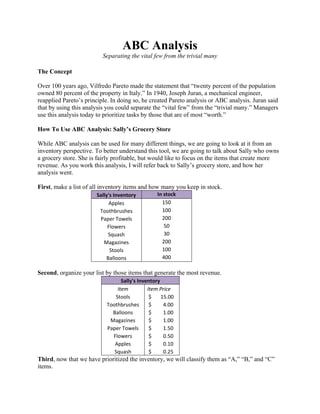
First, make a list of all inventory items and how many you keep in stock.
Sally's Inventory In stock
Apples 150
Toothbrushes 100
Paper Towels 200
Flowers 50
Squash 30
Magazines 200
Stools 100
Balloons 400
Second, organize your list by those items that generate the most revenue.
Sally's Inventory
Item Item Price
Stools $ 15.00
Toothbrushes $ 4.00
Balloons $ 1.00
Magazines $ 1.00
Paper Towels $ 1.50
Flowers $ 0.50
Apples $ 0.10
Squash $ 0.25
Third, now that we have prioritized the inventory, we will classify them as “A,” “B,” and “C”
items.
2. • To do that we will first calculate total revenue by finding the revenue of each item.
Sally's Inventory
Item Item Price Amount Item Revenue
Stools $ 15.00 100 $ 1,500.00
Toothbrushes $ 4.00 100 $ 400.00
Balloons $ 1.00 400 $ 400.00
Paper Towels $ 1.50 200 $ 300.00
Magazines $ 1.00 200 $ 200.00
Flowers $ 0.50 50 $ 25.00
Apples $ 0.10 150 $ 15.00
Squash $ 0.25 30 $ 7.50
• Then, calculate the percent for each item. In this case, you would divide the total revenue
generated by the stools by the total revenue created from all inventory items.
Sally's Inventory
%
Item Item Price Amount Item Revenue Revenue
Stools $ 15.00 100 $ 1,500.00 53%
Toothbrushes $ 4.00 100 $ 400.00 14%
Balloons $ 1.00 400 $ 400.00 14%
Paper Towels $ 1.50 200 $ 300.00 11%
Magazines $ 1.00 200 $ 200.00 7%
Flowers $ 0.50 50 $ 25.00 1%
Apples $ 0.10 150 $ 15.00 1%
Squash $ 0.25 30 $ 7.50 0%
Total Revenue $ 2,847.50
• This is where you can use a bit of discretion in deciding where to categorize items. In this
example, we are going to use the following breakdown:
Category % of Revenue
A 50‐100%
B 10‐20%
C 0‐10%
Every case will be different, so the percentages you use may need to be specific to your
case. Most ABC analyses are done using this breakdown:
3. Category % of Revenue
A 70‐100%
B 20‐70%
C 0‐20%
Sally's Inventory
Item Item Price Amount Item Revenue % Revenue
A Stools $ 15.00 100 $ 1,500.00 53%
Toothbrushes $ 4.00 100 $ 400.00 14%
B Balloons $ 1.00 400 $ 400.00 14%
Paper Towels $ 1.50 200 $ 300.00 11%
Magazines $ 1.00 200 $ 200.00 7%
Flowers $ 0.50 50 $ 25.00 1%
C
Apples $ 0.10 150 $ 15.00 1%
Squash $ 0.25 30 $ 7.50 0%
Total Revenue $ 2,847.50
As you can see, stools fall into classification “A,” toothbrushes, balloons, and paper
towels fall into classification “B,” and magazines, flowers, apples, and squash fall into
classification “C.”
Proving the Pareto principle, we can see that although you may have a small amount of a
certain item, it may create the largest amount of revenue. Sally may think that because
she has the largest number of balloons she should spend all of her time tracking and
selling balloons, but, in reality, the stools are creating the largest amount of revenue.
Sally's Inventory
Item Item Price Amount Item Revenue % Revenue % of Items
Stools $ 15.00 100 $ 1,500.00 53% 8%
Toothbrushes $ 4.00 100 $ 400.00 14% 8%
Balloons $ 1.00 400 $ 400.00 14% 33%
Paper Towels $ 1.50 200 $ 300.00 11% 16%
Magazines $ 1.00 200 $ 200.00 7% 16%
Flowers $ 0.50 50 $ 25.00 1% 4%
Apples $ 0.10 150 $ 15.00 1% 12%
Squash $ 0.25 30 $ 7.50 0% 2%
Total Revenue $ 2,847.50
Total Items 1,230
4. Fourth, now that you have categorized your inventory, you can determine the monitoring
systems and controls that are needed.
“A” class items: Need to be watched carefully. For example, at a store that I worked at,
they had security devices attached to the vacuums because they would sell for $500 or
$600. In Sally’s situation, she may want to have her employees count the stools each day.
She also may want to develop a more delicate way to store her stools so that she doesn’t
lose any to scrap.
“B” class items: While still important, these items may be counted once every quarter or
month. They will require less monitoring.
“C” class items: These items can be referred to as “free stock,” and monitoring them
may be a waste of your time (e.g. Sally counting her apples every day may not be
beneficial.)
The versatile ABC Analysis
As discussed previously, this tool allows you to prioritize tasks or items according to the greatest
return. ABC analysis can be used for just about any decision and the following are a few areas it
can be applied:
• Quality Problems
• Inventory
• Customers
• Errands
• Homework
• Friends
• Household Chores
• Shopping
• Along with many others
To get more info on ABC Analysis
• Manufacturing planning and control systems for supply chain management by Thomas E.
Vollman
• The 80/20 Principle: The Secret to Success by Achieving More with Less by Richard
Koch
• Pareto Charts: Plain & Simple (Learning and Application Guide) by Joiner Associates
• Tools of Total Quality: an introduction to statistical process control by P. Lyonnet
• Applying the 80/20 Rule to Your Business by Jeffrey J. Mayer
• The Six Sigma Basic Training Kit: Implementing Juran’s 6-Step Quality Improvement
Process and Six Sigma Tools by the Juran Institute