Also check the following for US Macro data www.bea.govUse Exe.pdf
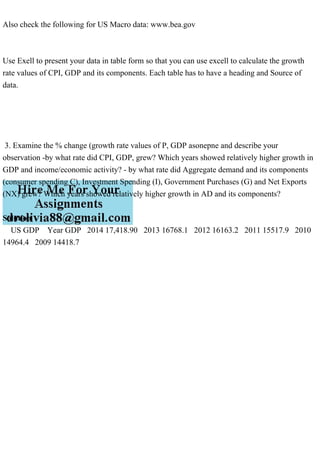
Also check the following for US Macro data: www.bea.gov Use Exell to present your data in table form so that you can use excell to calculate the growth rate values of CPI, GDP and its components. Each table has to have a heading and Source of data. 3. Examine the % change (growth rate values of P, GDP asonepne and describe your observation -by what rate did CPI, GDP, grew? Which years showed relatively higher growth in GDP and income/economic activity? - by what rate did Aggregate demand and its components (consumer spending C), Investment Spending (I), Government Purchases (G) and Net Exports (NX) grew? Which years showed relatively higher growth in AD and its components? Solution US GDP Year GDP 2014 17,418.90 2013 16768.1 2012 16163.2 2011 15517.9 2010 14964.4 2009 14418.7.
Recommended
Recommended
More Related Content
More from akashborakhede
More from akashborakhede (6)

Recently uploaded
Recently uploaded (20)
Also check the following for US Macro data www.bea.govUse Exe.pdf
- 1. Also check the following for US Macro data: www.bea.gov Use Exell to present your data in table form so that you can use excell to calculate the growth rate values of CPI, GDP and its components. Each table has to have a heading and Source of data. 3. Examine the % change (growth rate values of P, GDP asonepne and describe your observation -by what rate did CPI, GDP, grew? Which years showed relatively higher growth in GDP and income/economic activity? - by what rate did Aggregate demand and its components (consumer spending C), Investment Spending (I), Government Purchases (G) and Net Exports (NX) grew? Which years showed relatively higher growth in AD and its components? Solution US GDP Year GDP 2014 17,418.90 2013 16768.1 2012 16163.2 2011 15517.9 2010 14964.4 2009 14418.7