Women’s Employment and Earnings: Best States For Women To Work
•
0 likes•555 views

Washington, DC, Ranks Highest for Women’s Employment and Earnings; West Virginia Ranks Lowest report by The Institute for Women's Policy Research (IWPR) http://www.iwpr.org/

Recommended
Recommended
More Related Content
Similar to Women’s Employment and Earnings: Best States For Women To Work
Similar to Women’s Employment and Earnings: Best States For Women To Work (20)
Recently uploaded
Recently uploaded (20)
Women’s Employment and Earnings: Best States For Women To Work
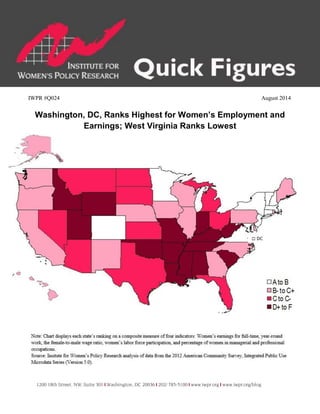
- 1. IWPR #Q024 August 2014 Washington, DC, Ranks Highest for Women’s Employment and Earnings; West Virginia Ranks Lowest
- 2. 2 State Score Rank Grade Dollars Rank Percent Rank Percent Rank Percent Rank Alabama 3.55 50 F 31,200 43 69.3% 46 53.1% 50 36.6% 42 Alaska 4.11 16 B- 40,000 10 67.8% 48 65.1% 6 41.9% 12 Arizona 3.88 30 C 36,000 22 80.0% 14 55.2% 47 37.7% 32 Arkansas 3.60 48 D- 30,000 48 75.0% 38 54.5% 49 35.8% 47 California 4.16 13 B- 41,600 7 83.2% 9 57.4% 37 39.5% 20 Colorado 4.24 10 B 40,000 10 80.0% 14 63.2% 13 42.1% 11 Connecticut 4.44 3 B+ 46,800 5 78.0% 24 63.3% 10 43.9% 5 Delaware 4.17 12 B- 41,000 8 82.0% 12 60.1% 23 39.4% 22 District of Columbia 5.47 1 A 60,000 1 92.3% 1 66.9% 1 60.8% 1 Florida 3.87 31 C 34,000 30 85.0% 5 55.4% 46 36.6% 42 Georgia 3.95 26 C+ 35,000 25 81.4% 13 57.3% 38 39.5% 20 Hawaii 4.10 17 B- 39,000 17 86.7% 2 59.6% 25 36.8% 39 Idaho 3.69 45 D 30,500 47 73.5% 44 58.2% 32 37.0% 36 Illinois 4.14 15 B- 40,000 10 80.0% 14 61.4% 20 39.2% 25 Indiana 3.71 43 D 33,000 37 73.3% 45 59.4% 26 34.7% 48 Iowa 3.97 23 C+ 35,000 25 77.8% 26 63.2% 13 38.0% 30 Kansas 3.89 29 C 33,100 35 73.6% 43 61.5% 19 40.1% 16 Kentucky 3.72 42 D 32,000 38 76.2% 34 55.6% 45 37.0% 36 Louisiana 3.60 48 D- 31,200 43 66.4% 50 57.2% 39 37.2% 35 Maine 4.03 20 C+ 35,200 24 83.8% 7 59.4% 26 39.6% 19 Maryland 4.40 5 B+ 48,000 2 82.8% 11 65.2% 5 47.2% 2 Massachusetts 4.53 2 B+ 47,000 4 78.3% 22 63.3% 10 46.7% 3 Michigan 3.81 36 C- 36,200 21 73.7% 42 57.1% 40 36.4% 45 Minnesota 4.30 7 B 40,000 10 80.0% 14 66.4% 2 42.5% 10 Mississippi 3.62 46 D- 30,000 48 75.0% 38 54.8% 48 36.3% 46 Missouri 3.78 38 D+ 32,000 38 74.4% 41 59.4% 26 38.0% 30 Montana 3.83 34 C- 31,000 45 77.5% 29 59.8% 24 39.2% 25 Nebraska 4.04 19 C+ 34,000 30 79.1% 21 65.8% 3 39.4% 22 Nevada 3.81 36 C- 35,000 25 83.3% 8 60.3% 22 30.6% 51 New Hampshire 4.28 9 B 41,000 8 77.4% 31 64.0% 8 43.4% 7 New Jersey 4.43 4 B+ 48,000 2 80.0% 14 60.8% 21 42.7% 8 New Mexico 3.97 23 C+ 34,000 30 85.0% 5 56.2% 43 40.2% 15 New York 4.34 6 B 43,000 6 86.0% 4 59.1% 29 42.6% 9 North Carolina 3.98 22 C+ 34,000 30 82.9% 10 58.1% 34 40.3% 14 North Dakota 3.87 31 C 34,000 30 75.6% 36 63.6% 9 35.7% 48 Ohio 3.86 33 C 35,000 25 76.9% 32 58.9% 31 37.0% 36 Oklahoma 3.71 43 D 31,000 45 77.5% 29 56.3% 42 36.8% 39 Oregon 3.95 26 C+ 36,500 20 77.7% 28 57.9% 35 39.3% 24 Pennsylvania 3.97 23 C+ 37,100 18 75.7% 35 58.2% 32 40.1% 16 Rhode Island 4.16 13 B- 40,000 10 80.0% 14 62.1% 16 39.9% 18 South Carolina 3.78 38 D+ 32,000 38 80.0% 14 56.7% 41 36.8% 39 South Dakota 3.83 34 C- 30,000 48 75.0% 38 65.5% 4 37.6% 34 Tennessee 3.78 38 D+ 32,000 38 78.0% 24 56.1% 44 38.2% 29 Texas 3.90 28 C 35,000 25 77.8% 26 57.9% 35 38.7% 27 Utah 3.77 41 D+ 33,100 35 69.0% 47 61.6% 17 37.7% 32 Vermont 4.30 7 B 37,100 18 86.3% 3 64.5% 7 43.7% 6 Virginia 4.23 11 B 40,000 10 76.9% 32 61.6% 17 44.4% 4 Washington 4.07 18 C+ 40,000 10 75.5% 37 59.0% 30 40.5% 13 West Virginia 3.43 51 F 30,000 48 66.7% 49 49.6% 51 36.5% 44 Wisconsin 4.02 21 C+ 36,000 22 78.3% 22 63.3% 10 38.6% 28 Wyoming 3.62 46 D- 32,000 38 64.0% 51 63.0% 15 34.3% 50 United States 4.00 37,000 78.6% 58.8% 39.6% Notes : For women aged 16 and older. Median annual earnings and the earnings ratio are for ful l -time, year-round workers . Source: IWPR analys i s of data from the 2012 American Communi ty Survey, Integrated Publ ic Use Microdata Series (Vers ion 5.0). Table 1. How the States Measure Up: Women's Status on the Employment and Earnings Composite and Its Components Median Annual Earnings Full-Time, Year-Round for Employed Women Earnings Ratio between Full- Time, Year-Round Employed Women and Men Percent of Women in the Labor Force Percent of Employed Women, Managerial or Professional Occupations Composite Index
- 3. 3 States across the nation vary considerably in their progress toward women’s employment and earnings equity. On the Institute for Women’s Policy Research 2014 composite index on employment and earnings—which includes four key indicators of women’s status in the workforce—the District of Columbia ranks first in the nation and West Virginia ranks last. Most of the top eleven states that received a grade of B or higher—including Washington, DC, which ranks first on each indicator as well as on the composite index—are in the Northeast, with the exception of Minnesota (which ranks 8th), Colorado (which ranks 10th), and Virginia (which ranks 11th). More than half of the fourteen states receiving the lowest grades are in the South: Alabama, Arkansas, Kentucky, Louisiana, Mississippi, Oklahoma, South Carolina, Tennessee, and West Virginia all received a grade of D+ or lower. They are joined by Idaho, Indiana, Missouri, Utah, and Wyoming. Two states—Alaska and California—have dropped out of the top eleven since 2006 when the composite index was last calculated (Alaska now ranks 16th and California is tied with Rhode Island for 13th). They were replaced in this group by New York (previously 15th) and New Hampshire (previously 12th). Two states—New Mexico and Montana—have dropped out of the bottom group of 14 and were replaced by South Carolina (previously 36th) and Missouri (previously 19th). The state with the greatest improvement in its ranking is New Mexico (which moved up 21 places from 44 to 23), and the state with the greatest decline is Missouri (which moved down 19 places from 19 to 38). Arizona and Georgia also showed significant declines, dropping 13 places each, while North Carolina and Pennsylvania both improved 11 places. IWPR will release a new comprehensive report on The Status of Women in the States in 2015. To construct the employment and earnings composite index, each of the four component indicators was first standardized. For each of the four indicators, the observed value for the state was divided by the comparable value for the entire United States. The resulting values were summed for each state to create a composite score. Each of the four component indicators has equal weight in the composite. The states were ranked from the highest to the lowest score. To grade the states on this composite index, values for each of the components were set at desired levels to produce an “ideal score.” Women’s earnings were set at the median annual earnings for men in the United States as a whole; the wage ratio was set at 100 percent, as if women earned as much as men; women’s labor force participation was set at the national number for men; and women in managerial and professional occupations was set at the highest score for all states. Each state’s score was then compared with the ideal score to determine the state’s grade. For more information on IWPR reports or membership, please call (202) 785-5100, email iwpr@iwpr.org, or visit www.iwpr.org. The Institute for Women's Policy Research (IWPR) conducts rigorous research and disseminates its findings to address the needs of women, promote public dialogue, and strengthen families, communities, and societies. The Institute works with policymakers, scholars, and public interest groups to design, execute, and disseminate research that illuminates economic and social policy issues affecting women and their families, and to build a network of individuals and organizations that conduct and use women-oriented policy research. IWPR's work is supported by foundation grants, government grants and contracts, donations from individuals, and contributions from organizations and corporations. IWPR is a 501 (c) (3) tax- exempt organization that also works in affiliation with the women's studies and public policy and public administration programs at The George Washington University.