Soumettre la recherche
Mettre en ligne
Fifth Elephant 2014 talk - Crafting Visual Stories with Data
•
162 j'aime
•
9,835 vues
Amit Kapoor
Suivre
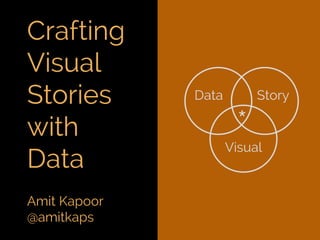
Talk at Fifth Elephant 2014 on the principles behind crafting visual stories with data.
Lire moins
Lire la suite
Données & analyses
Signaler
Partager
Signaler
Partager
1 sur 76
Télécharger maintenant
Télécharger pour lire hors ligne
Recommandé
Data visualization has enabled us to compress data and express them visually in many interesting new ways. It is often cited that we are trying to tell stories through them. Is that really the case? How can we ensure that the audience is able to retain, recall and retell our data-driven stories. Using examples and videos learning from different storytelling mediums, I walk through why stories are important and what we can learn about how stories work from these mediums. I then detail out a framework built on the See the data | Show the Visual | Tell the Story | Engage the Audience paradigm to convert the data in to a data-visual-story. This slide deck was used in Bangalore Meetup - Crafting Visual Stories with Data - in March 2014 @ InMobi's Bangalore Office.
Crafting Visual Stories with Data
Amit Kapoor
This research explored the visual framing of climate control in The New York Times through three cycles of media history. Although no peer-reviewed study has explored this specific topic, a wealth of prior communication articles on both the visual and textual aspects of climate change and geoengineering in the media was mined in order to discover the frames present. Once the visual frames of climate control (war, fix, people, and impacts) were revealed a content analysis was conducted in order to see which frame elements were most and least frequent considering the images of climate control. When combining all three cycles the frame with the highest overall mean was the fix frame (M=1.7517, SD=1.34128) indicating that it is the most occurring climate control frame per image. The frame with the lowest overall mean was the war frame (M=.5137, SD=1.02544). Frame frequency from cycle to cycle was relatively constant since only the impacts frame had a significant mean difference between cycle one and cycle two (M= .72453, p= .042). This initial analysis did not provide support for Downs issue-attention cycle theory. Although when the frame element frequencies were graphed three spikes were separated by three valleys considering climate control imagery in The New York Times through iv about one and half centuries. This information can go towards making correlations with: events, exposure to certain stimuli, and judging effectiveness of communication strategies over time. The discussion considered whether currently the war and fix frames could be too small in order to produce effective communication with a distrustful public. Also the recent people frame increase correlates with non-acceptance regarding climate change considering Republicans.
The Visual Framing of the Three Cycles of Climate Control in The New York Tim...
Jason Lee Thompson
The task of “data profiling”—assessing the overall content and quality of a data set—is a core aspect of the analytic experience. Traditionally, profiling was a fairly cut-and-dried task: load the raw numbers into a stat package, run some basic descriptive statistics, and report the output in a summary file or perhaps a simple data visualization. However, data volumes can be so large today that traditional tools and methods for computing descriptive statistics become intractable; even with scalable infrastructure like Hadoop, aggressive optimization and statistical approximation techniques must be used. In this talk Sean will cover technical challenges in keeping data profiling agile in the Big Data era. He will discuss both research results and real-world best practices used by analysts in the field, including methods for sampling, summarizing and sketching data, and the pros and cons of using these various approaches. Sean is Trifacta’s Chief Technical Officer. He completed his Ph.D. at Stanford University, where his research focused on user interfaces for database systems. At Stanford, Sean led development of new tools for data transformation and discovery, such as Data Wrangler. He previously worked as a data analyst at Citadel Investment Group.
Sean Kandel - Data profiling: Assessing the overall content and quality of a ...
huguk
Presentation by Peter Fontaine, CBO's Assistant Director for Budget Analysis, to a Global Network of Parliamentary Budget Offices Community Meeting Sponsored by the World Bank Institute
Telling Visual Stories About Data
Congressional Budget Office
Seduced by the allure of big data and analytics, many companies are overlooking the true power of integrating deep human understanding to drive transformational action. This short presentation shows how companies that combine leading edge analytics with deep customer understanding will be able to unlock significant competitive advantage.
Can big data find the next big thing?
Clear
Vendor-neutral presentation about the common functionality provided by data profiling tools, which can help automate some of the work needed to begin your preliminary data analysis.
Adventures in Data Profiling
Jim Harris
An analysis of the changing cost competitiveness of the world’s top 25 export economies.
The Shifting Economics of Global Manufacturing
Boston Consulting Group
data profiling
Data profiling-best-practices
Blaise Cheuteu
Data profiling comprises a broad range of methods to efficiently analyze a given data set. In a typical scenario, which mirrors the capabilities of commercial data profiling tools, tables of a relational database are scanned to derive metadata, such as data types and value patterns, completeness and uniqueness of columns, keys and foreign keys, and occasionally functional dependencies and association rules. Individual research projects have proposed several additional profiling tasks, such as the discovery of inclusion dependencies or conditional functional dependencies. Data profiling deserves a fresh look for two reasons: First, the area itself is neither established nor defined in any principled way, despite significant research activity on individual parts in the past. Second, current data profiling techniques hardly scale beyond what can only be called small data. Finally, more and more data beyond the traditional relational databases are being created and beg to be profiled. The talk proposes new research directions and challenges, including interactive and incremental profiling and profiling heterogeneous and non-relational data. Speaker: Felix Naumann studied mathematics, economy, and computer sciences at the University of Technology in Berlin. After receiving his diploma (MA) in 1997 he joined the graduate school "Distributed Information Systems" at Humboldt University of Berlin. He completed his PhD thesis on "Quality-driven Query Answering" in 2000. In 2001 and 2002 he worked at the IBM Almaden Research Center on topics around data integration. From 2003 - 2006 he was assistant professor for information integration at the Humboldt-University of Berlin. Since then he holds the chair for information systems at the Hasso Plattner Institute at the University of Potsdam in Germany.
Big Data Profiling
Big Data Profiling
eXascale Infolab
BCG's 2015 analysis of the changing cost competitiveness of the world’s top 25 export economies.
The Shifting Economics of Global Manufacturing
Boston Consulting Group
You are a designer, or a coder, or a manager. Maybe you are even a unicorn. But you are not a data scientist. Still, you want to get more out of the mountain of data you have about your site or app to create a better user experience. No problem. Learn a process of data thinking that will help you to analyze, visualize, and really use data about your website or app without all the bothersome math and python programming.
Be Data Informed Without Being a Data Scientist
Pamela Pavliscak
Finance for non financial managers ppt by paramesh a
Alisetti Paramesh. ACMA,CGMA
I thought using infographics would be a great way for me to add something different to my blog, but I didn't know how to get started. I saw a post about using PowerPoint and gave it a shot. It took less than 30 minutes.
How I Created Easy Infographics Using MS PowerPoint
Kimberly Gauthier
Infographics shapes and flat style flowchart diagrams. Ideas how to change text slides into strongly visual and simple infographics slide. Get inspired by those examples of company history timelines, flow arrows steps illustrated by icons.
Infographics Shapes TimeLines PPT Flow Diagrams - infodiagram part2
Peter Zvirinsky
People consume information on the web differently than traditional media. In an era of information overload we’ve become “grazers” of content, skimming digital channels for nuggets of information. More than ever, it’s important for individuals and organizations to be able to present ideas in a manner that can be quickly consumed, understood and remembered. The Power of Infographics is a presentation that digs into visual thinking, how organizations can learn to present their ideas visually and how infographics can be used to help achieve some common business objectives.
The Power of Infographics
Mark Smiciklas
Infographics shapes and diagrams - graphical inspirations if you want to present a text bullet point slide in an attractive visual way. Examples of infographics diagrams shapes for linear lists, e.g. presentation agenda or table of content, shapes for ordered lists (numbered items) and central item with subitems (by puzzle pieces, circles, pentagram). Diagrams are in modern UI flat graphical style, editable in PowerPoint.
Infographics Text Lists Powerpoint diagrams
Peter Zvirinsky
What is Infographics? There are lot of phrase around the term Information graphics like "Infographics." "Data visualization." "Information design. & “Communication Design" We're talking about any graphic that displays and explains information, whether that be data or words. When we use the term "data visualization," we're using it as a general term used to describe data presented in a visual way. Why Infographics? Infographics are important because they change the way people find and experience stories especially now, when more and more infographics are being used to augment editorial content on the web. Infographics create a new way of seeing the world of data, and they help communicate complex ideas in a clear and beautiful way.
Its all about Infographics
Aditya Krishna
Infographics of key data values and KPIs - inspirative of creative slide design templates. Flat style diagrams and geometric shapes. Inspiration how to present a text formal data in an unique visual way. Graphics is in modern metro UI graphical style, easily redoable and editable in PowerPoint.
Infographics Key Data KPI presentation slides
Peter Zvirinsky
Marketing Analysis of Nestle
BCG Matrix of Nestle
Mutahir Bilal
Business intelligence Data Quality and Data profiling
Data quality and data profiling
Shailja Khurana
My personal usage of Python Visualisation Libraries for Data Science
Python Visualisation for Data Science
Amit Kapoor
How to take your first steps in doing text generation with Deep Learning using an example case.
Deep Learning for NLP
Amit Kapoor
Creating better models is a critical component to building a good data science product. It is relatively easy to build a first-cut machine-learning model, but what does it take to build a reasonably good or state-of-the-art model? Ensemble models—which help exploit the power of computing in searching the solution space. Ensemble methods aren’t new. They form the basis for some extremely powerful machine learning algorithms like random forests and gradient boosting machines. The key point about ensemble is that consensus from diverse models are more reliable than a single source. Amit and Bargava discusses various strategies to build ensemble models, demonstrating how to combine model outputs from various base models (logistic regression, support vector machines, decision trees, etc.) to create a stronger, better model output. Using an example they covers bagging, boosting, voting and stacking to explore where ensemble models can consistently produce better results when compared against the best-performing single models.
The Power of Ensembles in Machine Learning
Amit Kapoor
Data science is a process of abstraction. In order to explain or to predict a real phenomena, the process starts with acquiring and refining the data. It then moves between the three layers of abstraction: transformations (data abstraction), visualizations (visual abstraction), and modeling (symbolic abstraction). All three layers of abstraction together build a truer (or closer) representation of the real phenomena. Data visualization (data-vis) helps us to understand the portrait and the shape of the data. The science of data-vis for exploratory data analysis is well developed for both static graphics (scatter-plot matrices, glyph-based approaches, geometric transforms like parallel coordinates) and interactive graphics (layering, brushing and linking, projections and tours). (For more information, see Amit Kapoor’s Strata + Hadoop World Singapore talk, Visualizing Multidimensional Data.) Though visualization is used in data science to understand the shape of the data, it’s not widely used for statistical models, which are evaluated based on numerical summaries. Amit Kapoor demonstrates extending visualization to the statistical model (model-vis), which aids in understanding the shape of the model, the impact of parameters and input data on the model, the fit of the model, and where it can be improved. Model visualization can help us to understand the shape of the model and compare it to the shape of the data. It allows us to see the fit of the model and understand where the fit can be improved. It also allows us to better understand the parameters in the model and how the model changes when the parameters change as well as how the parameters changes when the input data changes. The science and tools for model-vis are still very underdeveloped. Amit looks at practical examples of doing model-vis in regression (linear, lasso), classification (logistic, trees, LDA), and clustering (hierarchical) problems that can help us better understand the model. This includes exploring model-vis approaches that: Visualize the model in data space as opposed to data in model space - Visualize the entire space of models - Visualize the same model with varying tuning parameters - Visualize the same model with different input datasets - Visualize the process of model fitting as opposed to final result Integrating these approaches for model-vis as a part of model evaluation strengthens a data scientist’s understanding of the model and leads to better model building, complementing data-vis for fitting better models as well as communicating the insight from the data science process.
Model Visualisation
Model Visualisation
Amit Kapoor
The ever increasing computational capacity has enabled us to acquire, process and analyze larger data-sets and information. However, the human memory and attention required to use this data is more limited and has remained relatively constant. Data visualization can enable us to compress data and encode it visually in ways that allows us to aid perceptual and cognitive understanding. However, data visualisation alone is not enough and often we need to try to tell stories through data. Storytelling with data can enable us to move from analysis to synthesis, from numbers to visuals, and from an argument to a story. Operating at this intersection of data, visual and story can help persuade not only through logos (logic) but also through pathos (empathy) and ethos (credibility). In trying to tell compelling data stories, we can empower our selves to engage, communicate and persuade a large and diverse audience. In this talk, I discuss ‘why’ stories work and what we can learn about the art of storytelling from other mediums like oral storytelling, written stories, pictures, comics and movies. I will summarise basic principles that can help us in our crafting journey, as we take the data through the layers of abstraction. The focus would be on unpacking the seven dimensions of creating an engaging data story - Abstraction (data patterns), Representation (visual encoding), Framing & Transition (perspective, focus), Messaging (verbal, text annotation), Flow (arrangement) and Interactivity. Further, creating data stories is a cross disciplinary activity that requires us to operate at the intersection of a visual designer, data scientist and storyteller. It is both a science and an art. So how does one realistically learn these multitude of skills needed to get good at it. I will also discuss ideas about the possible path that practitioners could adopt to learn this craft through sustained practice. ## About the Speaker Amit Kapoor is interested in learning and teaching the craft of telling visual stories with data. He uses storytelling and data visualization as tools for improving communication, persuasion and leadership. He conducts workshops and trainings for corporates, non-profits, colleges, and individuals at narrativeVIZ Consulting. He also teaches storytelling with data as invited guest faculty in academia, both in management context at IIM Bangalore and IIM Ahmedabad and in design context at NID, Bangalore. His background is in strategy consulting in using data-driven stories to drive change across organizations and businesses. He has 15 years of management consulting experience, first with AT Kearney in India, then with Booz & Company in Europe and more recently with startups in Bangalore. He did his B.Tech in Mechanical Engineering from IIT, Delhi and PGDM (MBA) from IIM, Ahmedabad. You can find more about him at amitkaps.com and tweet him at @amitkaps
Storytelling with Data - Approach | Skills
Amit Kapoor
Visualising is essential for data science process because it allows as to look at the portrait of our data and develop new hypotheses about our problem. However, visualisation does not scale very well as we are limited by the number of pixels in the our screen (at least for static graphics). This deck talks about the approach - Bin - Summarize - Smooth approach to visualise big data which has been developed by Hadley Wickham and then implemented in an R package in Bigvis.
Visualising Big Data
Amit Kapoor
Data visualisation is a cross disciplinary activity that requires us to operate at the intersection of a visual designer, data scientist and storyteller. It is both a science and an art. So how does one realistically learn these multitude of skills needed to get good at the craft of data visualisation. In this slide deck, I discuss ideas about the possible path that a beginner could adopt to learn this craft through sustained practice.
Learning the Craft of Data Visualisation
Amit Kapoor
Even though exploring data visually is an integral part of the data analytic pipeline, we struggle to visually explore data once the number of dimensions go beyond three. This talk will focus on showcasing techniques to visually explore multi dimensional data p 3. The aim would be show examples of each of following techniques, potentially using one exemplar dataset. This talk was given at the Strata + Hadoop World Conference @ Singapore 2015 and at Fifth Elephant conference @ Bangalore, 2015
Visualising Multi Dimensional Data
Amit Kapoor
A guide to help you navigate the tool landscape for learning and making data visualisation.
Tools & Resources for Data Visualisation
Amit Kapoor
Stories have been recognized for their power of communication & persuasion for centuries and we need to operate at that intersection of data, visual and stories to fully harness the power of data. I take your through a short tour of the science and the art of visualization and storytelling. Then give you an introduction through examples and exemplar on the four different layers in a data-story: See - Show - Tell - Engage. Used in the session on Business Analytics and Intelligence at IIM Bangalore in July 2014.
Storytelling with Data - See | Show | Tell | Engage
Amit Kapoor
Contenu connexe
En vedette
Data profiling comprises a broad range of methods to efficiently analyze a given data set. In a typical scenario, which mirrors the capabilities of commercial data profiling tools, tables of a relational database are scanned to derive metadata, such as data types and value patterns, completeness and uniqueness of columns, keys and foreign keys, and occasionally functional dependencies and association rules. Individual research projects have proposed several additional profiling tasks, such as the discovery of inclusion dependencies or conditional functional dependencies. Data profiling deserves a fresh look for two reasons: First, the area itself is neither established nor defined in any principled way, despite significant research activity on individual parts in the past. Second, current data profiling techniques hardly scale beyond what can only be called small data. Finally, more and more data beyond the traditional relational databases are being created and beg to be profiled. The talk proposes new research directions and challenges, including interactive and incremental profiling and profiling heterogeneous and non-relational data. Speaker: Felix Naumann studied mathematics, economy, and computer sciences at the University of Technology in Berlin. After receiving his diploma (MA) in 1997 he joined the graduate school "Distributed Information Systems" at Humboldt University of Berlin. He completed his PhD thesis on "Quality-driven Query Answering" in 2000. In 2001 and 2002 he worked at the IBM Almaden Research Center on topics around data integration. From 2003 - 2006 he was assistant professor for information integration at the Humboldt-University of Berlin. Since then he holds the chair for information systems at the Hasso Plattner Institute at the University of Potsdam in Germany.
Big Data Profiling
Big Data Profiling
eXascale Infolab
BCG's 2015 analysis of the changing cost competitiveness of the world’s top 25 export economies.
The Shifting Economics of Global Manufacturing
Boston Consulting Group
You are a designer, or a coder, or a manager. Maybe you are even a unicorn. But you are not a data scientist. Still, you want to get more out of the mountain of data you have about your site or app to create a better user experience. No problem. Learn a process of data thinking that will help you to analyze, visualize, and really use data about your website or app without all the bothersome math and python programming.
Be Data Informed Without Being a Data Scientist
Pamela Pavliscak
Finance for non financial managers ppt by paramesh a
Alisetti Paramesh. ACMA,CGMA
I thought using infographics would be a great way for me to add something different to my blog, but I didn't know how to get started. I saw a post about using PowerPoint and gave it a shot. It took less than 30 minutes.
How I Created Easy Infographics Using MS PowerPoint
Kimberly Gauthier
Infographics shapes and flat style flowchart diagrams. Ideas how to change text slides into strongly visual and simple infographics slide. Get inspired by those examples of company history timelines, flow arrows steps illustrated by icons.
Infographics Shapes TimeLines PPT Flow Diagrams - infodiagram part2
Peter Zvirinsky
People consume information on the web differently than traditional media. In an era of information overload we’ve become “grazers” of content, skimming digital channels for nuggets of information. More than ever, it’s important for individuals and organizations to be able to present ideas in a manner that can be quickly consumed, understood and remembered. The Power of Infographics is a presentation that digs into visual thinking, how organizations can learn to present their ideas visually and how infographics can be used to help achieve some common business objectives.
The Power of Infographics
Mark Smiciklas
Infographics shapes and diagrams - graphical inspirations if you want to present a text bullet point slide in an attractive visual way. Examples of infographics diagrams shapes for linear lists, e.g. presentation agenda or table of content, shapes for ordered lists (numbered items) and central item with subitems (by puzzle pieces, circles, pentagram). Diagrams are in modern UI flat graphical style, editable in PowerPoint.
Infographics Text Lists Powerpoint diagrams
Peter Zvirinsky
What is Infographics? There are lot of phrase around the term Information graphics like "Infographics." "Data visualization." "Information design. & “Communication Design" We're talking about any graphic that displays and explains information, whether that be data or words. When we use the term "data visualization," we're using it as a general term used to describe data presented in a visual way. Why Infographics? Infographics are important because they change the way people find and experience stories especially now, when more and more infographics are being used to augment editorial content on the web. Infographics create a new way of seeing the world of data, and they help communicate complex ideas in a clear and beautiful way.
Its all about Infographics
Aditya Krishna
Infographics of key data values and KPIs - inspirative of creative slide design templates. Flat style diagrams and geometric shapes. Inspiration how to present a text formal data in an unique visual way. Graphics is in modern metro UI graphical style, easily redoable and editable in PowerPoint.
Infographics Key Data KPI presentation slides
Peter Zvirinsky
Marketing Analysis of Nestle
BCG Matrix of Nestle
Mutahir Bilal
Business intelligence Data Quality and Data profiling
Data quality and data profiling
Shailja Khurana
En vedette
(12)
Big Data Profiling
Big Data Profiling
The Shifting Economics of Global Manufacturing
Be Data Informed Without Being a Data Scientist
Finance for non financial managers ppt by paramesh a
How I Created Easy Infographics Using MS PowerPoint
Infographics Shapes TimeLines PPT Flow Diagrams - infodiagram part2
The Power of Infographics
Infographics Text Lists Powerpoint diagrams
Its all about Infographics
Infographics Key Data KPI presentation slides
BCG Matrix of Nestle
Data quality and data profiling
Plus de Amit Kapoor
My personal usage of Python Visualisation Libraries for Data Science
Python Visualisation for Data Science
Amit Kapoor
How to take your first steps in doing text generation with Deep Learning using an example case.
Deep Learning for NLP
Amit Kapoor
Creating better models is a critical component to building a good data science product. It is relatively easy to build a first-cut machine-learning model, but what does it take to build a reasonably good or state-of-the-art model? Ensemble models—which help exploit the power of computing in searching the solution space. Ensemble methods aren’t new. They form the basis for some extremely powerful machine learning algorithms like random forests and gradient boosting machines. The key point about ensemble is that consensus from diverse models are more reliable than a single source. Amit and Bargava discusses various strategies to build ensemble models, demonstrating how to combine model outputs from various base models (logistic regression, support vector machines, decision trees, etc.) to create a stronger, better model output. Using an example they covers bagging, boosting, voting and stacking to explore where ensemble models can consistently produce better results when compared against the best-performing single models.
The Power of Ensembles in Machine Learning
Amit Kapoor
Data science is a process of abstraction. In order to explain or to predict a real phenomena, the process starts with acquiring and refining the data. It then moves between the three layers of abstraction: transformations (data abstraction), visualizations (visual abstraction), and modeling (symbolic abstraction). All three layers of abstraction together build a truer (or closer) representation of the real phenomena. Data visualization (data-vis) helps us to understand the portrait and the shape of the data. The science of data-vis for exploratory data analysis is well developed for both static graphics (scatter-plot matrices, glyph-based approaches, geometric transforms like parallel coordinates) and interactive graphics (layering, brushing and linking, projections and tours). (For more information, see Amit Kapoor’s Strata + Hadoop World Singapore talk, Visualizing Multidimensional Data.) Though visualization is used in data science to understand the shape of the data, it’s not widely used for statistical models, which are evaluated based on numerical summaries. Amit Kapoor demonstrates extending visualization to the statistical model (model-vis), which aids in understanding the shape of the model, the impact of parameters and input data on the model, the fit of the model, and where it can be improved. Model visualization can help us to understand the shape of the model and compare it to the shape of the data. It allows us to see the fit of the model and understand where the fit can be improved. It also allows us to better understand the parameters in the model and how the model changes when the parameters change as well as how the parameters changes when the input data changes. The science and tools for model-vis are still very underdeveloped. Amit looks at practical examples of doing model-vis in regression (linear, lasso), classification (logistic, trees, LDA), and clustering (hierarchical) problems that can help us better understand the model. This includes exploring model-vis approaches that: Visualize the model in data space as opposed to data in model space - Visualize the entire space of models - Visualize the same model with varying tuning parameters - Visualize the same model with different input datasets - Visualize the process of model fitting as opposed to final result Integrating these approaches for model-vis as a part of model evaluation strengthens a data scientist’s understanding of the model and leads to better model building, complementing data-vis for fitting better models as well as communicating the insight from the data science process.
Model Visualisation
Model Visualisation
Amit Kapoor
The ever increasing computational capacity has enabled us to acquire, process and analyze larger data-sets and information. However, the human memory and attention required to use this data is more limited and has remained relatively constant. Data visualization can enable us to compress data and encode it visually in ways that allows us to aid perceptual and cognitive understanding. However, data visualisation alone is not enough and often we need to try to tell stories through data. Storytelling with data can enable us to move from analysis to synthesis, from numbers to visuals, and from an argument to a story. Operating at this intersection of data, visual and story can help persuade not only through logos (logic) but also through pathos (empathy) and ethos (credibility). In trying to tell compelling data stories, we can empower our selves to engage, communicate and persuade a large and diverse audience. In this talk, I discuss ‘why’ stories work and what we can learn about the art of storytelling from other mediums like oral storytelling, written stories, pictures, comics and movies. I will summarise basic principles that can help us in our crafting journey, as we take the data through the layers of abstraction. The focus would be on unpacking the seven dimensions of creating an engaging data story - Abstraction (data patterns), Representation (visual encoding), Framing & Transition (perspective, focus), Messaging (verbal, text annotation), Flow (arrangement) and Interactivity. Further, creating data stories is a cross disciplinary activity that requires us to operate at the intersection of a visual designer, data scientist and storyteller. It is both a science and an art. So how does one realistically learn these multitude of skills needed to get good at it. I will also discuss ideas about the possible path that practitioners could adopt to learn this craft through sustained practice. ## About the Speaker Amit Kapoor is interested in learning and teaching the craft of telling visual stories with data. He uses storytelling and data visualization as tools for improving communication, persuasion and leadership. He conducts workshops and trainings for corporates, non-profits, colleges, and individuals at narrativeVIZ Consulting. He also teaches storytelling with data as invited guest faculty in academia, both in management context at IIM Bangalore and IIM Ahmedabad and in design context at NID, Bangalore. His background is in strategy consulting in using data-driven stories to drive change across organizations and businesses. He has 15 years of management consulting experience, first with AT Kearney in India, then with Booz & Company in Europe and more recently with startups in Bangalore. He did his B.Tech in Mechanical Engineering from IIT, Delhi and PGDM (MBA) from IIM, Ahmedabad. You can find more about him at amitkaps.com and tweet him at @amitkaps
Storytelling with Data - Approach | Skills
Amit Kapoor
Visualising is essential for data science process because it allows as to look at the portrait of our data and develop new hypotheses about our problem. However, visualisation does not scale very well as we are limited by the number of pixels in the our screen (at least for static graphics). This deck talks about the approach - Bin - Summarize - Smooth approach to visualise big data which has been developed by Hadley Wickham and then implemented in an R package in Bigvis.
Visualising Big Data
Amit Kapoor
Data visualisation is a cross disciplinary activity that requires us to operate at the intersection of a visual designer, data scientist and storyteller. It is both a science and an art. So how does one realistically learn these multitude of skills needed to get good at the craft of data visualisation. In this slide deck, I discuss ideas about the possible path that a beginner could adopt to learn this craft through sustained practice.
Learning the Craft of Data Visualisation
Amit Kapoor
Even though exploring data visually is an integral part of the data analytic pipeline, we struggle to visually explore data once the number of dimensions go beyond three. This talk will focus on showcasing techniques to visually explore multi dimensional data p 3. The aim would be show examples of each of following techniques, potentially using one exemplar dataset. This talk was given at the Strata + Hadoop World Conference @ Singapore 2015 and at Fifth Elephant conference @ Bangalore, 2015
Visualising Multi Dimensional Data
Amit Kapoor
A guide to help you navigate the tool landscape for learning and making data visualisation.
Tools & Resources for Data Visualisation
Amit Kapoor
Stories have been recognized for their power of communication & persuasion for centuries and we need to operate at that intersection of data, visual and stories to fully harness the power of data. I take your through a short tour of the science and the art of visualization and storytelling. Then give you an introduction through examples and exemplar on the four different layers in a data-story: See - Show - Tell - Engage. Used in the session on Business Analytics and Intelligence at IIM Bangalore in July 2014.
Storytelling with Data - See | Show | Tell | Engage
Amit Kapoor
A short session I conducted at IIM Bangalore on sharing my experience on the what, how and why of business process improvement in strategy and supply chain. Credit for the concepts (and charts) go to my time spent at Booz & Company in Europe doing most of this work.
Business Process Improvement - A Strategic and Supply Chain Perspective
Amit Kapoor
Stories have been recognized for their power of communication & persuasion for centuries and we need to operate at that intersection of data, visual and stories to fully harness the power of data. Online journalism has already started to show the path but we need to develop the science of data-story to get them widely adopted in business. We used a case study based approach to map the four different layers in a data-story: See - Show - Tell - Engage. We developed a framework of key dimensions within each of these layers and then rigorously analyzed 25 carefully selected case-studies to see which elements were being employed in the data-story. We focused not only on the dimensions of data abstraction and visual representation, framing and transition but also on the dimensions of story structure, point-of-view, relatability and engagement through emotions, takeaways and interaction. Our framework indicates generic strategies that can be used for effective data-stories using exploratory and explanatory visualization in personal and presentation context.
What makes a data-story work?
Amit Kapoor
What is Strategy? Strategy is a very young concept. Lets explore a little more about strategy and then go down the journey of understanding how to think like a strategist.
What is Strategy - Thinking like a Strategist
Amit Kapoor
We explore the use of Story Spine approach to bring together the traditional power of oral storytelling with the emerging strength of data visualisations
Telling Stories with Data - Using Story Spine
Amit Kapoor
A session on structuring your own story and using storytelling in modern corporate settings. @Azim Premji University Sept 2012
Story Structure and Modern Storytelling
Amit Kapoor
Presentation on the business challenges of using Big Data in Retail with a bit of storytelling on why this is not new! @The Fifth Elephant conference in Bangalore on 28 July 2012 See the notes for more talking points.
Targeting the Moment of Truth - Using Big Data in Retail
Amit Kapoor
Storytelling - Gutenberg
Amit Kapoor
This was a talk I gave in IIM Bangalore in March 2012 to Business Analytics professionals on the analytics of consulting. It covers the hypothesis driven approach to problem solving that is the core of solving problems and walks through the entire lifecycle of a management consulting assignment.
Analytics in Consulting
Amit Kapoor
A perspective talk on Retail Pricing I have given at Indian Institute of Management - Bangalore in 2011 and 2012
Retail Pricing Perspective
Amit Kapoor
Plus de Amit Kapoor
(19)
Python Visualisation for Data Science
Deep Learning for NLP
The Power of Ensembles in Machine Learning
Model Visualisation
Model Visualisation
Storytelling with Data - Approach | Skills
Visualising Big Data
Learning the Craft of Data Visualisation
Visualising Multi Dimensional Data
Tools & Resources for Data Visualisation
Storytelling with Data - See | Show | Tell | Engage
Business Process Improvement - A Strategic and Supply Chain Perspective
What makes a data-story work?
What is Strategy - Thinking like a Strategist
Telling Stories with Data - Using Story Spine
Story Structure and Modern Storytelling
Targeting the Moment of Truth - Using Big Data in Retail
Storytelling - Gutenberg
Analytics in Consulting
Retail Pricing Perspective
Dernier
Federal Constitution of the Swiss Confederation
SR-101-01012024-EN.docx Federal Constitution of the Swiss Confederation
EfruzAsilolu
Top profile Call Girls In bhavnagar [ 7014168258 ] Call Me For Genuine Models We are available 24*7 Booking Contact Details :- WhatsApp Chat :- +91-7014168258 If you're looking for India Call girls you've come to the right place. You'll find some of the most beautiful call girls in our location with. These ladies have pleasing personalities, hot figures, and a passion for physical pleasure. Call girls in India Lucknow Many men have booked them for their erotic and soul-mixing performances, which are sure to leave you with unforgettable memories. #K09 Escort Service India is available in the city for men and women of all ages. They can satisfy your sexual needs and will make your experience even more enjoyable and memorable. Whether you're looking for a blow-job, stripping, lovemaking, or other dirty acts, you'll be able to find a match for your tastes and budget. These highly trained professionals will help you have an unforgettable night. One Shot — 5000/in call (time 1 hour), 6000/out call Two shot with one girl — 8000/in call (time 2 hour), 10000/out call Body to body massage with sex- 8000/in call (time 1 hour) Full night Service for one person– 12000/in call, 13000/out call (shot limit 3-4 shots) Full night Service for more than 1 person — please contact Us —7014168258 We are available 24*7 all days of the year. Call us — 7014168258 Thank you for Visiting.
Top profile Call Girls In bhavnagar [ 7014168258 ] Call Me For Genuine Models...
gajnagarg
#Dubai Call Girls Agency +971525547819 #Indian And Pakistani Call Girls Dubai #Dubai Indian Call Girls Agency Class Call Girls In Dubai #First Class Call Girls In Dubai #Full Massage Services Call Girls In Dubai #Al Jaddaf,Al Jaffiliya,Business Bay,Al Karama,Bur Dubai,Deira,Dubai,Palm Jumeirah,Al Wasl,Trade Centre,Dubai Mall,JBR,JVC,JLT,Discovery Garden #Dubai Call Girls Services Provide In Ajman_Dubai_RAK_UMQ_Fujairah_Abu_Dhabi#Indian #Tamil #Kerala #Russian #Philippine #Morocco #Thailand #English Models In Dubai #If You Want Serv#Dubai Pakistani Call Girls Agency #Beautiful Call Girls in Dubai #High ices Just Send Me Text On Whatsapp +971525547819 #Website Link http://Dubaicallgirls.pro https://chatwith.io/s/65d1df48b2992
Dubai Call Girls Peeing O525547819 Call Girls Dubai
kojalkojal131
new
Lecture_2_Deep_Learning_Overview-newone1
ranjankumarbehera14
原版定制【微信:176555708】【圣路易斯大学毕业证(SLU毕业证书) 】【微信:176555708】(留信学历认证永久存档查询)采用学校原版纸张、特殊工艺完全按照原版一比一制作(包括:隐形水印,阴影底纹,钢印LOGO烫金烫银,LOGO烫金烫银复合重叠,文字图案浮雕,激光镭射,紫外荧光,温感,复印防伪)行业标杆!精益求精,诚心合作,真诚制作!多年品质 ,按需精细制作,24小时接单,全套进口原装设备,十五年致力于帮助留学生解决难题,业务范围有加拿大、英国、澳洲、韩国、美国、新加坡,新西兰等学历材料,包您满意。 【业务选择办理准则】 一、工作未确定,回国需先给父母、亲戚朋友看下文凭的情况,办理一份就读学校的毕业证【微信176555708】文凭即可 二、回国进私企、外企、自己做生意的情况,这些单位是不查询毕业证真伪的,而且国内没有渠道去查询国外文凭的真假,也不需要提供真实教育部认证。鉴于此,办理一份毕业证【微信176555708】即可 三、进国企,银行,事业单位,考公务员等等,这些单位是必需要提供真实教育部认证的,办理教育部认证所需资料众多且烦琐,所有材料您都必须提供原件,我们凭借丰富的经验,快捷的绿色通道帮您快速整合材料,让您少走弯路。 留信网认证的作用: 1:该专业认证可证明留学生真实身份 2:同时对留学生所学专业登记给予评定 3:国家专业人才认证中心颁发入库证书 4:这个认证书并且可以归档倒地方 5:凡事获得留信网入网的信息将会逐步更新到个人身份内,将在公安局网内查询个人身份证信息后,同步读取人才网入库信息 6:个人职称评审加20分 7:个人信誉贷款加10分 8:在国家人才网主办的国家网络招聘大会中纳入资料,供国家高端企业选择人才 留信网服务项目: 1、留学生专业人才库服务(留信分析) 2、国(境)学习人员提供就业推荐信服务 3、留学人员区块链存储服务 → 【关于价格问题(保证一手价格)】 我们所定的价格是非常合理的,而且我们现在做得单子大多数都是代理和回头客户介绍的所以一般现在有新的单子 我给客户的都是第一手的代理价格,因为我想坦诚对待大家 不想跟大家在价格方面浪费时间 对于老客户或者被老客户介绍过来的朋友,我们都会适当给一些优惠。 选择实体注册公司办理,更放心,更安全!我们的承诺:可来公司面谈,可签订合同,会陪同客户一起到教育部认证窗口递交认证材料,客户在教育部官方认证查询网站查询到认证通过结果后付款,不成功不收费!
怎样办理圣路易斯大学毕业证(SLU毕业证书)成绩单学校原版复制
vexqp
Top profile Call Girls In Purnia [ 7014168258 ] Call Me For Genuine Models We are available 24*7 Booking Contact Details :- WhatsApp Chat :- +91-7014168258 If you're looking for India Call girls you've come to the right place. You'll find some of the most beautiful call girls in our location with. These ladies have pleasing personalities, hot figures, and a passion for physical pleasure. Call girls in India Lucknow Many men have booked them for their erotic and soul-mixing performances, which are sure to leave you with unforgettable memories. #K09 Escort Service India is available in the city for men and women of all ages. They can satisfy your sexual needs and will make your experience even more enjoyable and memorable. Whether you're looking for a blow-job, stripping, lovemaking, or other dirty acts, you'll be able to find a match for your tastes and budget. These highly trained professionals will help you have an unforgettable night. One Shot — 5000/in call (time 1 hour), 6000/out call Two shot with one girl — 8000/in call (time 2 hour), 10000/out call Body to body massage with sex- 8000/in call (time 1 hour) Full night Service for one person– 12000/in call, 13000/out call (shot limit 3-4 shots) Full night Service for more than 1 person — please contact Us —7014168258 We are available 24*7 all days of the year. Call us — 7014168258 Thank you for Visiting.
Top profile Call Girls In Purnia [ 7014168258 ] Call Me For Genuine Models We...
nirzagarg
原版定制【微信:176555708】【伦敦大学城市学院毕业证(CITY毕业证书) 】【微信:176555708】(留信学历认证永久存档查询)采用学校原版纸张、特殊工艺完全按照原版一比一制作(包括:隐形水印,阴影底纹,钢印LOGO烫金烫银,LOGO烫金烫银复合重叠,文字图案浮雕,激光镭射,紫外荧光,温感,复印防伪)行业标杆!精益求精,诚心合作,真诚制作!多年品质 ,按需精细制作,24小时接单,全套进口原装设备,十五年致力于帮助留学生解决难题,业务范围有加拿大、英国、澳洲、韩国、美国、新加坡,新西兰等学历材料,包您满意。 【业务选择办理准则】 一、工作未确定,回国需先给父母、亲戚朋友看下文凭的情况,办理一份就读学校的毕业证【微信176555708】文凭即可 二、回国进私企、外企、自己做生意的情况,这些单位是不查询毕业证真伪的,而且国内没有渠道去查询国外文凭的真假,也不需要提供真实教育部认证。鉴于此,办理一份毕业证【微信176555708】即可 三、进国企,银行,事业单位,考公务员等等,这些单位是必需要提供真实教育部认证的,办理教育部认证所需资料众多且烦琐,所有材料您都必须提供原件,我们凭借丰富的经验,快捷的绿色通道帮您快速整合材料,让您少走弯路。 留信网认证的作用: 1:该专业认证可证明留学生真实身份 2:同时对留学生所学专业登记给予评定 3:国家专业人才认证中心颁发入库证书 4:这个认证书并且可以归档倒地方 5:凡事获得留信网入网的信息将会逐步更新到个人身份内,将在公安局网内查询个人身份证信息后,同步读取人才网入库信息 6:个人职称评审加20分 7:个人信誉贷款加10分 8:在国家人才网主办的国家网络招聘大会中纳入资料,供国家高端企业选择人才 留信网服务项目: 1、留学生专业人才库服务(留信分析) 2、国(境)学习人员提供就业推荐信服务 3、留学人员区块链存储服务 → 【关于价格问题(保证一手价格)】 我们所定的价格是非常合理的,而且我们现在做得单子大多数都是代理和回头客户介绍的所以一般现在有新的单子 我给客户的都是第一手的代理价格,因为我想坦诚对待大家 不想跟大家在价格方面浪费时间 对于老客户或者被老客户介绍过来的朋友,我们都会适当给一些优惠。 选择实体注册公司办理,更放心,更安全!我们的承诺:可来公司面谈,可签订合同,会陪同客户一起到教育部认证窗口递交认证材料,客户在教育部官方认证查询网站查询到认证通过结果后付款,不成功不收费!
怎样办理伦敦大学城市学院毕业证(CITY毕业证书)成绩单学校原版复制
vexqp
Top profile Call Girls In Satna [ 7014168258 ] Call Me For Genuine Models We are available 24*7 Booking Contact Details :- WhatsApp Chat :- +91-7014168258 If you're looking for India Call girls you've come to the right place. You'll find some of the most beautiful call girls in our location with. These ladies have pleasing personalities, hot figures, and a passion for physical pleasure. Call girls in India Lucknow Many men have booked them for their erotic and soul-mixing performances, which are sure to leave you with unforgettable memories. #K09 Escort Service India is available in the city for men and women of all ages. They can satisfy your sexual needs and will make your experience even more enjoyable and memorable. Whether you're looking for a blow-job, stripping, lovemaking, or other dirty acts, you'll be able to find a match for your tastes and budget. These highly trained professionals will help you have an unforgettable night. One Shot — 5000/in call (time 1 hour), 6000/out call Two shot with one girl — 8000/in call (time 2 hour), 10000/out call Body to body massage with sex- 8000/in call (time 1 hour) Full night Service for one person– 12000/in call, 13000/out call (shot limit 3-4 shots) Full night Service for more than 1 person — please contact Us —7014168258 We are available 24*7 all days of the year. Call us — 7014168258 Thank you for Visiting.
Top profile Call Girls In Satna [ 7014168258 ] Call Me For Genuine Models We ...
nirzagarg
Top profile Call Girls In Bihar Sharif [ 7014168258 ] Call Me For Genuine Models We are available 24*7 Booking Contact Details :- WhatsApp Chat :- +91-7014168258 If you're looking for India Call girls you've come to the right place. You'll find some of the most beautiful call girls in our location with. These ladies have pleasing personalities, hot figures, and a passion for physical pleasure. Call girls in India Lucknow Many men have booked them for their erotic and soul-mixing performances, which are sure to leave you with unforgettable memories. #K09 Escort Service India is available in the city for men and women of all ages. They can satisfy your sexual needs and will make your experience even more enjoyable and memorable. Whether you're looking for a blow-job, stripping, lovemaking, or other dirty acts, you'll be able to find a match for your tastes and budget. These highly trained professionals will help you have an unforgettable night. One Shot — 5000/in call (time 1 hour), 6000/out call Two shot with one girl — 8000/in call (time 2 hour), 10000/out call Body to body massage with sex- 8000/in call (time 1 hour) Full night Service for one person– 12000/in call, 13000/out call (shot limit 3-4 shots) Full night Service for more than 1 person — please contact Us —7014168258 We are available 24*7 all days of the year. Call us — 7014168258 Thank you for Visiting.
Top profile Call Girls In Bihar Sharif [ 7014168258 ] Call Me For Genuine Mod...
nirzagarg
As electricity is difficult to store, it is crucial to strictly maintain the balance between production and consumption. The integration of intermittent renewable energies into the production mix has made the management of the balance more complex. However, access to near real-time data and communication with consumers via smart meters suggest demand response. Specifically, sending signals would encourage users to adjust their consumption according to the production of electricity. The algorithms used to select these signals must learn consumer reactions and optimize them while balancing exploration and exploitation. Various sequential or reinforcement learning approaches are being considered.
Sequential and reinforcement learning for demand side management by Margaux B...
Paris Women in Machine Learning and Data Science
Data analysis tasks.
Data Analyst Tasks to do the internship.pdf
theeltifs
Top profile Call Girls In Chandrapur [ 7014168258 ] Call Me For Genuine Models We are available 24*7 Booking Contact Details :- WhatsApp Chat :- +91-7014168258 If you're looking for India Call girls you've come to the right place. You'll find some of the most beautiful call girls in our location with. These ladies have pleasing personalities, hot figures, and a passion for physical pleasure. Call girls in India Lucknow Many men have booked them for their erotic and soul-mixing performances, which are sure to leave you with unforgettable memories. #K09 Escort Service India is available in the city for men and women of all ages. They can satisfy your sexual needs and will make your experience even more enjoyable and memorable. Whether you're looking for a blow-job, stripping, lovemaking, or other dirty acts, you'll be able to find a match for your tastes and budget. These highly trained professionals will help you have an unforgettable night. One Shot — 5000/in call (time 1 hour), 6000/out call Two shot with one girl — 8000/in call (time 2 hour), 10000/out call Body to body massage with sex- 8000/in call (time 1 hour) Full night Service for one person– 12000/in call, 13000/out call (shot limit 3-4 shots) Full night Service for more than 1 person — please contact Us —7014168258 We are available 24*7 all days of the year. Call us — 7014168258 Thank you for Visiting.
Top profile Call Girls In Chandrapur [ 7014168258 ] Call Me For Genuine Model...
gajnagarg
This presentation talks about how the power of Generative AI can be utilize to revolutionize the Business Intelligence and Reporting. Challenges with the traditional BI approach, benefits of using Generative AI, use cases for BI and reporting, Implementation considerations, and future outlook.
Harnessing the Power of GenAI for BI and Reporting.pptx
Paras Gupta
5CL-ADBA,5cladba, Chinese supplier, safety is guaranteed
amy56318795
Federal Constitution of the Swiss Confederation of 18 April 1999 (Status as of 1 January 2024)
Switzerland Constitution 2002.pdf.........
EfruzAsilolu
原版定制【微信:153539019】《英国诺森比亚大学毕业证(NU毕业证书)》【微信:153539019】(留信学历认证永久存档查询)采用学校原版纸张、特殊工艺完全按照原版一比一制作(包括:隐形水印,阴影底纹,钢印LOGO烫金烫银,LOGO烫金烫银复合重叠,文字图案浮雕,激光镭射,紫外荧光,温感,复印防伪)行业标杆!精益求精,诚心合作,真诚制作!多年品质 ,按需精细制作,24小时接单,全套进口原装设备,十五年致力于帮助留学生解决难题,业务范围有加拿大、英国、澳洲、韩国、美国、新加坡,新西兰等学历材料,包您满意。 【业务选择办理准则】 一、工作未确定,回国需先给父母、亲戚朋友看下文凭的情况,办理一份就读学校的毕业证【微信153539019】文凭即可 二、回国进私企、外企、自己做生意的情况,这些单位是不查询毕业证真伪的,而且国内没有渠道去查询国外文凭的真假,也不需要提供真实教育部认证。鉴于此,办理一份毕业证【微信153539019】即可 三、进国企,银行,事业单位,考公务员等等,这些单位是必需要提供真实教育部认证的,办理教育部认证所需资料众多且烦琐,所有材料您都必须提供原件,我们凭借丰富的经验,快捷的绿色通道帮您快速整合材料,让您少走弯路。 留信网认证的作用: 1:该专业认证可证明留学生真实身份 2:同时对留学生所学专业登记给予评定 3:国家专业人才认证中心颁发入库证书 4:这个认证书并且可以归档倒地方 5:凡事获得留信网入网的信息将会逐步更新到个人身份内,将在公安局网内查询个人身份证信息后,同步读取人才网入库信息 6:个人职称评审加20分 7:个人信誉贷款加10分 8:在国家人才网主办的国家网络招聘大会中纳入资料,供国家高端企业选择人才 【关于价格问题(保证一手价格)】 我们所定的价格是非常合理的,而且我们现在做得单子大多数都是代理和回头客户介绍的所以一般现在有新的单子 我给客户的都是第一手的代理价格,因为我想坦诚对待大家 不想跟大家在价格方面浪费时间 对于老客户或者被老客户介绍过来的朋友,我们都会适当给一些优惠。
如何办理英国诺森比亚大学毕业证(NU毕业证书)成绩单原件一模一样
wsppdmt
My MIT paper laying out the framework for Digital Transformation
Digital Transformation Playbook by Graham Ware
Graham Ware
Top profile Call Girls In dimapur [ 7014168258 ] Call Me For Genuine Models We are available 24*7 Booking Contact Details :- WhatsApp Chat :- +91-7014168258 If you're looking for India Call girls you've come to the right place. You'll find some of the most beautiful call girls in our location with. These ladies have pleasing personalities, hot figures, and a passion for physical pleasure. Call girls in India Lucknow Many men have booked them for their erotic and soul-mixing performances, which are sure to leave you with unforgettable memories. #K09 Escort Service India is available in the city for men and women of all ages. They can satisfy your sexual needs and will make your experience even more enjoyable and memorable. Whether you're looking for a blow-job, stripping, lovemaking, or other dirty acts, you'll be able to find a match for your tastes and budget. These highly trained professionals will help you have an unforgettable night. One Shot — 5000/in call (time 1 hour), 6000/out call Two shot with one girl — 8000/in call (time 2 hour), 10000/out call Body to body massage with sex- 8000/in call (time 1 hour) Full night Service for one person– 12000/in call, 13000/out call (shot limit 3-4 shots) Full night Service for more than 1 person — please contact Us —7014168258 We are available 24*7 all days of the year. Call us — 7014168258 Thank you for Visiting.
Top profile Call Girls In dimapur [ 7014168258 ] Call Me For Genuine Models W...
gajnagarg
Jual Obat Aborsi Cytotec & Gastrul Asli 2024 ⋆ 082223109953 ⋆ Cara Menggugurkan Kandungan Untuk Usia Janin 1-8 Bulan Secara Alami Dan Cepat Dalam 1 Hari Gugur Tuntas KLINIK _ APOTIK ONLINE SOLUSI MENGGUGURKAN MASALAH KEHAMILAN ANDA | JUAL OBAT ABORSI ASLI ( WA – 082223109953 ) KLINIK ABORSI TERPEECAYA _ JUAL OBAT ABORSI CYTOTEC MISOPROSTOL ASLI 100% AMPUH HANYA 3 JAM LANGSUNG GUGUR || OBAT PENGGUGUR JANIN KANDUNGAN AMPUH | JUAL OBAT ABORSI ASLI, AMPUH, MANJUR, TUNTAS | OBAT ABORSI OLINE “APOTIK JUAL OBAT CYTOTEC, GASTRUL, GYNACOSIDE ASLI AMPUH. JUAL ” OBAT ABORSI TUNTAS | OBAT ABORSI MANJUR | OBAT ABORSI AMPUH | OBAT PENGGUGUR JANIN | OBAT PENCEGAH KEHAMILAN | OBAT PELANCAR HAID | OBAT TERLAMBAT BULAN | CIRI OBAT ABORSI ASLI | OBAT TELAT BULAN | PIL ABORSI ASLI | CARA MENGGUGURKAN KANDUNGAN | CARA ABORSI TUNTAS | HARGA OBAT ABORSI ASLI | PIL ABORSI | JUAL OBAT ABORSI CYTOTEC | CARA ABORSI SENDIRI | CARA ABORSI USIA 1 BULAN | CARA ABORSI USIA 2 BULA | CARA ABORSI USIA 3 BULAN | OBAT ABORSI USIA 4 BULAN | CARA ABORSI USIA 5 BULAN | CARA MENGGUGURKAN KANDUNGAN | OBAT PENGGUGUR KANDUNGAN | CARA MENGHITUNG USIA KANDUNGAN | CARA MENGATASI TERLAMBAT BULAN | PENJUAL OBAT ABORSI ASLI | OBAT ABORSI GARANSI | OBAT PELUNTUR KANDUNGAN | OBAT TELAT DATANG BULAN | OBAT TELAT HAID | OBAT ABORSI PALING MURAH | KLINIK JUAL OBAT ABORSI | JUAL PIL CYTOTEC | APOTIK JUAL OBAT ABORSI | DOKTER ABORSI KANDUNGAN | CARA ABORSI CEPAT | JUAL OBAT ABORSI BERGARANSI | JUAL OBAT CYTOTEC ASLI | OBAT ABORSI AMAN MANJUR | OBAT MISOPROSTOL CYTOTEC ASLI
Jual Cytotec Asli Obat Aborsi No. 1 Paling Manjur
ptikerjasaptiker
原版定制【微信:176555708】【旧金山城市学院毕业证(CCSF毕业证书) 】【微信:176555708】(留信学历认证永久存档查询)采用学校原版纸张、特殊工艺完全按照原版一比一制作(包括:隐形水印,阴影底纹,钢印LOGO烫金烫银,LOGO烫金烫银复合重叠,文字图案浮雕,激光镭射,紫外荧光,温感,复印防伪)行业标杆!精益求精,诚心合作,真诚制作!多年品质 ,按需精细制作,24小时接单,全套进口原装设备,十五年致力于帮助留学生解决难题,业务范围有加拿大、英国、澳洲、韩国、美国、新加坡,新西兰等学历材料,包您满意。 【业务选择办理准则】 一、工作未确定,回国需先给父母、亲戚朋友看下文凭的情况,办理一份就读学校的毕业证【微信176555708】文凭即可 二、回国进私企、外企、自己做生意的情况,这些单位是不查询毕业证真伪的,而且国内没有渠道去查询国外文凭的真假,也不需要提供真实教育部认证。鉴于此,办理一份毕业证【微信176555708】即可 三、进国企,银行,事业单位,考公务员等等,这些单位是必需要提供真实教育部认证的,办理教育部认证所需资料众多且烦琐,所有材料您都必须提供原件,我们凭借丰富的经验,快捷的绿色通道帮您快速整合材料,让您少走弯路。 留信网认证的作用: 1:该专业认证可证明留学生真实身份 2:同时对留学生所学专业登记给予评定 3:国家专业人才认证中心颁发入库证书 4:这个认证书并且可以归档倒地方 5:凡事获得留信网入网的信息将会逐步更新到个人身份内,将在公安局网内查询个人身份证信息后,同步读取人才网入库信息 6:个人职称评审加20分 7:个人信誉贷款加10分 8:在国家人才网主办的国家网络招聘大会中纳入资料,供国家高端企业选择人才 留信网服务项目: 1、留学生专业人才库服务(留信分析) 2、国(境)学习人员提供就业推荐信服务 3、留学人员区块链存储服务 → 【关于价格问题(保证一手价格)】 我们所定的价格是非常合理的,而且我们现在做得单子大多数都是代理和回头客户介绍的所以一般现在有新的单子 我给客户的都是第一手的代理价格,因为我想坦诚对待大家 不想跟大家在价格方面浪费时间 对于老客户或者被老客户介绍过来的朋友,我们都会适当给一些优惠。 选择实体注册公司办理,更放心,更安全!我们的承诺:可来公司面谈,可签订合同,会陪同客户一起到教育部认证窗口递交认证材料,客户在教育部官方认证查询网站查询到认证通过结果后付款,不成功不收费!
怎样办理旧金山城市学院毕业证(CCSF毕业证书)成绩单学校原版复制
vexqp
Dernier
(20)
SR-101-01012024-EN.docx Federal Constitution of the Swiss Confederation
Top profile Call Girls In bhavnagar [ 7014168258 ] Call Me For Genuine Models...
Dubai Call Girls Peeing O525547819 Call Girls Dubai
Lecture_2_Deep_Learning_Overview-newone1
怎样办理圣路易斯大学毕业证(SLU毕业证书)成绩单学校原版复制
Top profile Call Girls In Purnia [ 7014168258 ] Call Me For Genuine Models We...
怎样办理伦敦大学城市学院毕业证(CITY毕业证书)成绩单学校原版复制
Top profile Call Girls In Satna [ 7014168258 ] Call Me For Genuine Models We ...
Top profile Call Girls In Bihar Sharif [ 7014168258 ] Call Me For Genuine Mod...
Sequential and reinforcement learning for demand side management by Margaux B...
Data Analyst Tasks to do the internship.pdf
Top profile Call Girls In Chandrapur [ 7014168258 ] Call Me For Genuine Model...
Harnessing the Power of GenAI for BI and Reporting.pptx
5CL-ADBA,5cladba, Chinese supplier, safety is guaranteed
Switzerland Constitution 2002.pdf.........
如何办理英国诺森比亚大学毕业证(NU毕业证书)成绩单原件一模一样
Digital Transformation Playbook by Graham Ware
Top profile Call Girls In dimapur [ 7014168258 ] Call Me For Genuine Models W...
Jual Cytotec Asli Obat Aborsi No. 1 Paling Manjur
怎样办理旧金山城市学院毕业证(CCSF毕业证书)成绩单学校原版复制
Télécharger maintenant