HRGRN: enabling graph search and integrative analysis of Arabidopsis signaling transduction, metabolism and gene regulation networks

The biological networks controlling plant signal transduction, metabolism and gene regulation are composed of not only genes, RNA, protein and compounds but also the complicated interactions among them. Yet, even in the most thoroughly studied model plant Arabidopsis thaliana, the knowledge regarding these interactions are scattered throughout literatures and various public databases. Thus, new scientific discovery by exploring these complex and heterogeneous data remains a challenge task for biologists. We developed a graph-search empowered platform named HRGRN to search known and, more importantly, discover the novel relationships among genes in Arabidopsis biological networks. The HRGRN includes over 51,000 “nodes” that represent very large sets of genes, proteins, small RNAs, and compounds and approximately 150,000 “edges” that are classified into nine types of interactions (interactions between proteins, compounds and proteins, transcription factors (TFs) and their downstream target genes, small RNAs and their target genes, kinases and downstream target genes, transporters and substrates, substrate/product compounds and enzymes, as well as gene pairs with similar expression patterns to provide deep insight into gene-gene relationships) to comprehensively model and represent the complex interactions between nodes. . The HRGRN allows users to discover novel interactions between genes and/or pathways, and build sub-networks from user-specified seed nodes by searching the comprehensive collections of interactions stored in its back-end graph databases using graph traversal algorithms. The HRGRN database is freely available at http://plantgrn.noble.org/hrgrn/. Currently, we are collaborating the Araport team to develop REST-like web services and provide the HRGRN’s graph search functions to Araport system.

Recommended
Recommended
More Related Content
What's hot
What's hot (20)
Similar to HRGRN: enabling graph search and integrative analysis of Arabidopsis signaling transduction, metabolism and gene regulation networks
Similar to HRGRN: enabling graph search and integrative analysis of Arabidopsis signaling transduction, metabolism and gene regulation networks (20)
Recently uploaded
Recently uploaded (20)
HRGRN: enabling graph search and integrative analysis of Arabidopsis signaling transduction, metabolism and gene regulation networks
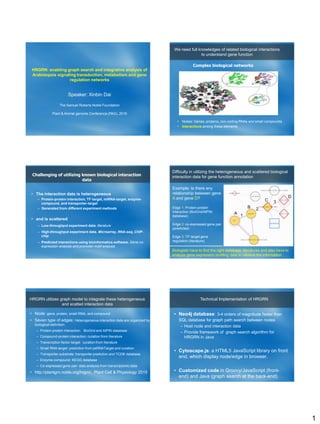
- 1. 1 HRGRN: enabling graph search and integrative analysis of Arabidopsis signaling transduction, metabolism and gene regulation networks Speaker: Xinbin Dai The Samuel Roberts Noble Foundation Plant & Animal genome Conference (PAG), 2016 • Nodes: Genes, proteins, non-coding RNAs and small compounds • Interactions among these elements Complex biological networks We need full knowledges of related biological interactions to understand gene function • The interaction data is heterogeneous – Protein-protein interaction, TF-target, miRNA-target, enzyme- compound, and transporter-target – Generated from different experiment methods • and is scattered – Low-throughput experiment data. literature – High-throughput experiment data. Microarray, RNA-seq, ChIP- chip – Predicted interactions using bioinformatics software. Gene co- expression analysis and promoter motif analysis Challenging of utilizing known biological interaction data Example: Is there any relationship between gene A and gene D? Edge 1: Protein-protein interaction (BioGrid/AtPIN database) Edge 2: co-expressed gene pair (predicted) Edge 3: TF-target gene regulation (literature) A D 1 2 3 Difficulty in utilizing the heterogeneous and scattered biological interaction data for gene function annotation C B Biologists have to find the right database, literatures and also have to analyze gene expression profiling data to retrieve the information. • Node: gene, protein, small RNA, and compound • Seven type of edges: Heterogeneous interaction data are organized by biological definition: – Protein-protein interaction: BioGrid and AtPIN database – Compound-protein interaction: curation from literature – Transcription factor-target: curation from literature – Small RNA-target: prediction from psRNATarget and curation – Transporter-substrate: transporter prediction and TCDB database – Enzyme-compound: KEGG database – Co-expressed gene pair: data analysis from transcriptomic data • http://plantgrn.noble.org/hrgrn/, Plant Cell & Physiology 2015 HRGRN utilizes graph model to integrate these heterogeneous and scatted interaction data • Neo4j database: 3-4 orders of magnitude faster than SQL database for graph path search between nodes – Host node and interaction data – Provide framework of graph search algorithm for HRGRN in Java • Cytoscape.js: a HTML5 JavaScript library on front end, which display node/edge in browser. • Customized code in Groovy/JavaScript (front- end) and Java (graph search at the back-end) Technical Implementation of HRGRN
- 2. 2 Case #1: HRGRN provides all associated nodes and interactions of a specific gene in a graph of the neighborhood • Individual gene-centered sub-network • Graph traversal algorithms in Neo4j database - Breadth-first search • Customized Java code for our defined edge types and other properties during search Predicted relationship Validated relationship Positive Interaction HRGRN use line color, line shape and arrow shape to represent interaction properties Negative Interaction Graph search and visualization are user-customizable • Highlight node by keyword • Change color for highlighting • Toggle predicted/validated edge display • Change graph layout • Export graph figure Change graph path search option: • Type of interaction by biological definition • Validate or predicted interaction • Quantified similarity of co- expression pattern between genes Case #2: HRGRN can discover “unknown” relationships between genes • The relationships between ATCUL3 and IAA28 will be skipped during a traditional SQL database query • Shortest path search algorithm in unweighted graph model • Searching behavior is customizable in terms of interaction properties: biological type, evidence and etc. • Future: Dijkstra’s algorithm in weighted model Case#3: Building sub-network over a group of user- submitted nodes Shortest path search algorithm was extended to construct the sub- network for a group of genes Connecting to Araport --- Step 1: REST web service • We developed REST interface for each service in HRGRN • Example: searching “unknown” relationship between genes (case #2) – When user visit http://plantgrn.noble.org/hrgrn/path?hasParams=T&node1=np02084&steps=3&node2 =np12356&pathalg=allSimplePaths&PPI_validated=T&GENEEXPREGU_validated=T &COEXP_predicted=T&format=json – Web site will generate JSON code as below instead of full HTML5 web page:
- 3. 3 • A python proxy script providing common interface for upstream web services (Araport team developed) • GitHub account • https://www.araport.org/api-explorer Connecting to Araport --- Step 2: proxy portal Connecting to Araport --- Step 3: Science App https://www.araport.org/apps/eriksf/hrgrn-app • Araport can generate an individual-gene centered subnetwork based on REST web service from HRGRN • No user customization panel Suggestion for Araport • Supporting more languages for Proxy adapter, e.g., Java, JavaScript and Perl. Acknowledgement The Noble Foundation • Patrick Zhao • Tingsong Liu • Jun Li • Zhaohong Zhuang • Junil Chang • Wenchao Zhang JCVI • Irina Belyaeva • Jason Miller • Chris Town • Vivek Krishnakumar Open Source Community • CentOS Linux • Oracle Java • Resin, Java web server • Groovy, Java-based script language • Neo4J, open source Graph database • Cytoscape.js, HTML5 web front-end • JQuery, JavaScript framework