Virginia State Bridge Profile
•
1 like•598 views

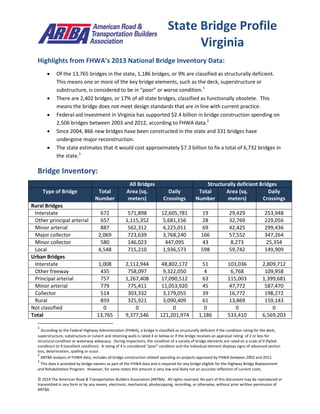
Virginia has 13,765 bridges, of which 1,186 (9%) are structurally deficient. There are also 2,402 bridges (17%) that are functionally obsolete. Between 2003-2012, $2.4 billion was spent on bridge construction and rehabilitation projects through federal funding. It is estimated that it would cost $7.3 billion to repair the state's 6,732 bridges identified as needing work. The document provides details on bridge conditions, investments, proposed repair work, and a list of the top 10 most traveled structurally deficient bridges in the state.

Recommended
More Related Content
What's hot
What's hot (20)
Similar to Virginia State Bridge Profile
Similar to Virginia State Bridge Profile (11)
More from artba
More from artba (20)
Virginia State Bridge Profile
- 1. © 2014 The American Road & Transportation Builders Association (ARTBA). All rights reserved. No part of this document may be reproduced or transmitted in any form or by any means, electronic, mechanical, photocopying, recording, or otherwise, without prior written permission of ARTBA. Highlights from FHWA’s 2013 National Bridge Inventory Data: Of the 13,765 bridges in the state, 1,186 bridges, or 9% are classified as structurally deficient. This means one or more of the key bridge elements, such as the deck, superstructure or substructure, is considered to be in “poor” or worse condition.1 There are 2,402 bridges, or 17% of all state bridges, classified as functionally obsolete. This means the bridge does not meet design standards that are in line with current practice. Federal-aid investment in Virginia has supported $2.4 billion in bridge construction spending on 2,506 bridges between 2003 and 2012, according to FHWA data.2 Since 2004, 866 new bridges have been constructed in the state and 331 bridges have undergone major reconstruction. The state estimates that it would cost approximately $7.3 billion to fix a total of 6,732 bridges in the state.3 Bridge Inventory: All Bridges Structurally deficient Bridges Type of Bridge Total Number Area (sq. meters) Daily Crossings Total Number Area (sq. meters) Daily Crossings Rural Bridges Interstate 672 571,898 12,605,781 19 29,429 253,948 Other principal arterial 657 1,115,352 5,681,156 28 32,769 229,056 Minor arterial 887 562,312 4,225,011 69 42,425 299,436 Major collector 2,069 723,639 3,768,240 166 57,552 347,264 Minor collector 580 146,023 447,095 43 8,273 25,354 Local 4,548 715,210 1,936,573 598 59,742 149,909 Urban Bridges Interstate 1,008 2,112,944 48,802,172 51 103,036 2,809,712 Other freeway 435 758,097 9,322,050 4 6,768 109,958 Principal arterial 757 1,267,408 17,090,512 63 115,003 1,399,681 Minor arterial 779 775,411 11,053,920 45 47,772 587,470 Collector 514 303,332 3,179,055 39 16,772 198,272 Local 859 325,921 3,090,409 61 13,869 159,143 Not classified 0 0 0 0 0 0 Total 13,765 9,377,546 121,201,974 1,186 533,410 6,569,203 1 According to the Federal Highway Administration (FHWA), a bridge is classified as structurally deficient if the condition rating for the deck, superstructure, substructure or culvert and retaining walls is rated 4 or below or if the bridge receives an appraisal rating of 2 or less for structural condition or waterway adequacy. During inspections, the condition of a variety of bridge elements are rated on a scale of 0 (failed condition) to 9 (excellent condition). A rating of 4 is considered “poor” condition and the individual element displays signs of advanced section loss, deterioration, spalling or scour. 2 ARTBA analysis of FHWA data, includes all bridge construction related spending on projects approved by FHWA between 2003 and 2012. 3 This data is provided by bridge owners as part of the FHWA data and is required for any bridge eligible for the Highway Bridge Replacement and Rehabilitation Program. However, for some states this amount is very low and likely not an accurate reflection of current costs. State Bridge Profile Virginia
- 2. © 2014 The American Road & Transportation Builders Association (ARTBA). All rights reserved. No part of this document may be reproduced or transmitted in any form or by any means, electronic, mechanical, photocopying, recording, or otherwise, without prior written permission of ARTBA. Proposed bridge work: Type of Work Number Cost (millions) Daily Crossings Area (sq. meters) Bridge replacement 2,494 $3,241.6 12,755,804 1,326,168 Widening & rehabilitation 609 $386.9 6,109,089 719,252 Rehabilitation 2,543 $1,926.2 34,717,714 1,579,841 Deck rehabilitation/replacement 82 $34.1 1,242,909 93,124 Other work 1,004 $1,719.3 8,468,482 615,283 Top 10 Most Traveled Structurally Deficient Bridges in the State County Year Built Daily Crossings Type of Bridge Location (route/water under the bridge, traffic on the bridge and location) Richmond 1958 143,310 Urban Interstate LOMBARDY ST & CSX TRANSP, ROUTE 0095 (0064), .62 FR 1 & 1.62 TO 161 Richmond 1958 143,310 Urban Interstate OVERBROOK ROAD, ROUTE 0095 (0064), 1.14 FR 1 & 1.14 TO 161 Richmond 1958 143,310 Urban Interstate ROBINHOOD ROAD, ROUTE 0095 (0064), 1.59fr 1 &.37to Hermitage Richmond 1958 143,310 Urban Interstate SHERWOOD AVENUE, ROUTE 0095 (0064), 1.48 FR 1 & .76 TO 161 Virginia Beach 1967 133,892 Urban Interstate RTE. 414 LYNNHAVEN PKWY., 00264, 1.72 MI.FR.INT.RTE. 411 Virginia Beach 1967 105,572 Urban Interstate London Bridge Road, 00264, 1.05 Mi From Lynnhaven Pk Chesterfield 1958 96,759 Urban Interstate RTE 608 (REYMET RD), INTERSTATE-95, 1.21 Fr 288 & .72 To 613 Arlington 1965 95,402 Urban Interstate RMPS B & F, CUSTIS MEM. HWY., 1.11FR29/01.00TOCONSTITU Richmond 1977 94,483 Urban Interstate INTERSTATE 95, I-95 RAMPS B&D, .1 Fr Bells Rd &.8To I-95 Richmond 1957 91,074 Urban Interstate COLONIAL PIPELINE, INTERSTATE-95, 2.45Fr Bells&1.05To Maury Sources: All data is from the 2013 National Bridge Inventory, released by the Federal Highway Administration in March 2014. Note that specific conditions on bridge may have changed as a result of recent work. Cost estimates of bridge work provided as part of the data and have been adjusted to 2013$ for inflation and estimated project costs. Contract awards data is for state and local government awards and comes from McGraw Hill. Note that additional bridge investment may be a part of other contract awards if a smaller bridge project is included with a highway project, and that would not be accounted for in the total in this profile.