PATENTAMIENTO DE AUTOS CRECIÓ 9,5% EN SEPTIEMBRE, SEGÚN CONCESIONARIOS
•
0 likes•2,239 views

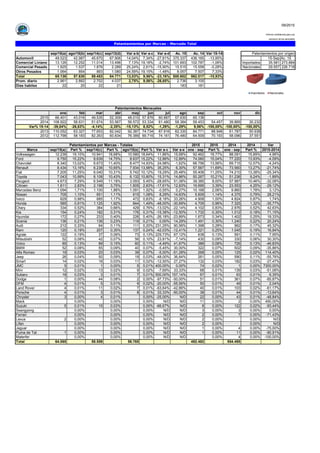
La cantidad de vehículos patentados durante septiembre último creció 9,5% interanual, al sumar 65.138 unidades, informó hoy la Asociación de Concesionarios de Automotores de la República Argentina (ACARA)

Recommended
More Related Content
What's hot
What's hot (20)
Viewers also liked
Viewers also liked (13)
Similar to PATENTAMIENTO DE AUTOS CRECIÓ 9,5% EN SEPTIEMBRE, SEGÚN CONCESIONARIOS
Similar to PATENTAMIENTO DE AUTOS CRECIÓ 9,5% EN SEPTIEMBRE, SEGÚN CONCESIONARIOS (20)
More from Barby Del Pópolo
More from Barby Del Pópolo (20)
Recently uploaded
Recently uploaded (20)
PATENTAMIENTO DE AUTOS CRECIÓ 9,5% EN SEPTIEMBRE, SEGÚN CONCESIONARIOS
- 1. sep/15(a) ago/15(b) sep/14(c) sep/13(d) Var a-b Var a-c Var a-d Ac. 15 Ac. 14 Var 15-14 Automovil 49.023 42.987 45.670 67.906 14,04% 7,34% -27,81% 375.337 436.165 -13,95% 15-Sep Ac. 15 Comercial Liviano 13.126 12.252 11.014 13.496 7,13% 19,18% -2,74% 101.693 102.787 -1,06% Importados 35.581 273.884 Comercial Pesado 1.925 1.537 1.876 2.289 25,24% 2,61% -15,90% 15.515 15.558 -0,28% Nacionales 29.557 226.718 Otros Pesados 1.064 854 893 1.080 24,59% 19,15% -1,48% 8.057 7.507 7,33% Total 65.138 57.630 59.453 84.771 13,03% 9,56% -23,16% 500.602 562.017 -10,93% Prom. diario 2.961 2.882 2.702 4.037 2,75% 9,56% -26,65% 2.736 3.105 Dias habiles 22 20 22 21 183 181 ene feb mar abr may jun jul ago sep oct nov dic 2015 66.401 43.016 49.535 52.309 48.010 57.876 60.687 57.630 65.138 2014 108.922 58.631 51.674 53.567 56.572 53.334 61.480 58.384 59.453 54.457 39.869 30.232 Var% 15-14 -39,04% -26,63% -4,14% -2,35% -15,13% 8,52% -1,29% -1,29% 9,56% -100,00% -100,00% -100,00% 2013 110.052 63.327 77.653 82.042 92.387 74.734 87.916 82.330 84.771 88.948 61.787 50.938 2012 112.798 58.183 82.263 60.834 76.389 69.716 74.161 76.480 64.509 70.193 58.096 37.551 2015 2015 2014 2014 Var Marca sep/15(a) Part % sep/14(c) Part % ago/15(e) Part % Var a-c Var a-e ene - sep Part % ene - sep Part % 2015-2014 Volkswagen 12.239 19,10% 10.941 18,68% 10.580 18,64% 11,86% 15,68% 92.462 18,77% 88.091 15,89% 4,96% Ford 9.750 15,22% 8.639 14,75% 8.637 15,22% 12,86% 12,89% 74.060 15,04% 77.220 13,93% -4,09% Chevrolet 8.340 13,02% 6.673 11,40% 8.477 14,93% 24,98% -1,62% 66.756 13,56% 69.715 12,57% -4,24% Renault 8.434 13,16% 6.236 10,65% 7.934 13,98% 35,25% 6,30% 57.567 11,69% 73.560 13,27% -21,74% Fiat 7.205 11,25% 6.040 10,31% 5.742 10,12% 19,29% 25,48% 55.406 11,25% 74.210 13,38% -25,34% Toyota 7.043 10,99% 6.108 10,43% 6.132 10,80% 15,31% 14,86% 50.267 10,21% 51.236 9,24% -1,89% Peugeot 4.673 7,29% 6.549 11,18% 3.093 5,45% -28,65% 51,08% 39.385 8,00% 57.987 10,46% -32,08% Citroen 1.811 2,83% 2.198 3,75% 1.605 2,83% -17,61% 12,83% 16.695 3,39% 23.553 4,25% -29,12% Mercedes Benz 1.094 1,71% 1.100 1,88% 1.091 1,92% -0,55% 0,27% 10.168 2,06% 9.860 1,78% 3,12% Nissan 705 1,10% 651 1,11% 615 1,08% 8,29% 14,63% 5.609 1,14% 4.375 0,79% 28,21% Iveco 629 0,98% 685 1,17% 472 0,83% -8,18% 33,26% 4.908 1,00% 4.824 0,87% 1,74% Honda 585 0,91% 1.125 1,92% 844 1,49% -48,00% -30,69% 4.705 0,96% 7.325 1,32% -35,77% Chery 334 0,52% 384 0,66% 429 0,76% -13,02% -22,14% 4.102 0,83% 2.876 0,52% 42,63% Kia 154 0,24% 182 0,31% 176 0,31% -15,38% -12,50% 1.732 0,35% 1.012 0,18% 71,15% Hyundai 172 0,27% 233 0,40% 226 0,40% -26,18% -23,89% 1.673 0,34% 1.402 0,25% 19,33% Scania 136 0,21% 136 0,23% 119 0,21% 0,00% 14,29% 1.491 0,30% 1.240 0,22% 20,24% Audi 212 0,33% 64 0,11% 111 0,20% 231,25% 90,99% 1.398 0,28% 962 0,17% 45,32% Ram 120 0,19% 207 0,35% 137 0,24% -42,03% -12,41% 1.221 0,25% 1.045 0,19% 16,84% Agrale 122 0,19% 37 0,06% 73 0,13% 229,73% 67,12% 638 0,13% 591 0,11% 7,95% Mitsubishi 52 0,08% 42 0,07% 56 0,10% 23,81% -7,14% 430 0,09% 330 0,06% 30,30% Volvo 85 0,13% 89 0,15% 60 0,11% -4,49% 41,67% 386 0,08% 726 0,13% -46,83% BMW 52 0,08% 55 0,09% 40 0,07% -5,45% 30,00% 322 0,07% 502 0,09% -35,86% Alfa Romeo 19 0,03% 20 0,03% 39 0,07% -5,00% -51,28% 268 0,05% 125 0,02% 114,40% Jeep 26 0,04% 50 0,09% 19 0,03% -48,00% 36,84% 261 0,05% 590 0,11% -55,76% Smart 14 0,02% 16 0,03% 11 0,02% -12,50% 27,27% 132 0,03% 182 0,03% -27,47% JMC 5 0,01% 1 0,00% 5 0,01% 400,00% 0,00% 74 0,02% 1 0,00% 7300,00% Mini 12 0,02% 13 0,02% 9 0,02% -7,69% 33,33% 68 0,01% 139 0,03% -51,08% Subaru 18 0,03% 3 0,01% 7 0,01% 500,00% 157,14% 67 0,01% 63 0,01% 6,35% Dodge 1 0,00% 44 0,08% 2 0,00% -97,73% -50,00% 51 0,01% 361 0,07% -85,87% DFM 4 0,01% 5 0,01% 9 0,02% -20,00% -55,56% 50 0,01% 49 0,01% 2,04% Land Rover 4 0,01% 11 0,02% 7 0,01% -63,64% -42,86% 40 0,01% 103 0,02% -61,17% Porsche 4 0,01% 3 0,01% 8 0,01% 33,33% -50,00% 38 0,01% 44 0,01% -13,64% Chrysler 3 0,00% 4 0,01% 0,00% -25,00% N/D 22 0,00% 43 0,01% -48,84% Mack 0,00% 0,00% 0,00% N/D N/D 11 0,00% 2 0,00% 450,00% Suzuki 5 0,01% 15 0,03% 0,00% -66,67% N/D 8 0,00% 122 0,02% -93,44% Ssangyong 0,00% 0,00% 0,00% N/D N/D 3 0,00% 3 0,00% 0,00% Ferrari 0,00% 0,00% 0,00% N/D N/D 2 0,00% 7 0,00% -71,43% Lexus 2 0,00% 0,00% 0,00% N/D N/D 2 0,00% 0,00% N/D Lifan 0,00% 0,00% 0,00% N/D N/D 2 0,00% 0,00% N/D Jaguar 0,00% 0,00% 0,00% N/D N/D 1 0,00% 4 0,00% -75,00% Puma de Tat 1 0,00% 0,00% 0,00% N/D N/D 1 0,00% 11 0,00% -90,91% Materfer 0,00% 0,00% 0,00% N/D N/D 0,00% 4 0,00% -100,00% Total 64.065 58.559 56.765 492.482 554.495 Patentamientos por Marcas - Totales 09/2015 Informe confidencial para uso exclusivo de los asociados Patentamientos por Marcas - Mercado Total Patentamientos por origen Patentamientos Mensuales 55%45% Importados Nacionales
- 2. 09/2015 Informe confidencial para uso exclusivo de los asociados Patentamientos por Marcas - Mercado Total 2015 2015 2014 2014 Var Marca sep/15(a) Part % sep/14(c) Part % ago/15(e) Part % Var a-c Var a-e ene - sep Part % ene - sep Part % 2015-2014 Volkswagen 12.057 19,40% 10.714 18,90% 10.377 18,79% 12,54% 16,19% 90.856 19,05% 86.725 16,09% 4,76% Ford 9.363 15,07% 8.338 14,71% 8.376 15,16% 12,29% 11,78% 71.522 14,99% 74.681 13,86% -4,23% Chevrolet 8.340 13,42% 6.673 11,77% 8.477 15,35% 24,98% -1,62% 66.756 13,99% 69.715 12,94% -4,24% Renault 8.422 13,55% 6.194 10,93% 7.924 14,35% 35,97% 6,28% 57.386 12,03% 73.235 13,59% -21,64% Fiat 7.205 11,59% 6.040 10,66% 5.742 10,40% 19,29% 25,48% 55.406 11,62% 74.210 13,77% -25,34% Toyota 7.043 11,33% 6.108 10,78% 6.132 11,10% 15,31% 14,86% 50.267 10,54% 51.236 9,51% -1,89% Peugeot 4.673 7,52% 6.549 11,55% 3.093 5,60% -28,65% 51,08% 39.385 8,26% 57.987 10,76% -32,08% Citroen 1.811 2,91% 2.198 3,88% 1.605 2,91% -17,61% 12,83% 16.695 3,50% 23.553 4,37% -29,12% Nissan 705 1,13% 651 1,15% 615 1,11% 8,29% 14,63% 5.609 1,18% 4.375 0,81% 28,21% Mercedes Benz 538 0,87% 510 0,90% 584 1,06% 5,49% -7,88% 4.733 0,99% 4.298 0,80% 10,12% Honda 585 0,94% 1.125 1,98% 844 1,53% -48,00% -30,69% 4.705 0,99% 7.325 1,36% -35,77% Chery 334 0,54% 384 0,68% 429 0,78% -13,02% -22,14% 4.102 0,86% 2.876 0,53% 42,63% Iveco 213 0,34% 247 0,44% 204 0,37% -13,77% 4,41% 1.966 0,41% 1.658 0,31% 18,58% Kia 154 0,25% 182 0,32% 176 0,32% -15,38% -12,50% 1.732 0,36% 1.012 0,19% 71,15% Hyundai 158 0,25% 221 0,39% 213 0,39% -28,51% -25,82% 1.534 0,32% 1.317 0,24% 16,48% Audi 212 0,34% 64 0,11% 111 0,20% 231,25% 90,99% 1.398 0,29% 962 0,18% 45,32% Ram 120 0,19% 207 0,37% 137 0,25% -42,03% -12,41% 1.221 0,26% 1.045 0,19% 16,84% Mitsubishi 52 0,08% 42 0,07% 56 0,10% 23,81% -7,14% 430 0,09% 330 0,06% 30,30% BMW 52 0,08% 55 0,10% 40 0,07% -5,45% 30,00% 322 0,07% 502 0,09% -35,86% Alfa Romeo 19 0,03% 20 0,04% 39 0,07% -5,00% -51,28% 268 0,06% 125 0,02% 114,40% Jeep 26 0,04% 50 0,09% 19 0,03% -48,00% 36,84% 261 0,05% 590 0,11% -55,76% Smart 14 0,02% 16 0,03% 11 0,02% -12,50% 27,27% 132 0,03% 182 0,03% -27,47% Mini 12 0,02% 13 0,02% 9 0,02% -7,69% 33,33% 68 0,01% 139 0,03% -51,08% Subaru 18 0,03% 3 0,01% 7 0,01% 500,00% 157,14% 67 0,01% 63 0,01% 6,35% Dodge 1 0,00% 44 0,08% 2 0,00% -97,73% -50,00% 51 0,01% 361 0,07% -85,87% Land Rover 4 0,01% 11 0,02% 7 0,01% -63,64% -42,86% 40 0,01% 103 0,02% -61,17% Porsche 4 0,01% 3 0,01% 8 0,01% 33,33% -50,00% 38 0,01% 44 0,01% -13,64% Volvo 2 0,00% 2 0,00% 1 0,00% 0,00% 100,00% 29 0,01% 115 0,02% -74,78% Chrysler 3 0,00% 4 0,01% 0,00% -25,00% N/D 22 0,00% 43 0,01% -48,84% Suzuki 5 0,01% 15 0,03% 0,00% -66,67% N/D 8 0,00% 122 0,02% -93,44% Ssangyong 0,00% 0,00% 0,00% N/D N/D 3 0,00% 3 0,00% 0,00% Ferrari 0,00% 0,00% 0,00% N/D N/D 2 0,00% 7 0,00% -71,43% Lexus 2 0,00% 0,00% 0,00% N/D N/D 2 0,00% 0,00% N/D Lifan 0,00% 0,00% 0,00% N/D N/D 2 0,00% 0,00% N/D Jaguar 0,00% 0,00% 0,00% N/D N/D 1 0,00% 4 0,00% -75,00% Total 62.147 56.683 55.238 477.019 538.943 2015 2015 2014 2014 Var Marca sep/15(a) Part % sep/14(c) Part % ago/15(e) Part % Var a-c Var a-e ene - sep Part % ene - sep Part % 2015-2014 Mercedes Benz 556 28,99% 590 31,45% 507 33,20% -5,76% 9,66% 5.435 35,15% 5.562 35,76% -2,28% Iveco 416 21,69% 438 23,35% 268 17,55% -5,02% 55,22% 2.942 19,03% 3.166 20,36% -7,08% Ford 387 20,18% 301 16,04% 261 17,09% 28,57% 48,28% 2.538 16,41% 2.539 16,33% -0,04% Volkswagen 182 9,49% 227 12,10% 203 13,29% -19,82% -10,34% 1.606 10,39% 1.366 8,78% 17,57% Scania 136 7,09% 136 7,25% 119 7,79% 0,00% 14,29% 1.491 9,64% 1.240 7,97% 20,24% Agrale 122 6,36% 37 1,97% 73 4,78% 229,73% 67,12% 638 4,13% 591 3,80% 7,95% Volvo 83 4,33% 87 4,64% 59 3,86% -4,60% 40,68% 357 2,31% 611 3,93% -41,57% Renault 12 0,63% 42 2,24% 10 0,65% -71,43% 20,00% 181 1,17% 325 2,09% -44,31% Hyundai 14 0,73% 12 0,64% 13 0,85% 16,67% 7,69% 139 0,90% 85 0,55% 63,53% JMC 5 0,26% 1 0,05% 5 0,33% 400,00% 0,00% 74 0,48% 1 0,01% 7300,00% DFM 4 0,21% 5 0,27% 9 0,59% -20,00% -55,56% 50 0,32% 49 0,32% 2,04% Mack 0,00% 0,00% 0,00% N/D N/D 11 0,07% 2 0,01% 450,00% Puma de Tat 1 0,05% 0,00% 0,00% N/D N/D 1 0,01% 11 0,07% -90,91% Materfer 0,00% 0,00% 0,00% N/D N/D 0,00% 4 0,03% -100,00% Total 1.918 1.876 1.527 15.463 15.552 ene feb mar abr may jun jul ago sep oct nov dic Volkswagen 18,48% 19,51% 19,26% 20,28% 18,75% 17,78% 17,42% 18,61% 19,08% Ford 13,86% 15,11% 15,82% 15,16% 16,42% 14,82% 14,14% 15,19% 15,20% Chevrolet 14,96% 12,20% 12,02% 14,07% 13,48% 13,87% 12,67% 14,91% 13,00% Renault 8,68% 10,03% 10,33% 10,25% 9,81% 12,67% 15,19% 13,96% 13,15% Fiat 12,20% 10,46% 12,11% 10,16% 11,70% 11,82% 11,07% 10,10% 11,23% Toyota 9,14% 9,21% 10,54% 10,80% 9,59% 9,46% 10,99% 10,79% 10,98% Peugeot 11,45% 10,82% 8,07% 7,26% 7,38% 7,50% 6,81% 5,44% 7,29% Citroen 3,46% 3,63% 3,25% 3,36% 4,47% 3,76% 3,19% 2,82% 2,82% Mercedes Benz 2,36% 2,07% 1,86% 2,03% 2,24% 2,13% 2,22% 1,92% 1,71% Nissan 1,24% 1,19% 1,17% 1,14% 1,14% 1,12% 1,06% 1,08% 1,10% Patentamientos por Marcas - Autos + Livianos Patentamientos por Marcas - Camiones + Buses 0,00% 5,00% 10,00% 15,00% 20,00% 25,00% ene feb mar abr may jun jul ago sep oct nov dic Participacion por Marcas - Evolucion Mensual Volkswagen Ford Chevrolet Renault Fiat Toyota Peugeot Citroen Mercedes Benz Nissan
- 3. Modelo sep/15 (a) sep/14 (b) ago/15 (c) Var a-b Var a-c Ac. 15 Part % Ac. 14 Part % Var 15-14 1 Volkswagen GOL 3.075 2.722 2.640 12,97% 16,48% 24.331 6,48% 27.261 6,25% -10,75% 2 Chevrolet CLASSIC 3.209 2.283 3.375 40,56% -4,92% 22.700 6,05% 20.179 4,63% 12,49% 3 Fiat PALIO 2.699 1.776 2.023 51,97% 33,42% 21.175 5,64% 22.890 5,25% -7,49% 4 Ford FIESTA KINETIC 2.631 2.627 2.344 0,15% 12,24% 20.847 5,55% 20.073 4,60% 3,86% 5 Ford ECOSPORT 2.573 1.785 2.165 44,15% 18,85% 19.358 5,16% 20.702 4,75% -6,49% 6 Ford FOCUS II 2.232 2.136 2.006 4,49% 11,27% 16.220 4,32% 16.370 3,75% -0,92% 7 Renault CLIO MIO 1.952 2.345 2.075 -16,76% -5,93% 16.103 4,29% 22.164 5,08% -27,35% 8 Toyota ETIOS 2.196 1.805 1.997 21,66% 9,96% 15.678 4,18% 16.449 3,77% -4,69% 9 Volkswagen SURAN 1.961 2.449 1.630 -19,93% 20,31% 13.611 3,63% 16.264 3,73% -16,31% 10 Peugeot 208 1.717 2.185 630 -21,42% 172,54% 12.481 3,33% 16.604 3,81% -24,83% 11 Toyota COROLLA 1.666 1.743 1.491 -4,42% 11,74% 12.434 3,31% 11.674 2,68% 6,51% 12 Fiat SIENA 1.547 1.281 1.309 20,77% 18,18% 11.978 3,19% 12.004 2,75% -0,22% 13 Volkswagen UP 1.925 966 1.329 99,28% 44,85% 10.496 2,80% 2.143 0,49% 389,78% 14 Chevrolet ONIX 1.063 453 1.143 134,66% -7,00% 8.695 2,32% 6.626 1,52% 31,23% 15 Renault DUSTER 1.420 536 1.499 164,93% -5,27% 8.655 2,31% 11.597 2,66% -25,37% 16 Peugeot 308 893 1.156 553 -22,75% 61,48% 8.560 2,28% 12.742 2,92% -32,82% 17 Volkswagen VOYAGE 717 812 705 -11,70% 1,70% 7.181 1,91% 7.653 1,75% -6,17% 18 Chevrolet PRISMA 915 436 1.126 109,86% -18,74% 7.135 1,90% 6.028 1,38% 18,36% 19 Renault NUEVO SANDERO 1.624 1.101 N/D 47,50% 7.001 1,87% 0,00% N/D 20 Volkswagen FOX 766 1.012 667 -24,31% 14,84% 6.608 1,76% 6.679 1,53% -1,06% 21 Chevrolet SPIN 684 386 572 77,20% 19,58% 5.677 1,51% 4.799 1,10% 18,30% 22 Peugeot 207 728 1.361 614 -46,51% 18,57% 5.542 1,48% 9.562 2,19% -42,04% 23 Chevrolet AGILE 296 815 238 -63,68% 24,37% 5.397 1,44% 6.682 1,53% -19,23% 24 Chevrolet TRACKER 686 461 606 48,81% 13,20% 4.514 1,20% 3.841 0,88% 17,52% 25 Citroen C4 LOUNGE 668 600 562 11,33% 18,86% 4.496 1,20% 5.560 1,27% -19,14% 26 Volkswagen VENTO 491 392 548 25,26% -10,40% 4.286 1,14% 4.618 1,06% -7,19% 27 Citroen NUEVO C3 106 456 192 -76,75% -44,79% 4.005 1,07% 6.210 1,42% -35,51% 28 Renault NUEVO LOGAN 789 297 648 165,66% 21,76% 3.816 1,02% 7.590 1,74% -49,72% 29 Peugeot 408 502 364 362 37,91% 38,67% 3.794 1,01% 5.309 1,22% -28,54% 30 Fiat PUNTO 531 373 399 42,36% 33,08% 3.573 0,95% 5.961 1,37% -40,06% 31 Renault FLUENCE 599 1.068 575 -43,91% 4,17% 3.310 0,88% 4.939 1,13% -32,98% 32 Peugeot PARTNER 254 437 348 -41,88% -27,01% 3.203 0,85% 4.134 0,95% -22,52% 33 Fiat GRAND SIENA 327 391 360 -16,37% -9,17% 3.100 0,83% 5.274 1,21% -41,22% 34 Renault SANDERO 17 329 36 -94,83% -52,78% 2.792 0,74% 10.318 2,37% -72,94% 35 Volkswagen GOLF 483 352 N/D 37,22% 2.619 0,70% 7 0,00% 37314,29% 36 Fiat UNO 2010 205 314 166 -34,71% 23,49% 2.421 0,65% 4.747 1,09% -49,00% 37 Chevrolet CRUZE 263 324 330 -18,83% -20,30% 2.244 0,60% 3.114 0,71% -27,94% 38 Chery TIGGO 173 169 222 2,37% -22,07% 2.192 0,58% 1.287 0,30% 70,32% 39 Chevrolet CELTA 118 572 120 -79,37% -1,67% 2.172 0,58% 5.571 1,28% -61,01% 40 Renault KANGOO 304 443 259 -31,38% 17,37% 2.068 0,55% 2.866 0,66% -27,84% 41 Chevrolet SONIC 261 287 219 -9,06% 19,18% 2.045 0,54% 2.297 0,53% -10,97% 42 Nissan MARCH 271 146 277 85,62% -2,17% 1.894 0,50% 1.391 0,32% 36,16% 43 Honda HRV 401 617 N/D -35,01% 1.393 0,37% 0,00% N/D 44 Honda FIT 39 214 86 -81,78% -54,65% 1.377 0,37% 1.780 0,41% -22,64% 45 Fiat 500 133 155 117 -14,19% 13,68% 1.257 0,33% 1.853 0,42% -32,16% 46 Citroen C3 PICASSO 98 205 44 -52,20% 122,73% 1.093 0,29% 2.450 0,56% -55,39% 47 Nissan SENTRA 110 80 109 37,50% 0,92% 1.077 0,29% 90 0,02% 1096,67% 48 Nissan VERSA 139 171 119 -18,71% 16,81% 1.059 0,28% 1.018 0,23% 4,03% 49 Chery QQ 65 119 101 -45,38% -35,64% 1.053 0,28% 934 0,21% 12,74% 50 Citroen C3 356 2 144 17700,00% 147,22% 947 0,25% 17 0,00% 5470,59% 51 Otros 2.144 4.231 1.837 -49,33% 16,71% 19.670 5,24% 45.836 10,51% -57,09% Total 49.022 45.670 42.987 375.333 1 436.157 ene feb mar abr may jun jul ago sep oct nov Gama Grandes 0,19% 0,18% 0,27% 0,23% 0,33% 0,28% 0,21% 0,42% 0,38% Gama Medianos 18,86% 21,71% 22,59% 18,97% 18,12% 16,05% 18,43% 18,76% 18,76% Gama Pequenos 71,27% 69,31% 67,37% 69,92% 72,27% 75,81% 73,31% 71,37% 71,86% Monovolumen 6,98% 6,24% 7,23% 8,51% 7,19% 5,83% 5,13% 5,99% 6,29% Premium 0,09% 0,09% 0,09% 0,14% 0,09% 0,08% 0,06% 0,06% 0,06% SUV 2,61% 2,47% 2,45% 2,22% 2,00% 1,96% 2,86% 3,39% 2,65% 09/2015 Informe confidencial para uso exclusivo de los asociados Patentamientos por Ranking de Automoviles - Mercado Total Rank. Ranking Por Modelos - Automoviles 0,00% 10,00% 20,00% 30,00% 40,00% 50,00% 60,00% 70,00% 80,00% ene feb mar abr may jun jul ago sep oct nov dic Autos - Participacion por Segmento Gama Grandes Gama Medianos Gama Pequenos Monovolumen Premium SUV
- 4. Modelo sep/15 (a) sep/14 (b) ago/15 (c) Var a-b Var a-c Ac. 15 Part % Ac. 14 Part % Var 15-14 1 Toyota HILUX 3.025 2.408 2.545 25,62% 18,86% 21.456 21,10% 21.336 20,76% 0,56% 2 Ford RANGER 1.814 1.644 1.703 10,34% 6,52% 14.103 13,87% 12.999 12,65% 8,49% 3 Volkswagen AMAROK 2.004 1.417 1.839 41,43% 8,97% 14.029 13,80% 12.893 12,54% 8,81% 4 Renault KANGOO FURGON 1.315 951 1.284 38,28% 2,41% 11.374 11,19% 9.949 9,68% 14,32% 5 Volkswagen SAVEIRO 559 654 578 -14,53% -3,29% 6.561 6,45% 5.136 5,00% 27,75% 6 Peugeot PARTNER FURGON 454 725 476 -37,38% -4,62% 4.606 4,53% 6.321 6,15% -27,13% 7 Fiat STRADA 701 460 528 52,39% 32,77% 4.275 4,20% 6.514 6,34% -34,37% 8 Chevrolet S-10 620 345 548 79,71% 13,14% 4.194 4,12% 4.297 4,18% -2,40% 9 Mercedes Benz SPRINTER 447 385 479 16,10% -6,68% 3.869 3,80% 2.962 2,88% 30,62% 10 Fiat NUEVO FIORINO 631 391 509 61,38% 23,97% 3.743 3,68% 1.789 1,74% 109,22% 11 Citroen BERLINGO FURGON 319 157 455 103,18% -29,89% 3.346 3,29% 2.869 2,79% 16,63% 12 Iveco DAILY 213 247 204 -13,77% 4,41% 1.966 1,93% 1.658 1,61% 18,58% 13 Renault NUEVO MASTER 216 129 316 67,44% -31,65% 1.405 1,38% 2.074 2,02% -32,26% 14 Ram 1500 117 181 133 -35,36% -12,03% 1.135 1,12% 931 0,91% 21,91% 15 Hyundai H1 75 56 97 33,93% -22,68% 675 0,66% 174 0,17% 287,93% 16 Kia K2500 68 54 69 25,93% -1,45% 572 0,56% 316 0,31% 81,01% 17 Ford TRANSIT 30 57 56 -47,37% -46,43% 521 0,51% 454 0,44% 14,76% 18 Fiat DUCATO 108 107 59 0,93% 83,05% 507 0,50% 1.208 1,18% -58,03% 19 Renault KANGOO 66 48 75 37,50% -12,00% 499 0,49% 459 0,45% 8,71% 20 Citroen JUMPER 43 11 44 290,91% -2,27% 453 0,45% 267 0,26% 69,66% 21 Otros 300 586 254 -48,81% 18,11% 2.397 2,36% 8.180 7,96% -70,70% Total 13.125 11.013 12.251 101.686 1 102.786 Modelo sep/15 (a) sep/14 (b) ago/15 (c) Var a-b Var a-c Ac. 15 Part % Ac. 14 Part % Var 15-14 1 Iveco 170 E 210 273 117 -23,08% 79,49% 1.443 9,34% 1.579 10,15% -8,61% 2 Ford CARGO 1722 156 130 95 20,00% 64,21% 924 5,98% 1.311 8,43% -29,52% 3 Mercedes Benz 710 76 97 71 -21,65% 7,04% 736 4,76% 683 4,39% 7,76% 4 Mercedes Benz 1418 62 142 43 -56,34% 44,19% 648 4,19% 1.305 8,39% -50,34% 5 Ford F-4000 70 59 N/D 18,64% 563 3,64% 2 0,01% 28050,00% 6 Mercedes Benz 1618L 80 26 45 207,69% 77,78% 533 3,45% 406 2,61% 31,28% 7 Iveco 450 E 61 44 52 38,64% 17,31% 520 3,36% 624 4,01% -16,67% 8 Mercedes Benz ATRON 1634 36 65 31 -44,62% 16,13% 486 3,14% 497 3,20% -2,21% 9 Mercedes Benz ATEGO 1725 33 42 70 -21,43% -52,86% 466 3,02% 324 2,08% 43,83% 10 Mercedes Benz ATRON 1720 30 37 34 -18,92% -11,76% 435 2,81% 440 2,83% -1,14% 11 Volkswagen 17220 51 71 61 -28,17% -16,39% 431 2,79% 449 2,89% -4,01% 12 Volkswagen 17250 E 58 37 53 56,76% 9,43% 411 2,66% 228 1,47% 80,26% 13 Ford CARGO 915 E 61 54 32 12,96% 90,63% 329 2,13% 446 2,87% -26,23% 14 Iveco 490 S 36 18 23 100,00% 56,52% 286 1,85% 251 1,61% 13,94% 15 Scania P360 23 23 13 0,00% 76,92% 269 1,74% 214 1,38% 25,70% 16 Ford CARGO 1932 39 52 33 -25,00% 18,18% 267 1,73% 441 2,84% -39,46% 17 Mercedes Benz ATRON 1624 30 27 24 11,11% 25,00% 266 1,72% 256 1,65% 3,91% 18 Volkswagen 19320 20 26 25 -23,08% -20,00% 256 1,66% 166 1,07% 54,22% 19 Mercedes Benz AXOR 1933 25 46 29 -45,65% -13,79% 251 1,62% 233 1,50% 7,73% 20 Mercedes Benz O-500 24 18 23 33,33% 4,35% 251 1,62% 213 1,37% 17,84% 21 Otros 731 648 594 12,81% 23,06% 5.685 36,78% 5.484 35,26% 3,67% Total 1.912 1.876 1.527 15.456 1 15.552 Rank. Comercial Pesado 09/2015 Informe confidencial para uso exclusivo de los asociados Patentamientos por Ranking de Livianos y Pesados - Mercado Total Rank. Comercial Liviano
- 5. 09/2015 Informe confidencial para uso exclusivo de los asociados Patentamientos por Ranking de Livianos y Pesados - Mercado Total ene feb mar abr may jun jul ago sep oct nov Baja PU - Furgones 33,64% 35,13% 33,41% 37,82% 40,43% 37,37% 34,33% 32,91% 32,06% Furgon Mediano 7,46% 8,26% 7,27% 8,04% 9,23% 9,21% 9,87% 9,66% 8,36% Minibus 1,90% 1,73% 1,96% 1,94% 2,17% 1,88% 1,99% 1,87% 1,53% Pickups Medianas-Grandes 57,00% 54,88% 57,36% 52,20% 48,16% 51,53% 53,80% 55,56% 58,05% ene feb mar abr may jun jul ago sep oct nov Bus Larga Distancia 4,08% 2,46% 1,80% 1,66% 0,89% 2,59% 2,52% 2,75% 1,88% Bus Urbano 21,81% 15,81% 11,96% 14,15% 15,18% 9,24% 15,52% 13,56% 16,00% Camion Liviano 10,26% 14,54% 16,17% 15,99% 17,08% 16,87% 15,26% 15,91% 15,59% Camion Mediano 4,88% 5,40% 4,49% 4,00% 4,80% 5,13% 4,68% 5,30% 4,97% Camion Pesado 27,99% 28,12% 29,44% 28,54% 27,64% 30,76% 27,34% 28,29% 28,24% Camion Semipesado 29,48% 31,77% 34,69% 33,64% 33,16% 34,52% 33,81% 33,14% 32,48% Furgon Mediano 0,50% 0,40% 1,04% 1,48% 0,83% 0,73% 0,72% 0,98% 0,84% Minibus 1,00% 1,51% 0,41% 0,55% 0,42% 0,15% 0,15% 0,07% 0,00% 0,00% 10,00% 20,00% 30,00% 40,00% 50,00% 60,00% 70,00% ene feb mar abr may jun jul ago sep oct nov dic Comercial Liviano Baja PU - Furgones Furgon Mediano Minibus Pickups Medianas-Grandes 0,00% 5,00% 10,00% 15,00% 20,00% 25,00% 30,00% 35,00% 40,00% ene feb mar abr may jun jul ago sep oct nov dic Comercial Pesado Bus Larga Distancia Bus Urbano Camion Liviano Camion Mediano Camion Pesado Camion Semipesado Furgon Mediano Minibus
- 6. Distrito sep/15 (a) sep/14 (b) ago/15 (c) Var a-b Var a-c Ac. 15 Ac. 14 Var 15-14 sep/15 (a) sep/14 (b) ago/15 (c) Var a-b Var a-c Ac. 15 Ac. 14 Var 15-14 Ac. 15 Ac. 14 Var 15-14 Part % GRAN BUENOS AIRES 11.755 10.013 10.099 17,40% 16,40% 85.881 96.504 -11,01% 308 215 210 43,26% 46,67% 2.171 2.241 -3,12% 88.052 98.745 -10,83% 17,59% BUENOS AIRES 9.086 7.910 7.978 14,87% 13,89% 70.288 78.558 -10,53% 403 277 285 45,49% 41,40% 2.950 2.911 1,34% 73.238 81.469 -10,10% 14,63% CAPITAL FEDERAL 7.798 8.702 7.061 -10,39% 10,44% 63.004 82.237 -23,39% 613 793 459 -22,70% 33,55% 4.886 5.417 -9,80% 67.890 87.654 -22,55% 13,56% CORDOBA 5.746 5.637 5.270 1,93% 9,03% 45.909 53.863 -14,77% 280 174 231 60,92% 21,21% 1.976 1.690 16,92% 47.885 55.553 -13,80% 9,57% SANTA FE 5.045 4.955 4.624 1,82% 9,10% 39.589 44.868 -11,77% 255 226 207 12,83% 23,19% 2.198 1.847 19,00% 41.787 46.715 -10,55% 8,35% MENDOZA 2.383 2.470 2.050 -3,52% 16,24% 18.104 21.561 -16,03% 92 79 96 16,46% -4,17% 876 845 3,67% 18.980 22.406 -15,29% 3,79% ENTRE RIOS 1.677 1.520 1.619 10,33% 3,58% 13.579 14.678 -7,49% 95 100 68 -5,00% 39,71% 674 843 -20,05% 14.253 15.521 -8,17% 2,85% NEUQUEN 1.768 1.293 1.530 36,74% 15,56% 13.002 12.295 5,75% 135 162 148 -16,67% -8,78% 1.203 1.155 4,16% 14.205 13.450 5,61% 2,84% TUCUMAN 1.717 1.389 1.491 23,61% 15,16% 13.350 13.434 -0,63% 59 44 58 34,09% 1,72% 609 498 22,29% 13.959 13.932 0,19% 2,79% SALTA 1.635 1.219 1.386 34,13% 17,97% 11.713 11.354 3,16% 61 44 54 38,64% 12,96% 739 630 17,30% 12.452 11.984 3,91% 2,49% CHUBUT 1.480 1.282 1.276 15,44% 15,99% 11.392 11.929 -4,50% 66 102 90 -35,29% -26,67% 622 689 -9,72% 12.014 12.618 -4,79% 2,40% CORRIENTES 1.325 1.115 1.203 18,83% 10,14% 10.785 11.884 -9,25% 120 151 98 -20,53% 22,45% 983 971 1,24% 11.768 12.855 -8,46% 2,35% CHACO 1.352 1.063 1.297 27,19% 4,24% 10.272 9.817 4,63% 73 87 85 -16,09% -14,12% 657 673 -2,38% 10.929 10.490 4,18% 2,18% MISIONES 1.192 1.042 1.033 14,40% 15,39% 8.801 9.472 -7,08% 36 56 49 -35,71% -26,53% 417 392 6,38% 9.218 9.864 -6,55% 1,84% RIO NEGRO 1.134 894 988 26,85% 14,78% 8.461 8.696 -2,70% 46 12 32 283,33% 43,75% 270 164 64,63% 8.731 8.860 -1,46% 1,74% SANTA CRUZ 1.064 969 942 9,80% 12,95% 7.898 7.939 -0,52% 55 41 29 34,15% 89,66% 380 439 -13,44% 8.278 8.378 -1,19% 1,65% JUJUY 910 665 771 36,84% 18,03% 6.622 7.379 -10,26% 71 51 50 39,22% 42,00% 457 383 19,32% 7.079 7.762 -8,80% 1,41% SANTIAGO DEL ESTERO 713 650 685 9,69% 4,09% 5.741 6.293 -8,77% 41 35 30 17,14% 36,67% 280 310 -9,68% 6.021 6.603 -8,81% 1,20% TIERRA DEL FUEGO 810 773 740 4,79% 9,46% 5.721 5.607 2,03% 28 32 15 -12,50% 86,67% 206 163 26,38% 5.927 5.770 2,72% 1,18% FORMOSA 808 515 632 56,89% 27,85% 5.241 5.413 -3,18% 34 16 23 112,50% 47,83% 204 157 29,94% 5.445 5.570 -2,24% 1,09% SAN JUAN 660 642 635 2,80% 3,94% 5.123 6.226 -17,72% 33 23 29 43,48% 13,79% 251 186 34,95% 5.374 6.412 -16,19% 1,07% LA PAMPA 604 598 587 1,00% 2,90% 4.922 5.615 -12,34% 32 19 18 68,42% 77,78% 199 213 -6,57% 5.121 5.828 -12,13% 1,02% SAN LUIS 563 509 499 10,61% 12,83% 4.325 5.049 -14,34% 16 11 12 45,45% 33,33% 172 87 97,70% 4.497 5.136 -12,44% 0,90% CATAMARCA 539 514 476 4,86% 13,24% 4.268 4.688 -8,96% 25 8 9 212,50% 177,78% 121 88 37,50% 4.389 4.776 -8,10% 0,88% LA RIOJA 385 345 367 11,59% 4,90% 3.039 3.593 -15,42% 12 11 6 9,09% 100,00% 71 73 -2,74% 3.110 3.666 -15,17% 0,62% 09/2015 Informe confidencial para uso exclusivo de los asociados Patentamientos por Provincias y Tipos - Automovil+Comercial Liviano Comercial Pesado+Otros Pesados Mercado Total
- 7. 09/2015 Informe confidencial para uso exclusivo de los asociados Patentamientos por Provincias y Tipos - 500602 Total - Participacion por Region Centro 33,57% Cuyo 5,76% Metropolitana 31,15% NE 10,31% NO 9,39% Sur 9,82% Automovil - Participacion por Region Centro 33,65% Cuyo 5,78% Metropolitana 32,28% NE 9,83% NO 9,38% Sur 9,08% Comercial Liviano - Participacion por Region Centro 33,83% Cuyo 5,75% Metropolitana 27,27% NE 11,58% NO 9,38% Sur 12,18% Comercial Pesado e Otros Pesados - Participacion por Region Centro 31,07% Cuyo 5,51% Metropolitana 29,94% NE 12,45% NO 9,66% Sur 11,37% 33,57% 5,76% 31,15% 10,31% 9,39% 9,82% 0,00% 5,00% 10,00% 15,00% 20,00% 25,00% 30,00% 35,00% 40,00% Total - Participacion por Region 0,00% 5,00% 10,00% 15,00% 20,00% 25,00% 30,00% 35,00% 40,00% Automovil - Participacion por Region 0,00% 5,00% 10,00% 15,00% 20,00% 25,00% 30,00% 35,00% 40,00% Comercial Liviano - Participacion por Region 0,00% 5,00% 10,00% 15,00% 20,00% 25,00% 30,00% 35,00% Comercial Pesado e Otros Pesados - Participacion por Region