More Related Content
Similar to Chapter Ten Small Business Promotion Capturing the Eye of You.docx (20)
More from bartholomeocoombs (20)
Chapter Ten Small Business Promotion Capturing the Eye of You.docx
- 1. Chapter Ten
Small Business Promotion: Capturing the Eye of Your Market
Copyright 2021 © McGraw-Hill Education. All rights reserved.
No reproduction or distribution without the prior written
consent of McGraw-Hill Education.
Because learning changes everything.®
The Need for Promotion
To get people to buy, you need to make an impression.
Those with interest are sales leads and the most interested are
your prospects.
The marketing funnel shows how many prospective customers it
takes to find one who will make a purchase.
Access text alternative for this image.
© McGraw-Hill Education
‹#›
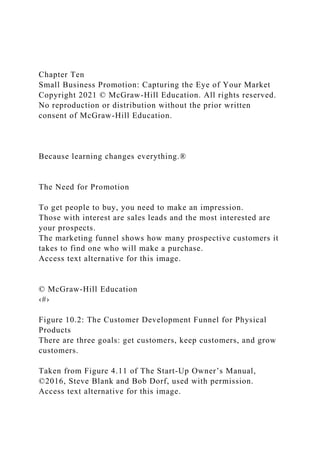
Figure 10.2: The Customer Development Funnel for Physical
Products
There are three goals: get customers, keep customers, and grow
customers.
Taken from Figure 4.11 of The Start-Up Owner’s Manual,
©2016, Steve Blank and Bob Dorf, used with permission.
Access text alternative for this image.
- 2. © McGraw-Hill Education
‹#›
Figure 10.3: The Customer Development Funnel for
Web/Mobile Products
This slightly different version of the funnel is for internet-based
businesses.
Taken from Figure 4.17 of The Start-Up Owner’s Manual,
©2016, Steve Blank and Bob Dorf, used with permission.
Access text alternative for this image.
© McGraw-Hill Education
‹#›
Promotion Using the PESO Model
Advertising is part of conveying your message to your
customers.
Paid media – you pay for ad placement.
Owned media – your website, newsletters, emails, signage, etc.
Shared media – called word-of-mouth or referral advertising.
Earned media – public relations and press relations, or “free
ink.”
Your promotional mix are techniques that will get you noticed.
Shared media embassies – your gateway to shared content.
Media partnerships – with companies, influencers, etc.
Media integration – where you develop contests, advertorials,
etc.
Incentive media – such as sponsorships, brand ambassadors, etc.
At the very center of the PESO model is where your brand and
your organizational identity fits, and where everything starts.
© McGraw-Hill Education
- 3. ‹#›
Figure 10.4: The PESO Model: A Hybrid Model of How to
Think about the Media Landscape
Source: Adapted from G. Dietrich, “The Four Different Types
of Media,” Spin Sucks, June 24, 2013.
Access text alternative for this image.
© McGraw-Hill Education
‹#›
The PESO Model: Your Brand
A brand may seem like the name a firm puts on itself and its
products, but it is more than that.
A brand message should project what the firm is about.
Your product/service will likely evolve, so your brand would
need to change to reflect this.
Think about what underlies your brand.
Your brand promise shows what your firm will do for the
customer.
Branding builds from the value proposition, your competitive
advantage, and what you want the firm to represent.
With small businesses, the entrepreneur is part of the brand.
As you develop your brand, you come to know yourself and
your business.
You can now start to build the business out into the media
landscape.
That starts with a focus on your owned media.
© McGraw-Hill Education
‹#›
- 4. The PESO Model: Owned Media
Organizational identity is your business/product/service name,
including logos, symbols, characters, slogans, hashtags,
uniforms, and packaging.
When picking a name, take care when using a personal name,
avoid copyright infringement, and allow for future growth.
Owned media: domain name, logo, phone line, business card,
brochures, sales packet/marketing kit, online support material,
sign, packaging, and promotional novelties – all with a succinct
message.
The overlap of owned and shared media are social media
embassies.
Your firm’s own branded page on different social media sites.
Includes the usual, but also business directory sites, user review
sites, catalogs, and sites like Amazon, eBay, Etsy, and others.
You can use a social media management platform or even pay a
customer, friend, or family member to keep an eye on the sites
for you.
© McGraw-Hill Education
‹#›
The PESO Model: Shared Media
Shared media is the ultimate form of free advertising.
Service providers get customers through referrals or word of
mouth.
Social media sites have the possibility of viral marketing.
Creating and leveraging hashtags increases the viral impact.
Where shared media and earned media overlap lie media
partnerships.
Potential partners include chambers of commerce, local business
organizations, trade or professional associations, and others.
Other forms of media partnerships include sponsorships, co-
branding, and co-marketing.
A key type of media partnership comes from influencers, either
- 5. macro- or micro-influencers.
Donations and community service are other forms of media
partnerships which can create publicity in a virtuous cycle.
© McGraw-Hill Education
‹#›
The PESO Model: Earned Media
Earned media occurs when others talk about your firm or
products in the media and you did not pay them directly for the
mentions, called free ink.
A key issue is how newsworthy your material is – it should have
public recognition, public importance, and public interest.
Media outlets offer a media kit of their publication schedule,
topics, etc.
Start-ups can use a business profit kit to share with the media,
or develop a press release using the AIDA formula.
Public relations create a favorable opinion of your firm.
Investor relations do the same for investors, advisers, mentors,
and companies with whom you may form important
relationships.
Media integration occurs where earned media and paid media
overlap.
Contests are a specific form of lead generation.
Another technique is placing advertorials.
© McGraw-Hill Education
‹#›
The PESO Model: Paid Media
Forms of paid media include: promotional video for building
awareness, audio, print for complex information, locational
promotion including OOH, and network advertising.
Advertising costs (CPM) ranging from least to most expensive:
- 6. online, out of house, radio, television, and print.
With online campaigns, measure goals using key performance
indicators (KPIs) and track your organic traffic.
Use search engine optimization (SEO), adding the best
keywords and description tags to your web pages.
The overlap between paid and owned media is incentive media.
The best known form is affiliate marketing.
Related to affiliates are brand ambassadors.
Other forms include native advertising, and a variation called
sponsored content.
© McGraw-Hill Education
‹#›
Developing Your Promotion Strategy
With so many promotional options, a plan is crucial.
In the marketing plan is a one-page overall strategy with a
detailed list of the goals, types of activities, and anticipated
outcomes of your plan.
These are the main components of your media content strategy
plan.
Include future promotional efforts, their schedule, platforms
you will use, your budget and costs, and how you will measure
success.
Start-ups should focus on brand and owned media, branching
out to shared media using social media embassies.
Look for opportunities for partnerships and earned media
through affiliates or influencers.
Experience will help you decide on types and amounts of media
integrations, paid media, and incentive media to use.
Getting the word out is the purpose of promotion.
© McGraw-Hill Education
‹#›
- 7. The Process of Personal Selling
Personal selling follows a general formula.
1. Prospect and evaluate.
2. Prepare by finding out what you can about the clients.
3. Present a logical and compelling argument for purchase.
4. Close the sale using one of a number of techniques
5. Follow up to avoid customer’s cognitive dissonance.
© McGraw-Hill Education
‹#›
Customer Retention: Keeping and Growing Customers after the
Sale
It costs five times as much to get a purchase from a new
customer compared to an existing one.
- 8. The general approach to keeping customers is customer
retention (CR) and there are three major elements to CR.
One is handling problems that crop up after a sale.
The second is customer relationship management (CRM), which
focuses on monitoring and promoting customer interest and
loyalty.
The third is growing customer sales, which builds from the
customer development model and lean business practices.
© McGraw-Hill Education
‹#›
Customer Retention: Handling Post-Sale Problems
The ultimate test of any business is how they handle adversity,
and complaints are the most frequent example of that ultimate
test.
Most dissatisfied customers do not report their dissatisfaction to
the company and a third report their dissatisfaction to others.
In reality, most complaints are justified, so use this four step
approach.
Prepare yourself and listen.
Accurately reflect.
Apologize and start generating solutions.
Implement and follow up.
The goal is an arrangement the customer thinks is fair.
Avoid using “company policy” as a reason for inaction.
Marketing is about sales and nothing generates cash like sales.
© McGraw-Hill Education
‹#›
Customer Retention: CRM in Two Steps
Step 1: Gathering the Data.
Gather performance and contact data from existing customers.
- 9. Examples of contact data:
Person, firm, source – unique ID, demographics and contact
information, firm information, and source.
Example of performance data:
Purchases, non-purchase events, follow-ups, follow-throughs.
Step 2: Analyzing the Data.
Customer vector reports.
Sales process reports.
Sales outcome reports.
The simplest, and most important analysis is sales by customer.
It is believed that 80 percent of sales come from 20 percent of
customers.
Identify those 20 percent and keep them happy.
© McGraw-Hill Education
‹#›
Customer Retention: Growing Customer Sales
Selling the same product to the same customers is market
penetration, while selling the same customers a new product is
product expansion.
When looking for new customers, you seek market expansion or
diversification if trying to sell them new products.
Access text alternative for this image.
Source: William O. Bearden, Thomas N. Ingram, and Raymond
W. Laforge, Marketing: Principles and Perspectives, 4th ed.
(Burr Ridge, IL: McGraw-Hill/ Irwin, 2004), p. 57.
© McGraw-Hill Education
‹#›
Customer Retention: Mechanics of Growing Customer Sales
Additional sales take four forms in the physical world.
- 10. To unbundle is to break a product/service into components.
Up-selling is selling accessories to higher-quality versions.
Cross-selling means to sell related products.
Referrals is a major way to grow sales.
In the online world, a next-sell is an attempt to prime customers
to make their next purchase.
© McGraw-Hill Education
‹#›
Sales Forecasting
One piece of the marketing efforts that feeds directly into your
financial projections, is knowing what your sales will be.
First, determine how many prospective customers you need.
A key issue in determining your number of customers is
assessing your hit rate or how many prospects it takes to make
one sale.
The next step is to estimate the average amount of sales per
customer.
Now create your sales forecast:
Prospective customers X Hit rate X Sale amount = Sales
forecast.
© McGraw-Hill Education
‹#›
End of main content.
Copyright 2021 © McGraw-Hill Education. All rights reserved.
No reproduction or distribution without the prior written
consent of McGraw-Hill Education.
Because learning changes everything.®
www.mheducation.com
- 11. 20
Accessibility Content: Text Alternatives for Images
© McGraw-Hill Education
‹#›
The Need for Promotion – Text Alternative
The graphic shows a funnel with you and your firm shown
above the top of the funnel. You use your value proposition,
your target market segments and the PESO model to gather one
thousand impressions going into the marketing funnel.
In the throat of the marketing funnel, those one thousand
impressions turn into two hundred leads and through personal
selling, into twenty prospects. Of the twenty prospects, you get
two sales. Due to customer retention efforts, you retain one
loyal customer.
Return to parent-slide containing image.
© McGraw-Hill Education
‹#›
Figure 10.2: The Customer Development Funnel for Physical
Products – Text Alternative
Rather than a traditional vertical funnel, this concept uses two
horizontal funnels joined in the middle at the narrow ends. The
funnel on the left is the “Get Customers” funnel and the funnel
on the right is the “Grow Customers” funnel. The section in the
middle is the “Keep Customers” section.
- 12. The left-hand, Get Customers funnel has inputs at the wide end
of earned and paid media. This passes through ever narrowing
bands of awareness, interest, consideration, and finally
purchase. The purchase feeds a viral loop back to awareness.
The right-hand funnel, Grow Customers, also consists of four
sections of ever narrowing bands, which are referrals, cross-
selling, up-selling, and un-bundling. The referrals section
provides a viral loop to the opposite funnel’s awareness section.
The section in the middle, where the two funnels meet is the
Keep Customers section and is comprised of customer
satisfaction surveys, loyalty programs, product updates, and
customer check-in-calls.
Return to parent-slide containing image.
© McGraw-Hill Education
‹#›
Figure 10.3: The Customer Development Funnel for
Web/Mobile Products – Text Alternative
This slightly different version of the customer development
funnel has the same three sections of Get Customers, Keep
Customers, and Grow Customers.
The left-hand funnel, Get Customers, again shows inputs of
earned and paid media but only consists of two narrowing
sections: acquire and activate. The activate section provides a
viral loop back to the acquire section.
The right-hand funnel, Grow Customers, consists of four ever-
narrowing sections with one section differing from the funnel
for physical products: referrals, cross-selling, next-selling
(differs), and up-selling. The referrals section provides a viral
loop to the opposite funnels acquire section.
The middle section of Keep Customers consists of: blogs, RSS,
emails; outreach programs; contests and events; product
updates; and loyalty programs.
Return to parent-slide containing image.
- 13. © McGraw-Hill Education
‹#›
Figure 10.4: The PESO Model: A Hybrid Model of How to
Think about the Media Landscape – Text Alternative
This Venn diagram consists of four factors: shared media,
earned media, paid media, and owned media. Where the four
intersect is the brand and brand promise.
Shared media consists of word-of-mouth mentions, social media
mentions, and hashtags. Earned media contains things like
media relations, media kits, press releases, public relations,
investor relations, and guerrilla marketing. Commercials and
ads, packaging, infomercials, product placements, search
results, sales, coupons, flyers, SEO, out-of-home ads,
newsletters, and e-books all comprise paid media. Finally,
owned media consists of names, domain names, websites, email,
direct mail, logos, business cards, phone lines, stationary,
brochures, flyers, signs, sales packets, online material, and
promotional novelties.
Where each of these sections overlap lie circumstances where
specific promotional opportunities await. Where shared media
and owned media overlap lie social media embassies, such as
company social media pages, business directory sites, user
review sites, catalogs, and Amazon, eBay, etc. Incentive media
lies where owned media and paid media overlap and consists of
affiliate marketing, brand ambassadors, native advertising, and
sponsored content. In the area where paid media and earned
media overlap lies media integration, such as contests and
sweepstakes, lead generation, and advertorials. Finally, the last
overlap between earned media and shared media are media
partnerships, such as trade or professional organization
memberships, local organization memberships, sponsorships,
co-branding, co-marketing, influencer marketing, donations, and
community service.
- 14. Return to parent-slide containing image.
© McGraw-Hill Education
‹#›
Customer Retention: Growing Customer Sales – Text
Alternative
This graph plots products as either the same or new on the
horizontal axis and markets, either same or new, on the vertical
axis. This results in four possible combinations.
If you offer the same products to the same customers, this is
market penetration. Offering new products to the same
customers is product expansion.
If you offer the same products to new markets, this is market
expansion and if offering new products to new markets, this is
diversification.
Return to parent-slide containing image.
© McGraw-Hill Education
‹#›
image2.jpg
image3.jpg
image4.jpg
image5.jpg
image6.jpg
image7.jpg
image8.jpg
image1.png
Chapter Nine
Small Business Marketing: Customers and Products
Copyright 2021 © McGraw-Hill Education. All rights reserved.
- 15. No reproduction or distribution without the prior written
consent of McGraw-Hill Education.
Because learning changes everything.®
The Marketing Process
Product, price, promotion, and placement are the 4 Ps of
marketing.
The customer development process focuses specifically on
meeting the needs of the customer, hopefully leading to a new
product/service.
The product development process perfects the product or the
innovation within the product.
Access text alternative for this image.
© McGraw-Hill Education
‹#›
Customer Roles
When you buy a product/service and use it yourself, you are the
end user, and the purchaser.
In organizations, a person or office is the purchaser for other
end users.
Yet another person may be the decision maker who determines
what will be bought for end users, then the purchaser places the
order.
For individuals or organizations, an additional role is the
influencers making suggestions/recommendations to people in
any of these roles.
Understand these roles to better understand your customers.
Use the roles to help map out the purchasing process.
- 16. Closely related to this is the idea of the customers’ budget
cycle, or for major purchases the capital budgeting cycle.
© McGraw-Hill Education
‹#›
Initial Customer Profiles
A customer profile starts with face-to-face interviews.
The goal is an unbiased sense of how customers think about the
issue your product/service helps resolve or improve.
Analyze results by looking at the customer job.
Identify their pains or the gains they wish they could achieve.
Find out how they deal with the pain or gain right now.
Locate where there is a possibility for something better.
What if interviews show customers are unresponsive to your
solution?
You can change or pivot your product/service to better fit the
customers’ pains and gains.
Or pivot your customer base to those willing to purchase your
product.
© McGraw-Hill Education
‹#›
Target Market
Target market is one of a set of nested terms for the market
sizes.
Total available market (TAM).
Serviceable available market (SAM).
Serviceable obtainable market (SOM).
Penetrated market (PM).
There can be more than one target market.
Access text alternative for this image.
- 17. © McGraw-Hill Education
‹#›
Target Market – The Target Customer
Ways to find your target customer.
Benefit matching – the closer customers’ needs/pains/gains
align with features of your product/service, the happier they
will be.
Long-term value (LTV) or customer lifetime value (CLV) – go
after the customer who will bring the most revenue and profit to
your firm.
Influencer impact – word of mouth or social media exposure can
lead to sales from customers you did not know to target.
Minimizing churn – keeping existing customers is more
valuable than finding new ones.
© McGraw-Hill Education
‹#›
Target Market – Finding First Customers
First customers are a key challenge for a start-up and though
sales for cash are good, there are other nonfinancial benefits.
Feedback.
Testimonials.
Sharing on their social media accounts.
Three ways to find first customers are:
Family and friends – they may not need or use the product.
Early adopters – likely to impulse buy but more difficult to find
them.
People in pain – they appreciate your product the most and
provide feedback but they are even harder to find.
Connecting with the people in pain is the most useful and may
be worth discounting, or giving away, your product to obtain a
- 18. chance at follow-up.
© McGraw-Hill Education
‹#›
Target Market – Thinking about Customer Service
Use outstanding customer service to convert customers into
fans.
Show interest in and concern for everyone in your business –
customers, employees, suppliers, and the community.
Go the extra mile for these people.
Take time to be nice to all these people.
Be honest and open in how you operate.
When mistakes are made, fix them.
Keep in mind the SERVICE acronym as a way to teach
employees what outstanding customer service entails.
Social, enthusiastic, responsible, vibrant, intelligent, courteous,
engaged.
© McGraw-Hill Education
‹#›
Segmenting Your Market
Most products/services work best with particular markets.
Successful entrepreneurs leverage this idea using market
segmentation to identify the best market(s) for their good or
service.
Segmenting divides the total market into manageable pieces.
Your target market is the segment(s) you select on which to
target your marketing efforts.
Geographic segmentation.
Demographic segmentation.
Benefit segmentation.
Psychographic segmentation.
- 19. Some companies have created specialized customer profiles
based on combinations; called predetermined market segments.
These commercial products can help you know more about your
customers, but they should not replace the knowledge you gain
on your own.
© McGraw-Hill Education
‹#›
A Segmentation Example
You live in Phoenix, are bilingual in English and Spanish, and
want to start a day-care with a bilingual focus.
You create a customer profile and find interest but are unsure
about where to locate the day-care center.
You’ve segmented your market to a life cycle position – parents
of small children – and want a location central to your
demographic.
Using the website
zipwho or
city-data, find the zip code with the biggest target
demographic in the area.
With your target zip code, go to
PRIZM to identify the five largest market segments
within a specific zip code.
The main reason for targeting a market segment is so you do not
waste effort and money targeting the wrong customers.
© McGraw-Hill Education
‹#›
Marketing Research
Marketing research can verify the size of the potential market.
- 20. It is where and how you get the facts to support your plan.
And the proof that your plan has a good chance of success.
Research falls into two major categories.
Primary research is gathered to answer a specific marketing
question.
Secondary research has already been gathered for another
reason, but can be just as useful.
© McGraw-Hill Education
‹#›
Primary Research
This information is extremely current, but can be costly – online
options are the most reasonably priced.
One method of obtaining primary research is observation, called
ethnographic research.
Another method is the focus group, either formal or informal.
Typically a survey is used when gathering information from
large numbers of people.
Surveys contain open- and closed-ended questions.
Scalar questions ask for a rating.
Dichotomous questions offer two choices for an answer.
Categorical questions offer predetermined categories.
Open-ended questions allow interviewees to answer any way
they wish.
© McGraw-Hill Education
‹#›
Secondary Research
The challenge is finding good data – gathered in an unbiased
way, reported fairly, and from a reputable source.
Supplement commercial databases with free databases.
Market size is typically given as either the number of people in
- 21. a market or the number of businesses in the industry.
The easiest way to find selling prices is online.
Profitability for specific stores is nearly impossible to find, but
industry standards for profitability are easier to find.
© McGraw-Hill Education
‹#›
The Basics: Crafting Your Value Proposition
The relation of product or company capabilities to customer
pains and gains is the value proposition.
The challenge is to boil down those multiple items to one short
value proposition mantra that describes the benefit you offer
your customer.
To get your value proposition mantra, list those needs only you
meet and look for a way to draw a commonality from among
them.
You can use a short mantra, such as “We help X do Y by doing
Z.”
Or use a longer version including your competitive advantage.
The final goal for developing and testing your value proposition
is how it stacks up against other offerings available to
customers.
© McGraw-Hill Education
‹#›
Planning for Marketing
The goal is to create the specifics of the marketing strategy you
will use to generate sales for your business.
Marketing is one of the building blocks for your business plan,
it cannot be set in concrete.
In preparing the marketing section of the business plan, you will
be doing most of the work for a stand-alone marketing plan.
- 22. For start-ups, a marketing plan helps a firm build its brand and
relationship with customers.
You can get help creating a marketing plan at the SBA or
SCORE.
© McGraw-Hill Education
‹#›
Product: Goods versus Services
A product is anything offered to satisfy consumers including
goods, services, people, and ideas.
A car has tangibility, but its warranty and service plans are
intangible.
Perishability of services is an issue – a cab ride is an example
of the inseparability of services.
While products are generally consistent, services show
heterogeneity.
Some combinations fall between pure goods and pure services.
Access text alternative for this image.
© McGraw-Hill Education
‹#›
Product: The Total Product Approach
In marketing, the total product includes the entire bundle of
products and services you offer.
The total product is how your customers describe your
good/service.
What you describe as your good/service is the augmented
product and has features that differentiate it from competitors.
Underneath both of these lie the core product, which is a basic
description of what your company does.
Why is the total product important for small business owners?
- 23. Your consumers see your product as more than the core
component.
Using the total product approach allows you to find the most
cost-effective “bundle” of value and cost benefits for your
target market.
© McGraw-Hill Education
‹#›
Product: New Product Development Process
Developing a simple me-too product may only take hours and
steps may be skipped. Regardless of the pace, this is a
necessary process.
Use prototypes to further consumer testing.
Commercialization is the process of making the new product
available to consumers.
Access text alternative for this image.
© McGraw-Hill Education
‹#›
Product Life Cycle
Not all products survive the introduction phase.
Acceptance of the product increases rapidly in the growth
phase.
As growth slows, products enter the maturity phase.
Sales and profits fall during the decline phase.
Access text alternative for this image.
© McGraw-Hill Education
‹#›
- 24. Service Life Cycle
Services go through the same four stages, but it is easier to
extend the life cycle and eliminate the decline stage.
On-the-run changes mean your service starts a new life cycle
with each tweak of its offering.
Access text alternative for this image.
© McGraw-Hill Education
‹#›
Using the Product Life Cycle
The product life cycle shares challenges with firm or industry
life cycles.
It is hard to know exactly where in a cycle a product/service
might be.
You must be aware of the product cycle and consider where
your product might be and what that means.
You should understand that the determination can be imperfect
and unpredictable.
Knowing where your product stands in the life cycle gives you a
way to think about your product, customers, and competition.
© McGraw-Hill Education
‹#›
End of main content.
Copyright 2021 © McGraw-Hill Education. All rights reserved.
No reproduction or distribution without the prior written
consent of McGraw-Hill Education.
Because learning changes everything.®
- 25. www.mheducation.com
Accessibility Content: Text Alternatives for Images
© McGraw-Hill Education
‹#›
The Marketing Process – Text Alternative
The graphic depicts the marketing process in a two step flow
chart.
The first step is connecting your customer to your product or
service through the value proposition.
The second step applies the value proposition to the mechanics
of making the connection through the four Ps of marketing
(product, price, promotion, placement) which leads to the
generation of sales.
Return to parent-slide containing image.
© McGraw-Hill Education
‹#›
Target Market – Text Alternative
The nested circles of this image portray the many types of target
markets.
The largest circle is the total available market or TAM, which
represents everyone who might consider the product or service
you are offering.
The next largest circle which lies within your TAM is the
serviceable available market or SAM. This represents
customers within your geographic reach. If you depend on local
- 26. traffic, it could be your neighborhood. If you are online, it
could be as large as your TAM.
The next largest circle lies within your SAM and is the
serviceable obtainable market or SOM. This is also called your
target market and represents customers you think would be
interested in your product/service.
The final circle lies within your SOM and is your penetrated
market, or PM. This is your actual number of customers
divided by the target market to give you a percentage of the
market your firm has attained.
Return to parent-slide containing image.
© McGraw-Hill Education
‹#›
Product: Goods versus Services – Text Alternative
The goods-services continuum begins with pure goods on the
left end of the continuum and pure service on the opposite end
of the continuum.
The middle of the continuum shows three positions. The
position nearer to the pure goods end of the continuum is
considered a good-dominated product. The position nearer the
pure service end of the continuum is considered a service-
dominated product.
The middle of the continuum contains hybrids of both a product
and a service.
Return to parent-slide containing image.
© McGraw-Hill Education
‹#›
Product: New Product Development Process – Text Alternative
There are five steps in the new product development process.
- 27. The first step is idea generation/source of business ideas which
include end users, customers, salespeople, marketing research,
and competitors.
The second step is idea screening for business potential, in
which you are looking for objective fit, return on investment
(ROI) standard, product fit, and market trends.
The third step is idea evaluation/feasibility study and includes
concept testing and business analysis.
The fourth step in the process is product development, including
prototypes and test markets.
The fifth, and final step is commercialization or bringing the
product/service to market and encompasses such things as a
marketing plan, production, and market introduction.
Return to parent-slide containing image.
© McGraw-Hill Education
‹#›
Product Life Cycle – Text Alternative
This line graph plots dollars on the vertical axis and time on the
horizontal axis. The graph is broken into four stages:
introduction, growth, maturity, and decline. Sales are plotted in
a blue line and below that, but generally mirroring the sales
line, is the line depicting profits.
The sales line starts at zero at the beginning of the introduction
stage and increases slowly until it reaches the growth stage.
Here, sales increase sharply until the maturity stage where sales
peak and start to decline. Sales in the decline stage continue to
slowly taper off.
The second line on the graph is the line depicting profits.
Profits start below zero due to start up costs and breaks-even
and begins making profits as the product is leaving the
introduction stage. Profits continue to grow during the growth
stage and peak during the maturity stage. During the decline
stage, profits fall at a faster rate than sales.
- 28. Return to parent-slide containing image.
© McGraw-Hill Education
‹#›
Service Life Cycle – Text Alternative
This line graph depicts sales on the vertical axis and time on the
horizontal axis.
As the service is first introduced, it includes the initial service
bundle of offerings. As soon as sales peak and start to decline,
incremental changes are made to the service and it begins the
cycle anew, starting at the bottom of the sales scale. Then as
sales increase and peak for the second time and begin to fall,
another incremental change is applied and the process starts
again at the bottom of the sales scale. Sales peak for a third
and fourth time, each time with incremental changes made to
make the process begin again.
The graph ends up having four slightly s-shaped lines.
Return to parent-slide containing image.
© McGraw-Hill Education
‹#›
image2.jpg
image3.jpg
image4.jpg
image5.jpg
image6.jpg
image7.jpg
image8.jpg
image1.png