1. Oppenheimer Asset Management Inc. 200 Park Avenue New York, NY 10166 Tel: 800-221-5588 Fax: 212-667-4959
INVESTMENT STRATEGY and RESEARCH
A division of Oppenheimer Asset Management Inc.
Brian G. Belski
Chief Investment Strategist
(212) 667-5961
brian.belski@opco.com
Nicholas Roccanova, CFA
Senior Investment Strategist
(212) 667-5960
nicholas.roccanova@opco.com
Mira Borisova, CFA
Investment Strategist
(212) 667-6364
mira.borisova@opco.com
INVESTMENT STRATEGY US Strategy Weekly
Finding Value within Value
Value remains fundamentally attractive and timely
Our work shows that value tends to incrementally outperform growth for up to
three years following a broader market trough. Right now, we are 20 months into
this cycle, so there should be plenty of time for value to outperform. But the
reason we would urge investors to consider value strategies now is not only that
historical performance patterns favor them at this point, but also that we believe
value is better positioned than growth from a fundamental perspective.
Value offers more growth for the money than growth does
Over the past several quarters, value companies as a group have actually had
more EPS growth potential than “growth” companies and this is expected to
continue in coming quarters, based on current estimates. This is important
because value companies have historically delivered much less EPS growth than
growth companies. In addition, value companies are trading at a significant
markdown compared to their growth partners, with current multiples displaying a
13% discount versus their 9% discount norm.
The search for value companies is not just about valuation
Yes, valuation is an important variable in determining value propositions.
However, we tend to include a diversified set of fundamental virtues when
searching for value companies, including positive absolute earnings and earnings
growth, historically low debt to equity and book value, and an earnings yield
greater than the 10-year Treasury yield.
Mid caps, Discretionary and Industrials screen best for value
According to our screening characteristics, mid cap stocks represent the sweet
spot in terms of number of possibilities. In fact, stocks within the $1-$5 billion
capitalization range represent nearly half the entire screen. With respect to
sectors, Discretionary and Industrials currently have the most individual stocks
that fit the screen in comparison to the rest of the sectors. We list 52 of the best
examples in Table 1.
Please note that our next US Strategy Weekly will be published on
November 29. To all of our US readers, Happy Thanksgiving!
November 15, 2010
US Strategy – Recommended S&P 500 Sector
Weightings
Sector Opinion %Weight
Consumer Discretionary OW 12%
Consumer Staples MW 11%
Energy MW 11%
Financials MW 15%
Health Care MW 11.5%
Industrials OW 12%
Information Technology OW 20%
Materials MW 3.5%
Telecom Services UW 2%
Utilities UW 2%
Source: Oppenheimer Asset Management Investment Strategy
Group
Key: Opinion: Investment Strategy Sector Opinion.
UW: Underweight
MW: Market Weight
OW: Overweight
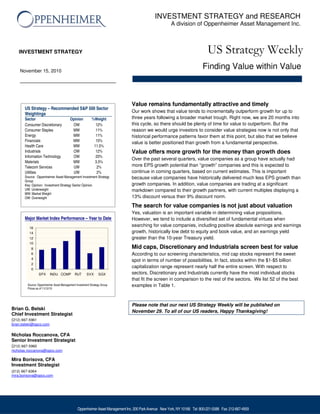
Major Market Index Performance – Year to Date
0
2
4
6
8
10
12
14
16
SPX INDU COMP RUT SVX SGX
Source: Oppenheimer Asset Management Investment Strategy Group
Prices as of 11/12/10
2. 2
Finding value within value
We still like value despite the rebound in the market
For the past several months we have been highlighting our preference for value
strategies, since, according to our analysis, these strategies tend to outperform
growth strategies at this stage of the market cycle. We have long found that
following a broader market trough, value tends to incrementally outperform
growth for up to three years (see, e.g., US Strategy Weekly, “Stockpickers
Capitalize on Recent Strength,” dated 10/11/10, pp. 3-4). Right now, we are 20
months into this market cycle, which suggests there is plenty of time for value to
outperform. However, as the market has rebounded sharply from its 2010 low in
August, many investors seem to have abandoned the value approach, and
value’s relative performance has plummeted (Chart 1). For our part, we would
urge investors to revisit value strategies not only because historical performance
patterns favor them, but also because we believe value is better positioned than
growth from a fundamental perspective. Based on our analysis:
• Value multiples are at a discount to historical averages – true, forward
P/E multiples for value are typically below those for growth, but current
levels are at an even larger than normal discount. As Chart 2 illustrates,
value multiples, which have averaged about a 9% discount to growth, are
now at a 13% discount.
• Value companies are the ones delivering growth – over the past several
quarters, EPS growth for value companies has been considerably higher
and is expected to continue outpacing growth in coming quarters, based on
current estimates (Chart 3). This is new and important because value
companies have historically delivered much less EPS growth than growth
companies.
Chart 1: Value Stocks Have Suffered in the Past Two Months
Source: OAM Investment Strategy Group
Chart 2: Value Trades at a Discount to Historical Norms Chart 3: Value – Not Growth – Has Been Delivering the EPS Growth
Relative NTM PE - S&P 1500 Value vs Growth
0.6
0.7
0.8
0.9
1.0
1.1
6/1995 6/1998 6/2001 6/2004 6/2007 6/2010
Quarterly EPS Growth YoY Chg
S&P 1500 Value Minus Growth
-80%
-60%
-40%
-20%
0%
20%
40%
60%
80%
1996/2C 1999/2C 2002/2C 2005/2C 2008/2C 2011/2c
Source: OAM Investment Strategy Group Source: OAM Investment Strategy Group
INVESTMENT STRATEGY
3. 3
What we look for in value stocks
Our approach to identifying value opportunities is more than searching for stocks
trading at below-average multiples. We try to indentify good companies trading at
reasonable valuations. Plenty of companies have what appear to be attractive
valuations but on closer examination turn out to have poor fundamentals. For our
part, when we try to identify value opportunities, we tend to focus on stocks
exhibiting the following characteristics: positive absolute earnings and earnings
growth, historically low debt to equity and book value, and an earnings yield
greater than 10-year Treasury yields. To find the stocks listed in Table 1, we
screened the S&P 1500 based on the following parameters (average score in
Chart 4) and then ranked the stocks in order of preference.
• No losses within the past five years
• Total debt less than equity
• Price to book less than the market
• Dividend yield of 1% or greater
• Forward earnings yield at least twice the 10-year Treasury yield
• Double digit expected EPS growth for the next two fiscal years
Table 1: Screening for Value Opportunities
Ticker Company Price OpCo Rating* Rank
BWS Brown Shoe Co. Inc. $12.10 NR 1
BGG Briggs & Stratton Corp. $17.75 NR 2
FL Foot Locker Inc $16.17 NR 3
CBS CBS Corp (Cl B) $16.62 NR 4
MET MetLife Inc. $39.64 NR 5
MUR Murphy Oil Corp. $66.55 O 6
ACI Arch Coal Inc. $29.10 NR 7
OXY Occidental Petroleum Corp. $87.46 O 8
AMP Ameriprise Financial Inc. $52.93 NR 9
STBA S&T Bancorp Inc. $20.77 NR 10
XRX Xerox Corp. $11.29 NR 11
MWV MeadWestvaco Corp. $25.80 NR 12
MDP Meredith Corp. $33.71 NR 13
CPO Corn Products International Inc. $43.06 NR 14
FMER FirstMerit Corp. $18.35 P 15
IVZ INVESCO Ltd. $22.13 NR 16
ETN Eaton Corp. $94.26 P 17
TKR Timken Co. $43.12 NR 18
TWX Time Warner Inc. $30.74 NR 19
AFL AFLAC Inc. $54.65 NR 20
TYC Tyco International Ltd. $37.77 NR 21
SWK Stanley Black & Decker Inc. $60.88 NR 22
ASH Ashland Inc. $51.87 NR 23
KMT Kennametal Inc. $33.85 NR 24
FRED Fred's Inc. $12.31 NR 25
THO Thor Industries Inc. $33.19 NR 26
RBC Regal-Beloit Corp. $55.29 O 27
LOW Lowe's Cos. $21.69 O 28
PNR Pentair Inc. $32.82 P 29
JCI Johnson Controls Inc. $36.45 NR 30
CASY Casey's General Stores Inc. $39.75 NR 31
CME CME Group Inc. (Cl A) $289.22 NR 32
EPIQ EPIQ Systems Inc. $12.38 NR 33
BMS Bemis Co. Inc. $30.31 NR 34
SEE Sealed Air Corp. $22.52 NR 35
Chart 4: Stock Screen Summary Statistics – Simple
Average
1.8
2.0
6.3
7.3
37.0
45.1
0 20 40 60
Price to Book
Dividend Yield
Free Cash Flow Yield
Forw ard Earnings
Yield
FY1 & FY2 Blended
Grow th
Debt to Equity
Source: OAM Investment Strategy Group
INVESTMENT STRATEGY
4. 4
Table 1 (continued): Screening for Value Opportunities
Ticker Company Price OpCo Rating* Rank
SPLS Staples Inc. $20.28 O 36
B Barnes Group Inc. $19.23 O 37
HUB.B Hubbell Inc. (Cl B) $55.40 O 38
DOV Dover Corp. $54.62 NR 39
GPC Genuine Parts Co. $47.10 NR 40
RSH RadioShack Corp. $20.16 P 41
NAFC Nash Finch Co. $43.05 NR 42
MLI Mueller Industries Inc. $29.88 NR 43
NSC Norfolk Southern Corp. $60.96 NR 44
FO Fortune Brands Inc. $58.60 NR 45
WTS Watts Water Technologies Inc. $32.83 P 46
HD Home Depot Inc. $31.44 O 47
UNP Union Pacific Corp. $90.29 NR 48
CSX CSX Corp. $60.85 NR 49
SYK Stryker Corp. $51.59 O 50
COST Costco Wholesale Corp. $65.20 NR 51
PKI PerkinElmer Inc. $23.94 NR 52
Source: Oppenheimer Asset Management Investment Strategy Group. Prices as of 11/12/10
*Rating Key, according to Oppenheimer & Co. Inc. Equity Research: O: Outperform, P: Perform, U: Underperform, NR: Not rated by
Oppenheimer & Co. Inc. Equity Research
Opportunities in mid caps, Discretionary and Industrials
The charts below illustrate the number of screened stocks by sector and market
capitalization. As you can see from Chart 5, Consumer Discretionary and
Industrials appear to screen very well based on our methodology, with select
opportunities also available in most other sectors. In addition, it appears that mid
cap stocks (Chart 6) represent the sweet spot for this screen, as stocks within the
$1-$5 billion capitalization range represent nearly half the entire screen.
Chart 5: Discretionary and Industrials Screened Well… Chart 6: …as Did Mid Cap Stocks
# of Screened Stocks By Sector
0
2
4
6
8
10
12
14
16
COND CONS ENRS FINL HLTH INDU INFT MATR
# of Screened Stocks By Capitalization
0
5
10
15
20
25
< $1b $1b - $5b $5b - $10b $10b - $20b > $20b
Source: OAM Investment Strategy Group Source: OAM Investment Strategy Group
INVESTMENT STRATEGY
5. 5
Performance Statistics
Major US Indices
Index 1W 1M 3M 6M 12M YTD
DJ Industrial Average -1.4 1.7 9.5 6.2 10.6 8.2
DJ Transportation -2.4 1.6 14.4 7.1 22.1 17.3
DJ Utilities -1.3 -0.3 4.3 6.5 9.1 1.6
NASDAQ 100 -2.2 3.9 17.5 12.1 20.6 14.9
NASDAQ Composite -2.4 3.2 15.9 7.3 17.2 11.0
Russell 1000 -2.1 2.0 11.7 5.8 11.4 8.3
Russell 1000 Growth -2.0 2.9 14.2 8.4 13.5 9.6
Russell 1000 Value -2.2 1.0 9.3 3.3 9.5 7.1
Russell 2000 -2.4 1.8 18.0 3.6 23.9 15.0
S&P 500 -2.2 1.8 11.1 5.6 10.3 7.5
S&P 500/Citigroup Growth -2.2 2.7 13.5 8.6 11.5 8.6
S&P 500/Citigroup Value -2.3 0.6 8.5 2.4 8.8 6.2
S&P Mid Cap 400 -2.0 2.6 14.9 6.9 22.0 16.1
S&P Small Cap 600 -2.0 2.2 17.4 3.0 24.5 15.2
Source: Oppenheimer Asset Management Investment Strategy Group, Prices as of 11/12/10
S&P 500 GICS Sectors
Sector 1W 1M 3M 6M 12M YTD
Consumer Discretionary -1.3 4.4 17.2 9.1 26.3 20.7
Consumer Staples -1.3 0.7 7.4 5.7 8.3 8.2
Energy 1.0 6.4 17.5 11.6 8.6 9.2
Financials -4.0 0.5 6.3 -2.7 1.7 3.7
Health Care -1.7 -0.7 6.3 3.3 3.9 -1.2
Industrials -3.1 -1.0 9.8 2.8 17.2 15.0
Information Technology -3.2 3.3 15.7 7.2 11.1 5.7
Materials -2.2 2.2 16.1 15.1 14.1 10.0
Telecommunications Services -2.1 0.7 8.2 16.0 15.2 6.3
Utilities -2.6 -2.0 2.2 4.7 7.6 0.2
Source: Oppenheimer Asset Management Investment Strategy Group, Prices as of 11/12/10
S&P 500 - Top & Bottom 10 Performing Industries, Trailing Week
Top 10 1W 1M 3M 6M 12M YTD
Oil Gas & Consumable Fuels 1.2 5.6 15.8 10.3 6.8 7.5
Wireless Telecommunications Services 1.1 -2.3 6.4 13.8 36.4 19.7
Diversified Consumer Services 1.0 -16.7 -5.3 -27.3 -30.2 -37.9
Gas Utilities 0.0 2.9 9.5 3.3 10.5 8.5
Energy Equipment & Services -0.1 10.0 26.9 18.6 18.1 18.2
Beverages -0.1 1.8 6.8 9.2 12.2 11.1
Automobiles -0.2 16.5 32.9 28.9 84.3 57.4
Health Care Providers & Services -0.2 4.7 13.8 7.3 13.7 7.8
Real Estate Management & Development -0.2 -0.6 22.6 23.9 86.6 45.9
Construction & Engineering -0.7 -0.4 12.5 -4.9 6.3 9.0
Bottom 10 1W 1M 3M 6M 12M YTD
Communications Equipment -9.4 -4.9 6.7 -1.9 -3.7 -5.4
Aerospace & Defense -5.3 -1.3 5.5 -3.5 11.7 7.0
Office Electronics -5.1 1.9 25.3 12.7 43.8 33.5
Real Estate Investment Trusts -5.1 -0.4 8.9 9.5 33.5 23.2
Commercial Banks -4.8 4.1 5.1 -13.7 4.8 7.7
Airlines -4.4 4.5 18.9 6.1 49.8 18.6
Capital Markets -4.2 4.4 11.4 4.5 -4.3 -2.2
Construction Materials -4.1 11.4 6.1 -23.1 -14.7 -22.8
Insurance -4.1 -1.7 6.8 3.1 8.9 9.1
Independent Power Producers & Energy Traders -3.6 -9.2 -1.0 -8.7 -14.6 -18.4
Source: Oppenheimer Asset Management Investment Strategy Group, Prices as of 11/12/10
Recent US Strategy Topics
Date US Strategy Weekly
11/8/2010 Repositioning Industrials
11/1/2010 Upgrading Energy to Market Weight
10/25/2010 Midterm Elections and the Market
10/18/2010 Stockpickers Capitalize on Recent Strength
10/11/2010 Stocks Are Still a Viable Investment
10/4/2010 Discussing the Impact of Additional QE
9/27/2010 Not All Beta is Created Equal
9/20/2010 Notes from the Road: Earnings Revisions
9/7/2010 Tempering Our Tone, But We Remain Bullish
8/23/2010 This Remains a Value Oriented Market
8/16/2010 What’s Wrong With Technology?
8/9/2010 2Q10 Earnings Update
8/2/2010 Still Overweight Discretionary
7/26/2010 Are We Range Bound?
7/19/2010 Sentiment Extremes and Market Performance
7/12/2010 Don’t Miss the End of the Buyers Strike
6/28/2010 Reviewing our 2010 Investment Themes
6/21/2010 Dividends and Buybacks Are Increasing
6/14/2010 Pictures to Ponder
6/7/2010 Easing the Anxiety Aids the Recovery
5/24/2010 The Bear Finally Growls
5/17/2010 Leading Indicators Are Not Peaking
5/10/2010 The US is a Cure for the Greek Tragedy
5/03/2010 The Great Valuation Debate
4/26/2010 Don’t Forget About Dividends
4/19/2010 Our Thoughts on Small Cap Outperformance
4/12/2010 Sector Changes: OK to Get More Cyclical
4/5/2010 Reluctant Bull Market Still Charging Ahead
3/29/2010 Strategies for A Stock Pickers Market
3/15/2010 This Is Still A Stock Pickers Market
3/8/2010 Investment Reluctance Can Be Very Costly
3/1/2010 Market Poised for M&A Revival
2/22/2010 Homebuilder Bounce Still Early
2/16/2010 Tech Off to a Slow Start
2/8/2010 Revisiting Dividend Strategies
2/1/2010 Risks to Our Market Outlook
1/25/2010 Time to Move From Bonds Into Stocks
1/19/2010 Maintaining Our Value Preference
1/11/2010 So What if the Fed Raises Rates?
1/4/2010 A Differentiated Bull in 2010
12/14/2009 Anatomy of a Bull Market
11/30/2009 Q3 Earnings Review
11/16/2009 Consumer Discretionary Selectivity
11/9/2009 Preparing Portfolios for Economic Growth
11/2/2009 Don’t Fret About Job Losses or the Fed
10/26/2009 Our Thoughts on the Recent Gold Rush
US Strategy Special Report
5/27/2010 Reactions Create Opportunities
5/24/2010 Fear Factor, Russian Redux?
12/7/2009 2010 Market Outlook
US Strategy Monthly
10/6/2010 October Chartbook
INVESTMENT STRATEGY
6. 6
Important Disclosures and Certifications
The research provided in this report is based on strategic analysis provided by Oppenheimer Asset Management Inc., a nonmember
affiliate of Oppenheimer & Co. Inc. Strategic analysis is based on fundamental, macroeconomic and quantitative data to provide
investment analysis with respect to U.S. securities markets. Strategic analysis may offer a view that is inconsistent with technical
analysis generated by Oppenheimer Asset Management Inc. The author of this report also provides model portfolios to Oppenheimer
Asset Management Inc. Securities mentioned in these reports may or may not be included in such model portfolios. The report is not
intended to provide personal investment advice.
Securities and other financial instruments discussed in this report or recommended or sold by Oppenheimer & Co. Inc. are not insured
by the Federal Deposit Insurance Corporate and are not deposits or obligations of any insured depositary institution. Investments involve
numerous risks including market risk, counterparty default risk and liquidity risk. Securities and other financial investments at times may
be difficult to value or sell. The value of financial instruments may fluctuate, and investors may lose their entire principal investment.
Analyst Certification - The author certifies that this research report accurately states his/her personal views about the
subject securities, which are reflected in the substance of this report. The author certifies that no part of his/her
compensation was, is, or will be directly or indirectly related to the specific recommendations or views contained in this
research report.
Potential Conflicts of Interest:
Strategic analysts employed by Oppenheimer Asset Management Inc. are compensated from revenues generated by the
firm. Oppenheimer Asset Management Inc. generally prohibits any research analyst and any member of his or her
household from executing trades in the securities of a company that such research analyst covers. Additionally,
Oppenheimer Asset Management Inc. generally prohibits any research analyst from serving as an officer, director or
advisory board member of a company that such analyst covers. In addition to 1% ownership positions in covered
companies that are required to be specifically disclosed in this report, Oppenheimer & Co. Inc. may have a long position of
less than 1% or a short position or deal as principal in the securities discussed herein, related securities or in options,
futures or other derivative instruments based thereon. Recipients of this report are advised that any or all of the foregoing
arrangements, as well as more specific disclosures set forth below, may at times give rise to potential conflicts of interest.
Third Party Research Disclosure
Oppenheimer & Co. Inc. has a research sharing agreement with Oppenheimer Asset Management Inc. to provide
third-party research services to Oppenheimer & Co. Inc. customers. Oppenheimer & Co. Inc. does not guarantee that the
information supplied is accurate, complete or timely, nor does Oppenheimer & Co. Inc. make any warranties with regard to
the research product or the results obtained from its use. Oppenheimer & Co. Inc. has no control over or input with respect
to Oppenheimer Asset Management Inc. research opinions. Oppenheimer Asset Management Inc. is a non-member
affiliate of Oppenheimer & Co. Inc.
Company Specific Disclosures
Oppenheimer & Co. Inc. expects to receive or intends to seek compensation for investment banking services in the next 3
months from MET.
In the past 12 months Oppenheimer & Co. Inc. has received compensation for investment banking services from MET.
Oppenheimer & Co. Inc. makes a market in the securities of FMER, FRED, CASY, SPLS, COST, and STBA.
Other Disclosures
This report is issued and approved by Oppenheimer Asset Management Inc, a registered investment advisor, to its affiliate
INVESTMENT STRATEGY