(ANIKA) Budhwar Peth Call Girls Just Call 7001035870 [ Cash on Delivery ] Pun...
Liquidity, investment style, and the relation between fund size and fund performance(7)
1. 8/4/2008-1112–JFQA #43:3 Yan Page 741
JOURNAL OF FINANCIAL AND QUANTITATIVE ANALYSIS Vol. 43, No. 3, Sept. 2008, pp. 741–768
COPYRIGHT 2008, MICHAEL G. FOSTER SCHOOL OF BUSINESS, UNIVERSITY OF WASHINGTON, SEATTLE, WA 98195
Liquidity, Investment Style, and the Relation
between Fund Size and Fund Performance
Xuemin (Sterling) Yan∗
Abstract
Using stock transactions data along with detailed stockholdings for a comprehensive sam-
ple of U.S. actively managed equity mutual funds from 1993 to 2002, this paper empirically
examines the effect of liquidity and investment style on the relation between fund size and
fund performance. Consistent with Chen, Hong, Huang, and Kubik (2004), I find a signifi-
cant inverse relation between fund size and fund performance. Further, this inverse relation
is stronger among funds that hold less liquid portfolios. The inverse relation between fund
size and fund performance is also more pronounced among growth and high turnover funds
that tend to have high demands for immediacy. Overall, this paper’s findings suggest that
liquidity is an important reason why fund size erodes performance.
I. Introduction
Understanding the nature of the economies of scale in the mutual fund indus-
try is central to the long-standing debate over the value of active fund manage-
ment. Yet there is little agreement among academics or practitioners about how
fund size affects fund performance. Some researchers argue that growth in fund
size provides cost advantages because brokerage commissions and research costs,
as well as administrative and overhead expenses, do not increase in direct pro-
portion to fund size. Supporting this argument is the evidence that fund expense
ratios decline with fund size (e.g., Tufano and Sevick (1997)).
Other researchers, however, contend that a large asset base might erode fund
performance because of liquidity. Perold and Salomon (1991) argue that there are
diseconomies of scale in active fund management stemming from the increased
price impact associated with large transactions. Similarly, Becker and Vaughan
((2001), p. 9) argue that as a fund grows larger, “the portfolio manager loses flex-
ibility: It becomes harder to switch in and out of positions. Executing a desired
∗ Yan, yanx@missouri.edu, University of Missouri-Columbia, College of Business, Department of
Finance, 427 Cornell Hall, Columbia, MO 65211. I thank Paul Brockman, Stephen Brown (the editor),
Stephen Haggard, John Howe, Cyndi McDonald, Sandra Mortal, Richard Roll, an anonymous referee,
and seminar participants at the University of Missouri-Columbia and the 2005 Financial Management
Association’s Annual Meetings for valuable comments. I thank Gary McCormick for research assis-
tance and Ron Howren for computational support.
741
2. 8/4/2008-1112–JFQA #43:3 Yan Page 742
742 Journal of Financial and Quantitative Analysis
trade will take longer or create adverse market impact price moves. The result-
ing reduction in the speed and nature of the portfolio adjustment will ultimately
impair fund performance.”
More recently, Berk and Green (2004) develop a rational model of active
fund management. In their model, there are decreasing returns to scale. However,
due to the competitive provision of capital by investors, the expected excess return
of any fund is the same and is equal to zero. Thus, according to Berk and Green,
there should be no significant relation between fund size and performance in the
cross section.
The empirical literature on the relation between fund size and fund perfor-
mance is limited. Grinblatt and Titman (1989) find some evidence that gross
fund returns decline with fund size, but do not find a similar effect using net re-
turns. Indro, Jiang, Hu, and Lee (1999) find a nonlinear relation between fund
size and performance; performance initially increases and then decreases in fund
size. More recently, Chen, Hong, Huang, and Kubik (2004) present evidence that
fund size erodes performance. They find that the adverse effect of size on perfor-
mance is stronger among small-cap funds. To the extent that small-cap stocks are
less liquid, they argue that their evidence provides support for the hypothesis that
fund size erodes performance because of liquidity.1
The purpose of this paper is to carefully examine the role of liquidity and in-
vestment style in determining the effect of fund size on fund performance. Chen et
al. (2004) rely on an investment objective, i.e., “small-cap growth funds,” to iden-
tify funds that hold relatively illiquid stocks. Their approach, while informative,
can be improved by using more direct measures of liquidity. Furthermore, prior
literature (e.g., Chan and Lakonishok (1995) and Keim and Madhavan (1997))
shows that investment style is a significant determinant of institutional trading
costs. Therefore, examining the effect of investment style can provide additional
insight into the nature of the economies of scale in active fund management.
Using stock transactions data along with detailed stockholdings for a com-
prehensive sample of U.S. actively managed equity mutual funds from 1993 to
2002, I construct two sets of liquidity measures for each fund’s portfolio. The
first set of liquidity measures are based on the quoted and effective spreads of
all stocks held in a fund’s portfolio. The second set of liquidity measures are
functions of the stock’s market capitalization as well as the relative holding size
(shares held divided by average daily trading volume), which are designed to cap-
ture the level of market impact of a fund’s portfolio.
Armed with these more direct (and continuous) liquidity measures, I next ex-
amine the effect of liquidity on the relation between fund size and performance by
using both a portfolio approach and a cross-sectional regression approach. In the
portfolio approach, I divide all sample funds into 5× 5 portfolios based on the liq-
uidity of a fund’s portfolio and fund size. I evaluate the performance of each port-
folio by using four standard asset pricing models, the CAPM, the Fama-French
three-factor model, the Carhart (1997) four-factor model, and a conditional four-
factor model (Ferson and Schadt (1996)). Regardless of which model I use, I find
1 Chan, Faff, Gallagher, and Looi (2005) also find a negative impact of fund size on the perfor-
mance of active funds using Australian data. They show that this diseconomy of scale is related to
market impact costs.
3. 8/4/2008-1112–JFQA #43:3 Yan Page 743
Yan 743
strong evidence that smaller funds earn significantly higher abnormal returns than
larger funds. Consistent with the hypothesis that liquidity is an important reason
why fund size erodes performance, I find that the inverse relation between fund
size and fund performance is more pronounced among funds in the lower liquidity
quintiles. Indeed, there is no evidence that fund size erodes performance among
funds in the three most liquid quintiles.
Chan and Lakonishok (1995) and Keim and Madhavan (1997) find that in-
vestment styles significantly influence institutional trading costs: Money man-
agers with high demands for immediacy are associated with larger market impact
and greater trading costs. In particular, Chan and Lakonishok (1995) find that
trading costs are higher for growth and high turnover funds. To examine how
the nature of the economies of scale varies across investment styles, I divide all
funds based on the average book-to-market deciles of their stockholdings and
fund turnover rates. Consistent with the hypothesis that liquidity is an important
reason why fund size erodes performance, I find that the adverse effect of scale
on performance is more pronounced among low book-to-market (growth) funds
and among high turnover funds.
I also examine the effect of liquidity on the relation between fund size and
fund performance by using a cross-sectional regression approach. This approach
allows me to control for other fund characteristics that may be correlated with
fund performance or fund size. Consistent with Chen et al. (2004), I find evi-
dence that fund performance is inversely related to fund size after controlling for
various fund characteristics. To explore the effect of liquidity on the relation be-
tween fund size and performance, I include in the regression an interaction term
between illiquidity and fund size. Consistent with the hypothesis that liquidity is
an important reason why fund size erodes performance, I find the coefficient on
this interaction term to be significantly negative.
An important consideration in the analysis of the effect of liquidity on the re-
lation between fund size and fund performance is that liquidity might be endoge-
nous. Indeed, the presence of endogenous liquidity would weaken the hypothe-
sized effect of liquidity on the fund size/fund performance relation. Intuitively,
funds that are subject to greater diseconomies of scale might optimally choose
to hold more liquid portfolios, which would make it harder to find a significant
positive effect of illiquidity on the inverse relation between fund size and perfor-
mance. Despite the presence of this bias, I find evidence that the inverse relation
between fund size and performance is more pronounced for funds that hold less
liquid portfolios and for growth and high turnover funds.
Chen et al. (2004) provide evidence that, in addition to liquidity, organiza-
tional diseconomies related to hierarchy costs (Stein (2002)) also play a role in the
documented diseconomy of scale within the mutual fund industry. In this paper,
I focus on the role of liquidity and do not examine organizational diseconomy. I
provide evidence that liquidity is an important reason why fund size erodes per-
formance. This result by no means suggests that liquidity alone is responsible for
the documented inverse relation between fund size and fund performance. Indeed,
Chen et al. (2004) argue that liquidity plays a significant role only in the presence
of organizational diseconomy.
4. 8/4/2008-1112–JFQA #43:3 Yan Page 744
744 Journal of Financial and Quantitative Analysis
This paper makes two contributions to the mutual fund literature. First, this
paper contributes to recent research focusing on the relation between fund size
and fund performance. Specifically, by using more direct liquidity measures of
a fund’s portfolio, this paper provides a rigorous analysis of the role of liquidity
in determining the fund size/fund performance relation. In addition, by providing
an analysis of the effect of investment style on the fund size/fund performance
relation, this paper further improves one’s understanding of why diseconomies of
scale might exist in active fund management.
Second, this paper makes a methodological contribution. While numerous
papers have examined the liquidity of individual stocks, the liquidity of managed
stock portfolios, such as an equity mutual fund’s portfolio, has received little di-
rect attention in the academic literature. This paper takes a step toward filling this
gap by proposing and constructing the first liquidity measures for a mutual fund’s
portfolio. Given that liquidity plays an important role in active fund management,
these liquidity measures are likely to become useful tools in mutual fund research
that examines fund performance, fund flows, and fund trading strategies.
The rest of this paper proceeds as follows. Section II describes the data and
variables. Section III presents the descriptive statistics and results for several pre-
liminary analyses. Section IV investigates the role of liquidity and investment
style in determining the effect of scale on performance in active fund manage-
ment. Section V concludes.
II. Data and Variables
A. Data and Sample
This study draws from a number of data sources. The Thomson Finan-
cial Mutual Fund Holdings database (hereafter referred to as the fund holdings
database) contains quarterly stockholdings for all U.S. mutual funds. Since this
dataset does not require any minimum surviving period for a fund’s inclusion, it
does not suffer from a survivorship bias. A detailed description of this database
can be found in Wermers (2000).
The second data source is the CRSP Survivor-Bias-Free Mutual Fund Data-
base (hereafter referred to as the CRSP mutual fund database). The CRSP mutual
fund database provides information on fund returns, total net assets (TNA), fees,
investment objectives, and other fund characteristics. I merge the fund holdings
database with the CRSP mutual fund database by using the MFLINK file obtained
from Wharton Research Data Services (WRDS).2
I restrict my analysis to diversified domestic equity mutual funds. Specifi-
cally, a fund is included in my sample if the fund has an ICDI investment objective
code of “AG” (Aggressive Growth), “LG” (Long-Term Growth), or “GI” (Growth
2 The MFLINK file does not always provide a one-to-one match between the two databases. Some-
times a fund in the fund holdings database is matched with multiple funds in the CRSP mutual fund
database. This is usually because the CRSP database reports each share class as a separate fund. I deal
with these situations by combining multiple share classes into a single fund. There are also a num-
ber of cases where a fund in the CRSP database is matched with multiple funds in the fund holdings
database. In these cases, I use other fund information such as TNA value and age to identify the best
match.
5. 8/4/2008-1112–JFQA #43:3 Yan Page 745
Yan 745
and Income). I exclude index funds to focus on actively managed mutual funds.3
Elton, Gruber, and Blake (2001) find that the returns of the smallest funds (funds
with TNA less than $15 million) reported in the CRSP mutual fund database tend
to be biased upward. To ensure that my results are not driven by these small funds,
I remove all funds with TNA less than $15 million. In addition, to minimize the
impact of an incubator fund bias (Evans (2006)), I remove the first 18 months
of returns for each sample fund. Removal of these young funds also alleviates a
concern that these funds are more likely to be cross-subsidized by their respective
fund families (Gaspar, Massa, and Matos (2006)).
Many mutual funds have multiple share classes. The CRSP mutual fund
database lists each share class as a separate fund. These share classes represent
claims on the same underlying assets, and have the same returns before expenses
and loads. They typically differ only in their fee structures (e.g., load versus no-
load) and/or in their clienteles (e.g., institutional versus retail). Because these
classes always hold the same portfolio, I combine these different classes into a
single fund in my analysis. Specifically, I sum the TNA of each share class to
obtain the TNA for the fund. For all other fund characteristics, I use the TNA-
weighted average across all share classes.
In contrast, Chen et al. (2004) keep only one share class for the funds with
multiple share classes. Although this approach does not obviously bias their re-
sults, it leads to a downward bias on their estimate of the fund’s total assets. As
a result, it might affect their analysis of the relation between fund size and fund
performance. Given the proliferation of share classes in the 1990s, this issue is
more severe after 1990.
I obtain the market capitalization for each stock from the CRSP stock database
and calculate the book-to-market ratio using data from Compustat. I obtain in-
traday trades and quotes for all common stocks traded on NYSE, AMEX, and
Nasdaq from the Trade and Quote (TAQ) database. Since TAQ starts in 1993, the
sample period for this study is 1993–2002.4
B. Liquidity Measures
1. Bid-Ask Spread
The most commonly used liquidity measures are bid-ask spreads. Thus, my
first set of liquidity measures for a fund’s portfolio is based on bid-ask spreads.
More specifically, I define QS (ES) as the weighted average relative quoted spread
(effective spread) of all stocks held in a fund’s portfolio:
N
1
(1) QS = N
wi %QuotedSpreadi ,
wi i=1
i=1
3I
identify index funds by searching the word “index” in fund names.
4 In
my analysis of growth and high turnover funds, I also examine extended sample periods that
go back to 1983 and 1966, respectively.
6. 8/4/2008-1112–JFQA #43:3 Yan Page 746
746 Journal of Financial and Quantitative Analysis
N
1
(2) ES = N
wi %EffectiveSpreadi ,
wi i=1
i=1
where wi is the dollar value of stock i, N is the number of holdings in the portfolio,
and %QuotedSpreadi and %EffectiveSpreadi are the relative quoted and effective
spread of stock i. I calculate QS and ES for each fund at each quarter by using
past one-quarter average spreads.
To estimate the quoted and effective spread for each stock, I start with all
the trades and quotes in the TAQ database. I follow Chordia, Roll, and Subrah-
manyam (2001), (2002) to purge the following trade and quote data: trades out
of sequence, trades and quotes before the open or after the close, quotes not orig-
inated from the primary exchange, trades or quotes with negative prices, quotes
with negative spread, quotes with spread greater than $4 or 20% of the midquote.
I sign trades using the Lee and Ready (1991) algorithm: if a trade occurs above
(below) the mid-point of the prevailing quote, it is classified as a buyer- (seller-)
initiated trade. If a trade occurs at the mid-point of the prevailing quote, it is
signed based on the tick test.
I first calculate the average quoted and effective spread for each stock on
each trading day. Then for each stock I calculate the average quoted and effective
spread across all trading days within a quarter. Finally, I merge these average
bid-ask spreads with the fund holdings database.
2. Market Impact
Bid-ask spreads do not capture the price impact of a large trade, which can
be thought of as the deviation of the trade price from the price that would have
prevailed had the trade not occurred. Chan and Lakonishok (1995) and Keim
and Madhavan (1997) show that the market impact and institutional trading costs
increase with trade difficulty, which is positively related to relative order size and
negatively related to a stock’s market capitalization.
Motivated by the above studies on institutional trading costs, I construct my
second set of liquidity measures as follows. I first calculate the market capi-
talization of each stock and then place each stock into a size decile by NYSE
breakpoints. In particular, I place the largest stocks in size decile 1 and the small-
est stocks in size decile 10. Following Chan and Lakonishok (1995), I define the
relative holding size as the ratio between holding size and average daily trading
volume.5 I then use the following step function to transform the relative holding
size:
5 It is well documented that the reported trading volumes for Nasdaq stocks are inflated. So I divide
the Nasdaq volume by 2.
7. 8/4/2008-1112–JFQA #43:3 Yan Page 747
Yan 747
wi
(3) F =
DVOLi
⎧ 1 if 0 < wi ⎧ 6 if
≤ 0.05 ⎪ wi
1 < DVOL ≤ 2
⎪
⎪ DVOLi ⎪
⎪
⎪ 2 if 0.05 < wi ⎪
⎪ 7 if wi
i
⎪
⎪ DVOLi ≤ 0.1 ⎪
⎪ 2 < DVOL ≤ 5
⎨ ⎨ i
wi wi
3 if 0.1 < DVOL ≤ 0.25 8 if 5 < DVOL ≤ 10 ,
⎪
⎪ 4 if 0.25 <
i
⎪
⎪
i
⎪ wi ⎪ wi
⎪
⎪
⎪ DVOLi ≤ 0.5 ⎪
⎪
⎪
9 if 10 < DVOL ≤ 25
⎩ wi ⎩ wi
i
5 if 0.5 < DVOL ≤ 1 10 if DVOLi > 25
i
where wi is dollar holding of stock i, and DVOLi is the average daily dollar trading
volume of stock i over the past quarter. The second set of liquidity measures, MI1
and MI2, are then defined as follows:
N
1 wi
(4) MI1 = wi × SizeDecilei + F
N DVOLi
wi i=1
i=1
N
1 wi
(5) MI2 = wi × SizeDecilei × F ,
N DVOLi
wi i=1
i=1
where wi is dollar holding of stock i, SizeDecilei is the size decile that stock i
belongs to using NYSE breakpoints, DVOLi is the average daily dollar trading
volume of stock i over the past quarter, and F(·) is defined in equation (3).
The use and specification of F(·) in equation (3) are motivated by a number
of considerations. First, the market impact of a trade is unlikely to be directly
proportional to the trade size. For example, a trade of 1,000 shares of Microsoft
stock likely has a similar market impact to a trade of 100 shares (minimal in both
cases), even though the first trade is 10 times as large as the second trade. Second,
the use of F(·) minimizes the impact of outliers. Third, the specific cutoffs used
in F(·) are motivated by industry practice and the empirical distribution of the
relative holding size. For example, many practitioners believe that a trade size
of 10% or less of daily average trading volume is usually impact free (Becker
and Vaughan (2001)). Additionally, for liquidity reasons some funds require that
their holdings in individual stocks be no more than 25% of average daily trading
volume (Pozen (2002)). Admittedly, the number of categories and the choice of
cutoffs in F(·) are somewhat arbitrary. Nonetheless, this specification provides a
useful characterization of the market impact of institutional trades. Unreported
results indicate that the paper’s main findings are robust to several reasonable
alternative specifications of F(·).
To illustrate how MI1 and MI2 are constructed, consider two funds each
with a single holding. Fund X holds 10,000 shares of stock A and Fund Y holds
10,000 shares of stock B. Stock A is a large-cap stock ranked in the top size decile
(decile 1). Stock B, on the other hand, is a small-cap stock ranked in the bottom
size decile (decile 10). Further assume that the average daily trading volume for
stock A is 100,000 shares and that the average daily trading volume for stock B
8. 8/4/2008-1112–JFQA #43:3 Yan Page 748
748 Journal of Financial and Quantitative Analysis
is only 1,000 shares. Thus, 10,000 shares of A are equivalent to 10% of its daily
volume, while 10,000 shares of B are equivalent to 10 times of its daily trading
volume. Based on equations (3), (4), and (5), Fund X has an MI1 of 3 (1 + 2) and
an MI2 of 2 (1 × 2), whereas Fund Y has an MI1 of 18 (10 + 8) and an MI2 of
80 (10 × 8). Thus, based on either measure, Fund Y is less liquid than Fund X.
This is to be expected because Fund Y holds a smaller stock with a larger relative
holding size.
Both MI1 and MI2 are functions of a fund portfolio’s average size decile and
relative holding size, and are designed to capture the level of market impact of a
portfolio. While MI1 is the average sum of size decile and relative holding size,
MI2 is the average product. Despite this difference in specification, both MI1 and
MI2 capture the idea that the market impact increases in relative order size and
decreases in a stock’s market capitalization.
I note that although the above measures of fund portfolio liquidity are based
on the liquidity of underlying stocks and other portfolio characteristics such as
position size, they are nonetheless imperfect measures of liquidity. Furthermore,
while they are more direct measures of liquidity, unreported results suggest that
these measures are highly correlated with the liquidity proxy used by Chen et al.
(2004), i.e., whether a fund is a small-cap growth fund.
III. Descriptive Statistics and Preliminary Analyses
A. Descriptive Statistics
Table 1 presents the descriptive statistics for fund characteristics including
liquidity. In addition to summary statistics for all sample funds as a group, I also
report summary statistics for each fund size quintile separately. For each data item
(e.g., expense ratio), I first calculate the TNA-weighted average across all funds
for each year from 1993 to 2002, and then report a simple time-series average of
the cross-sectional averages.
In each year, there are on average 1,024 funds in my sample with an average
of 204 or 205 funds in each fund size quintile. The average TNA for all sample
funds is $1,152.19 million. The average fund in the smallest fund size quintile
has only $37.61 million in total assets, while the average fund in the largest fund
size quintile has over $4 billion in total assets.
The average age of all sample funds is 13.92 years. The average turnover
rate is approximately 92% per year and the average expense ratio is 1.26%. As
one might expect, fund age increases with fund size, while the turnover rate and
expense ratio decrease with fund size.
The average sample fund holds 5.94% cash and 91.82% stock. Smaller funds
tend to hold more cash and less stock, although this relation is not monotonic. The
average fund holds 110 stocks. As expected, larger funds hold substantially more
stocks. For example, the average fund in the largest fund size quintile holds 162
stocks, whereas the average fund in the smallest fund size quintile holds only 72
stocks. As a group, fund managers prefer large stocks and growth stocks as evi-
9. 8/4/2008-1112–JFQA #43:3 Yan Page 749
Yan 749
TABLE 1
Descriptive Statistics
Table 1 presents the summary statistics for fund characteristics. The sample period is 1993–2002. I obtain mutual fund
stockholdings from Thomson Financial. Fund characteristics are from the CRSP mutual fund database. The sample
includes all funds with an investment objective code of “AG” (Aggressive Growth), “LG” (Long-Term Growth), or “GI”
(Growth and Income). I combine different share classes into a single fund. I exclude index funds and funds with total
net assets less than $15 million. I exclude the first 18 months of data for each sample fund. Stock characteristics are
from Compustat and the CRSP stock database. Size and BM deciles are by NYSE breakpoints. Size decile 1 contains
the largest stocks. BM decile 1 contains the value stocks. Transaction-level data are from the Trade and Quote (TAQ)
database. QS, ES, MI1, and MI2 are liquidity measures as defined in equations (1), (2), (4), and (5), respectively.
Fund Size Quintile
Data Item All Funds 1 (small) 2 3 4 5 (large)
Number of Funds 1,024 204 205 205 205 205
Total Net Assets (TNA) $mil 1,152.19 37.61 109.46 255.29 642.07 4,718.24
Fund Age (AGE)–Year 13.92 8.17 10.43 11.84 15.72 23.42
Turnover (TURN) % 92.22 97.30 94.45 95.48 95.18 78.58
Expense Ratio (EXP) % 1.26 1.42 1.33 1.28 1.23 1.05
12b-1 Fee (12B1) % 0.20 0.17 0.18 0.21 0.23 0.21
Total Load (LOAD) % 2.07 1.64 1.89 2.14 2.24 2.42
Cash % 5.94 5.91 6.09 5.77 5.81 6.13
Stock % 91.82 92.40 90.91 92.28 91.91 91.60
Number of Holdings 109.64 71.83 84.37 102.08 128.14 161.72
Size Decile (SIZE) 2.20 2.60 2.38 2.39 2.16 1.48
BM Decile (BM) 6.36 6.14 6.37 6.38 6.44 6.45
Quoted Spread (QS) % 0.38 0.42 0.41 0.39 0.37 0.32
Effective Spread (ES) % 0.28 0.31 0.30 0.28 0.27 0.23
Market Impact (MI1) 6.79 5.91 6.18 6.84 7.25 7.75
Market Impact (MI2) 14.87 12.22 13.69 16.15 16.85 15.44
denced by the average size decile of 2.20 (decile 1 containing the largest stocks)
and the average book-to-market decile of 6.36 (decile 1 containing value stocks).6
Turning attention to liquidity measures, I find that the QS is 0.38% and the
ES is 0.28% for the average sample fund. Both QS and ES decrease in fund size.
For example, the average QS is 0.42% for the smallest fund size quintile, but
is only 0.32% for the largest fund size quintile. This result suggests that larger
funds tend to hold more liquid stocks. However, this does not necessarily mean
that their portfolios are more liquid. Indeed, based on the second set of liquidity
measures that capture market impact, I find that larger funds’ portfolios tend to
be less liquid. The average MI1 (MI2) for the smallest fund size quintile is 5.91
(12.22), but increases to 7.75 (15.44) for the largest fund size quintile. This is
to be expected. Larger funds on average have larger holding sizes (despite more
holdings), which make their portfolios less liquid.
Table 2 presents the correlations among liquidity measures and various fund
characteristics. I compute cross-sectional correlations each year, and then report
the simple time-series average of cross-sectional correlations. Several correlations
are noteworthy. All four liquidity measures are positively correlated with each
other. Larger funds, older funds, and funds in larger fund families tend to hold
more liquid stocks with lower quoted and effective spreads. Funds that charge
lower fees tend to invest in less liquid stocks. MI1 and MI2 are both inversely
related to fund size, consistent with the result reported in Table 1.
6 I place the largest stocks in size decile 1 (as opposed to decile 10) and stocks with the highest
book-to-market ratio in the book-to-market decile 1 (as opposed to decile 10) to facilitate subsequent
analyses of the interaction effect between fund size and liquidity.
10. 8/4/2008-1112–JFQA #43:3 Yan Page 750
750 Journal of Financial and Quantitative Analysis
TABLE 2
Time-Series Averages of Cross-Sectional Correlations
Table 2 presents the correlations between various fund characteristics including liquidity. The sample period is 1993–
2002. I obtain mutual fund stockholdings from Thomson Financial. Fund characteristics are from the CRSP mutual fund
database. The sample includes all funds with an investment objective code of “AG” (Aggressive Growth), “LG” (Long-
Term Growth), or “GI” (Growth and Income). I combine different share classes into a single fund. I exclude index funds
and funds with total net assets less than $15 million. I exclude the first 18 months of data for each sample fund. Stock
characteristics are from Compustat and the CRSP stock database. LOGTNA is the logarithm of fund total net assets.
LOGFAM is the logarithm of the fund family’s total net assets. LOGAGE is the logarithm of fund age. EXP is expense ratio.
TURN is the turnover. LOAD is the total load. Transaction-level data are from the Trade and Quote (TAQ) database. QS,
ES, MI1, and MI2 are liquidity measures as defined in equations (1), (2), (4), and (5), respectively. I first calculate the
correlation for each quarter and then report the time-series average correlations. ** indicates significance at the 5% level.
LOGTNA LOGFAM LOGAGE EXP TURN LOAD QS ES MI1 MI2
LOGTNA 1.00
LOGFAM 0.55** 1.00
LOGAGE 0.45** 0.11** 1.00
EXP −0.30** −0.23** −0.22** 1.00
TURN −0.06 0.02 −0.09** 0.17** 1.00
LOAD 0.12** 0.19** 0.16** 0.35** −0.01 1.00
QS −0.13** −0.10** −0.13** 0.18** 0.01 −0.06** 1.00
ES −0.13** −0.10** −0.13** 0.19** 0.01 −0.06** 0.99** 1.00
MI1 0.21** 0.03 0.03 0.10** −0.04 −0.06** 0.72** 0.72** 1.00
MI2 0.08** −0.03 −0.03 0.12** −0.06** −0.08** 0.76** 0.76** 0.96** 1.00
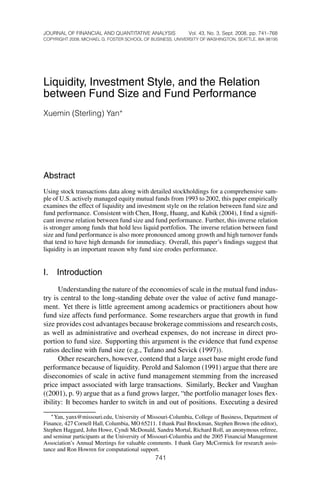
To assess how portfolio liquidity has changed over time, I plot in Figure 1
the average liquidity of equity mutual funds’ portfolios from 1993 to 2002. Based
on quoted or effective spreads, the liquidity of equity mutual funds’ portfolios
has improved dramatically from 1993 to 2002. For example, the average quoted
spread declined from approximately 0.6% in 1993 to approximately 0.2% in 2002,
while the average effective spread declined from around 0.4% to approximately
0.15% over the same period. These results are to be expected given the evidence
that the bid-ask spreads of U.S. stocks declined substantially over the past decade
or so (see, e.g., Chordia et al. (2001) and Jones (2002)). Figure 1 shows two
episodes of significant decline in bid-ask spreads. The first occurred in the first
half of 1997 when the Nasdaq implemented an order handling reform and the
NYSE changed the minimum tick size from 1/8 of a dollar to 1/16 of a dollar.
The second significant decline in bid-ask spreads occurred in early 2001, when
decimalization was implemented in all U.S. stock exchanges.
The average liquidity of mutual fund portfolios has also improved over my
sample period based on MI1 or MI2, but the improvement is both less dramatic
and less consistent than that of bid-ask spreads. Over 1993–2002, the average
MI1 decreases by only 20% from about 7.5 to 6, while MI2 decreases from about
17 to 11. Moreover, both MI1 and MI2 have steadily increased from mid-1999 to
the end of 2002.
B. Preliminary Analyses
Before examining the impact of liquidity on the relation between fund size
and performance, I first conduct two preliminary analyses to better understand
the behavior of the liquidity of equity mutual funds’ portfolios. Specifically, in
Section III.B.1, I examine the relation between fund liquidity and various fund
characteristics. In Section III.B.2, I examine the impact of fund liquidity on fund
cash holdings.
11. 8/4/2008-1112–JFQA #43:3 Yan Page 751
Yan 751
FIGURE 1
Average Liquidity of U.S. Equity Mutual Funds’ Portfolios, 1993–2002
Figure 1 plots the average liquidity of U.S. equity mutual funds’ portfolios for the period 1993–2002. I obtain mutual
fund stockholdings from Thomson Financial. Fund characteristics are from the CRSP mutual fund database. The sample
includes all funds with an investment objective code of “AG” (Aggressive Growth), “LG” (Long-Term Growth), or “GI”
(Growth and Income). I exclude index funds and funds with total net assets less than $15 million. I exclude the first 18
months of data for each sample fund. I combine different share classes into a single fund. Transaction-level data are from
the Trade and Quote (TAQ) database. QS, ES, MI1, and MI2 are liquidity measures as defined in equations (1), (2), (4),
and (5), respectively.
.7 20
Quoted Spread/Effective Spread (%)
18
.6
16
.5
Market Impact
14 MI2
QS
.4 12
10
.3 ES
8 MI1
.2
6
.1 4
93 94 95 96 97 98 99 00 01 02 93 94 95 96 97 98 99 00 01 02
1. Liquidity and Fund Characteristics
In this subsection, I examine the relation between the liquidity of a fund’s
portfolio and various fund characteristics including fund size, fund family size,
fund age, number of holdings, turnover, expense ratio, and total load. I use the
Fama and MacBeth (1973) methodology. Specifically, I run a cross-sectional
regression of liquidity each year, and then calculate the mean yearly coefficient
estimates over the entire sample period. The t-statistics are adjusted for serial
correlation using the Newey-West method.
Table 3 shows the time-series averages of coefficient estimates from yearly
regressions. The dependent variables of these regressions are the four liquidity
measures, QS, ES, MI1, and MI2, respectively. Column 1 reports the results on
the quoted spread. Larger funds and older funds tend to hold portfolios with lower
average quoted spreads. These results are statistically significant. In addition,
higher turnover funds tend to hold more liquid stocks. This result is consistent
with the idea that fund managers who trade actively try to minimize transactions
costs by holding more liquid stocks. Funds that charge higher fees hold less liquid
stocks, suggesting perhaps that the investment expertise in illiquid stocks might
be more difficult to obtain and hence is more valuable. The results regarding
effective spreads are qualitatively similar to those regarding quoted spreads.
Turning to measures of market impact, I find that MI1 is positively related to
expense ratios and negatively related to turnover and total load. These results are
consistent with those on quoted and effective spreads. In contrast to the results
based on quoted and effective spreads, I find that larger funds hold less liquid
portfolios in that they have significantly higher MI1. This is not surprising be-
cause larger funds tend to hold larger positions. Funds with more holdings tend
to have higher market impact. This result initially appears counterintuitive. Since
more holdings should be related to a smaller position size, one might have ex-
pected a larger number of holdings to be associated with lower market impact.
Unreported results indicate that the above finding is primarily due to the fact that
12. 8/4/2008-1112–JFQA #43:3 Yan Page 752
752 Journal of Financial and Quantitative Analysis
TABLE 3
Fund Characteristics and Liquidity of Equity Mutual Funds’ Stock Portfolios
Table 3 examines the relation between portfolio liquidity and various fund characteristics. The sample period is 1993–
2002. I obtain mutual fund stockholdings from Thomson Financial. Fund characteristics are from the CRSP mutual fund
database. The sample includes all funds with an investment objective code of “AG” (Aggressive Growth), “LG” (Long-
Term Growth), or “GI” (Growth and Income). I combine different share classes into a single fund. I exclude index funds
and funds with total net assets less than $15 million. I exclude the first 18 months of data for each sample fund. Stock
characteristics are from Compustat and the CRSP stock database. Transaction-level data are from the Trade and Quote
(TAQ) database. QS, ES, MI1, and MI2 are liquidity measures as defined in equations (1), (2), (4), and (5), respectively. I
use the Fama-MacBeth (1973) method. Numbers in parentheses are t-statistics that are based on Newey-West standard
errors. ** indicates significance at the 5% level.
Dependent Variable
Independent Variables QS ES MI1 MI2
Intercept 0.154** 0.098 −0.087 −7.454**
(2.18) (1.80) (−0.13) (−3.68)
Log TNA −0.012** −0.009** 0.692** 1.699**
(−2.96) (−2.92) (9.05) (5.41)
Log Family TNA −0.001 −0.001 −0.126** −0.537**
(−0.54) (−0.62) (−6.38) (−6.54)
Log Fund Age −0.014** −0.010** −0.113** −0.705**
(−3.27) (−3.44) (−2.18) (−3.26)
Log Number of Holdings 0.043** 0.033** 0.594** 2.880**
(2.32) (2.33) (6.00) (11.45)
Turnover −0.017** −0.010** −0.261** −1.558**
(−2.58) (−2.12) (−4.83) (−5.65)
Expense Ratio 0.158** 0.119** 2.057** 8.239**
(4.69) (5.05) (13.08) (12.68)
Total Load −0.016** −0.012** −0.264** −1.051**
(−9.42) (−10.43) (−13.38) (−15.53)
Average R 2 0.08 0.08 0.13 0.10
funds with a larger number of holdings also tend to hold smaller stocks.7 The
results concerning MI2 are qualitatively similar to those concerning MI1.
2. Liquidity and Fund Cash Holdings
Funds can meet large redemptions by either altering cash balances or by
selling stocks. Thus, there might be a trade-off between a fund’s cash holding
and the liquidity of a fund’s stockholdings. Intuitively, if a fund’s stockholdings
are not liquid, the fund might need to hold a large amount of cash to compensate
for the lack of liquidity in its stockholdings. To test this hypothesis, I regress
fund cash holdings on various fund characteristics including the liquidity of a
fund’s portfolio. I use Fama and MacBeth’s (1973) methodology. Specifically, I
estimate a cross-sectional regression of cash holdings each year, and then report
the average regression coefficients. The t-statistics are again adjusted for serial
correlation using the Newey-West method.
Table 4 shows the regression results. I find that fund cash holdings are posi-
tively related to fund size, turnover, and expense ratios. More importantly, I find
that fund cash holdings are significantly positively related to the illiquidity of a
fund’s portfolio regardless of which liquidity measure I use. All of the coeffi-
cients on liquidity are positive and statistically significant at the 1% level. The
results are also economically significant. All else equal, a two-standard deviation
7 I am unable to control for the size decile of the stockholdings in this regression because size
decile enters directly into the dependent variables, MI1 and MI2. See equations (4) and (5).
13. 8/4/2008-1112–JFQA #43:3 Yan Page 753
Yan 753
increase in QS is associated with an increase in fund cash holdings by 1.3%. Ta-
ble 1 reports that the average cash holdings of all funds is 5.94%. Therefore, the
above amount is economically meaningful. The economic significance is similar
when I use market impact measures, MI1 and MI2. For example, a two-standard
deviation increase in MI1 is associated with an increase of fund cash holdings by
1.4%. Overall, these results suggest that a trade-off exists between cash balances
and the liquidity of stockholdings.
TABLE 4
Fund Cash Holdings and Liquidity of Equity Mutual Funds’ Stock Portfolios
Table 4 presents the regression of fund cash holdings on various fund characteristics including liquidity. The sample
period is 1993–2002. I obtain mutual fund stockholdings from Thomson Financial. Fund characteristics are from the CRSP
mutual fund database. The sample includes all funds with an investment objective code of “AG” (Aggressive Growth),
“LG” (Long-Term Growth), or “GI” (Growth and Income). I combine different share classes into a single fund. Fund
cash holdings are in percent. I exclude index funds and funds with total net assets less than $15 million. I exclude the
first 18 months of data for each sample fund. Stock characteristics are from Compustat and the CRSP stock database.
Transaction-level data are from the Trade and Quote (TAQ) database. QS, ES, MI1, and MI2 are liquidity measures as
defined in equations (1), (2), (4), and (5), respectively. I use the Fama-MacBeth (1973) method. Numbers in parentheses
are t-statistics that are based on Newey-West standard errors. ** indicates significance at the 5% level.
Dependent Variable: Fund Cash Holdings
Independent Variables QS ES MI1 MI2
Intercept 0.692 0.737 0.841 1.164
(0.84) (0.91) (1.11) (1.50)
Log TNA 0.382** 0.379** 0.211** 0.281**
(3.91) (3.85) (2.35) (2.90)
Log Family TNA −0.147** −0.146** −0.129** −0.131**
(−2.36) (−2.34) (−2.11) (−2.14)
Log Fund Age 0.241 0.243 0.247 0.255
(1.74) (1.75) (1.82) (1.87)
Turnover 0.513 0.505 0.532 0.545
(1.28) (1.26) (1.34) (1.38)
Total Load −0.075 −0.075 −0.054 −0.062
(−1.16) (−1.15) (−0.85) (−0.99)
Expense Ratio 2.147** 2.137** 2.074** 2.139**
(6.08) (6.07) (6.15) (6.31)
QS 2.242**
(4.40)
ES 2.970**
(5.09)
MI1 0.216**
(14.21)
MI2 0.046**
(13.49)
Average R 2 0.05 0.05 0.05 0.05
IV. The Effect of Liquidity and Investment Style on the
Relation between Fund Size and Fund Performance
A. Overview
Chen et al. (2004) provide a comprehensive analysis of the relation between
fund size and fund performance. Using a cross-sectional regression approach,
they find that fund size erodes performance. Further, Chen et al. (2004) divide
funds into small-cap funds and non-small-cap funds, and find that the adverse
14. 8/4/2008-1112–JFQA #43:3 Yan Page 754
754 Journal of Financial and Quantitative Analysis
effect of size on performance is stronger among small-cap funds. To the extent
that small-cap stocks are less liquid, they argue that the evidence provides support
for the liquidity hypothesis.
In this section, I first confirm Chen et al.’s (2004) finding of diseconomies
of scale in active fund management. I then extend Chen et al. (2004) to provide
a more rigorous analysis of the effect of liquidity on the relation between fund
size and fund performance. Specifically, instead of using the investment objective
“small-cap growth funds” to proxy for liquidity, I use two sets of more direct
liquidity measures. I also examine the effect of investment style on the relation
between fund size and fund performance.
In my empirical analysis, I use two approaches—a time-series portfolio ap-
proach and a cross-sectional regression approach. In the portfolio approach, I
form portfolios based on fund size and liquidity. Portfolio performance is eval-
uated by using several standard asset pricing models. In the cross-sectional re-
gression approach, I follow Chen et al. (2004) to run cross-sectional regressions
of risk-adjusted fund returns on various fund characteristics including fund size
and liquidity. The advantage of the cross-sectional regression approach is that it
allows controlling for other fund characteristics. Sections IV.B and IV.C contain
more details about these methods.
B. Empirical Results—Time-Series Portfolio Approach
1. Method
At the end of each quarter, I divide all sample funds into quintiles based on
their TNA of the previous quarter. I rebalance these portfolios each quarter. I then
compute equal-weighted monthly returns for each quintile. I evaluate the perfor-
mance of these portfolios by using several one- and multi-factor models. Specif-
ically, I use the CAPM model, the Fama-French (1996) three-factor model, the
Carhart (1997) four-factor model, and a conditional four-factor model. Following
prior literature, I use alpha, the intercept term in the regression of fund portfolio
returns on risk factors, as the performance measure. As argued by Carhart (1997),
one of the advantages of the portfolio regression approach is that it does not suffer
from survivor bias and look-ahead bias. Below is the Carhart (1997) four-factor
model:
(6) rp,t − rf ,t = α + b · MKTt + s · SMBt + h · HMLt + u · UMDt + et ,
where rp,t is the return on the portfolio, rf ,t is the risk-free rate, and MKT, SMB,
HML, and UMD are market factor, size factor, book-to-market factor, and the
momentum factor, respectively. Note that the CAPM model and the Fama-French
three-factor model are both nested in the Carhart four-factor model.
Ferson and Schadt (1996) propose a conditional performance evaluation mod-
el based on predetermined conditioning variables to account for time-varying risk
premiums and time-varying betas. They show that conditional alphas can differ
15. 8/4/2008-1112–JFQA #43:3 Yan Page 755
Yan 755
significantly from unconditional alphas. As a robustness check, I also estimate
the following conditional performance evaluation model:
(7) rp,t − rf ,t = α + b1 · MKTt + b2 · DPt−1 · MKTt + b3 · DEFt−1 · MKTt
+ b4 · TERMt−1 · MKTt + b5 · TB3Mt−1 · MKTt
+ s · SMBt + h · HMLt + u · UMDt + et ,
where DP is the S&P 500 index dividend yield, DEF is the default spread, TERM
is the term premium, and TB3M is the three-month T-bill rate.8 In this model, I al-
low the market beta to be a linear function of predetermined variables. Alternative
specifications of the conditional model do not affect the qualitative results.
2. The Relation between Fund Size and Fund Performance
I begin my analysis by first examining whether there are diseconomies of
scale for actively managed equity mutual funds over my sample period 1993–
2002. Table 5 shows the alphas for fund size portfolios. Specifically, Panel A of
Table 5 reports the alphas estimated from gross returns and Panel B reports the
alphas estimated from net returns.9
In each panel of Table 5, I present four alphas, the CAPM alpha, the Fama-
French three-factor alpha, the Carhart four-factor alpha, and the conditional four-
factor alpha. Regardless of which alpha measure I use, the smallest size quintile
performs significantly better than the largest fund size quintile. For example,
when using the CAPM model, I find that funds in the smallest quintile outperform
funds in the largest quintile by 23 basis points per month. When I use the Carhart
(1997) model, this difference decreases slightly to 17 basis points per month, but
is still statistically significant at the 1% level.
Panel B of Table 5 shows the results for net returns. As expected, the alphas
calculated from net returns are lower than those calculated from gross returns (by
approximately 1/12 of the expense ratio). The smallest funds continue to out-
perform the largest funds in each alpha measure, but by slightly smaller amounts
than those obtained using gross returns. For example, using the Carhart (1997)
model, the smallest funds outperform the largest funds by 14 basis points per
month (compared to 17 basis points reported in Panel A). This is to be expected
because smaller funds tend to charge higher fees. Therefore, the difference in
after-expense returns between small and large funds is smaller than the difference
in before-expense returns.
Overall, results in Table 5 confirm the Chen et al. (2004) finding that small
funds significantly outperform large funds for my sample period. Comparing
the results of Chen et al. (2004) to mine, I find that the inverse relation between
fund size and fund performance is more pronounced for my sample period (1993–
2002) than for the earlier period. Specifically, Chen et al. ((2004), Table 2) report
differences between small funds and large funds of 0.11%, 0.06%, and 0.08%
per month using the one-, three-, and four-factor models, respectively. The corre-
sponding numbers are 0.20%, 0.13%, and 0.14% in my paper.
8 These conditioning variables are differences from their respective unconditional means.
9I calculate the fund’s monthly gross return by adding 1/12 of the fund’s annual expense ratio to
the monthly net return.
16. 8/4/2008-1112–JFQA #43:3 Yan Page 756
756 Journal of Financial and Quantitative Analysis
TABLE 5
The Relation between Fund Size and Fund Performance, Portfolio Approach
Table 5 examines the relation between fund size and fund performance. The sample period is 1993–2002. I obtain mutual
fund stockholdings from Thomson Financial. Fund characteristics are from the CRSP mutual fund database. The sample
includes all funds with an investment objective code of “AG” (Aggressive Growth), “LG” (Long-Term Growth), or “GI”
(Growth and Income). I combine different share classes into a single fund. I exclude index funds and funds with total net
assets less than $15 million. I exclude the first 18 months of data for each sample fund. Gross returns are calculated by
adding back 1/12 of the annual expense ratio to the net return. Stock characteristics are from Compustat and the CRSP
stock database. Transaction-level data are from the Trade and Quote (TAQ) database. QS, ES, MI1, and MI2 are liquidity
measures as defined in equations (1), (2), (4), and (5), respectively. I use four models to evaluate fund performance:
CAPM, Fama-French three-factor model, Carhart four-factor model, and the conditional four-factor model as described in
equations (7) and (8). Numbers in parentheses are t-statistics. ** indicates significance at the 5% level.
Fund Size Quintile
Difference
α 1 (small) 2 3 4 5 (large) 1−5
Panel A. Alphas Estimated Using Gross Returns (% per month)
CAPM 0.18 0.06 0.03 −0.06 −0.05 0.23**
(1.54) (0.51) (0.25) (−0.51) (−0.68) (3.39)
Fama-French 3-Factor 0.11 −0.00 0.01 −0.08 −0.06 0.16**
(1.37) (−0.02) (0.09) (−1.09) (−0.97) (3.14)
Carhart 4-Factor 0.10 −0.01 −0.03 −0.10 −0.07 0.17**
(1.23) (−0.16) (−0.45) (−1.20) (−1.19) (3.18)
Conditional 4-Factor 0.14 0.01 0.00 −0.08 −0.06 0.20**
(1.71) (0.18) (0.04) (−0.97) (−0.93) (3.87)
Panel B. Alphas Estimated Using Net Returns (% per month)
CAPM 0.06 −0.05 −0.07 −0.16 −0.14 0.20**
(0.52) (−0.45) (−0.60) (−1.41) (−1.85) (2.94)
Fama-French 3-Factor −0.01 −0.11 −0.10 −0.19 −0.14 0.13**
(−0.17) (−1.50) (−1.33) (−2.43)** (−2.48)** (2.55)
Carhart 4-Factor −0.02 −0.12 −0.14 −0.20 −0.16 0.14**
(−0.25) (−1.60) (−1.86) (−2.50)** (−2.65)** (2.63)
Conditional 4-Factor 0.02 −0.09 −0.10 −0.18 −0.15 0.17**
(0.27) (−1.20) (−1.27) (−2.18)** (−2.29)** (3.27)
There are two possible explanations for this difference. First, the size differ-
ential between large and small funds has widened substantially over 1962–2002.
On average, funds in the largest quintile are 36 times as large as funds in the
smallest quintile during 1962–1992. However, this ratio increases to 130 on av-
erage during 1993–2002. If there are indeed diseconomies of scale in the mutual
fund industry, then with everything else equal, one might expect a greater return
differential between small funds and large funds during 1993–2002.
The second possible explanation is that stock returns have become more
dispersed over time. This suggests that the potential reward for superior stock-
picking skills might have increased. A fund manager who picks the 95th per-
centile stock would outperform the fund manager who picks the 5th percentile
stock by an average of 38% per month during 1962–1992. However, this overper-
formance increases to 55% during 1993–2002. While this upward trend does not
directly explain the difference between my results and those in Chen et al. (2004),
it provides a possible explanation.10
10 Unreported results indicate that the greater negative impact of fund size on performance docu-
mented in this paper is not due to differences in empirical methods between this paper and Chen et al.
(2004).
17. 8/4/2008-1112–JFQA #43:3 Yan Page 757
Yan 757
3. The Effect of Liquidity
Results in the previous section confirm Chen et al.’s (2004) finding that fund
size erodes performance. To test if the above result is related to liquidity, I divide
all funds into 5 × 5 portfolios based on the liquidity of a fund’s portfolio and
fund size. To the extent that larger funds underperform smaller funds because of
liquidity, one would expect that the inverse relation between fund size and fund
performance is more pronounced among funds with less liquid stockholdings.
Table 6 consists of four panels corresponding to the four liquidity measures.
The results are remarkably consistent across all four liquidity measures: The ad-
verse effect of scale on performance is more pronounced for funds with less liquid
portfolios. Indeed, there is no evidence that small funds outperform large funds
for the three most liquid quintiles. For example, the smallest funds outperform the
largest funds by 35 basis points per month among funds with the highest QS. The
difference is 17 basis points and is statistically significant among the second high-
est QS quintile. However, among funds in the remaining three QS quintiles, the
smallest funds do not significantly outperform the largest funds. In fact, among
funds in the second lowest QS quintile, the smallest funds actually underperform
the largest funds by 4 basis points per month. The results regarding ES, MI1, and
MI2 are generally similar. Specifically, the smallest funds outperform the largest
funds only for the least liquid portfolios. Overall, these results provide strong sup-
port for the hypothesis that liquidity is an important reason why fund size erodes
performance.
4. The Effect of Investment Style
Chan and Lakonishok (1995) find that the total trading costs are higher for
growth and high turnover funds. Intuitively, since growth and high turnover funds
tend to employ short-term trading strategies (e.g., momentum strategy), they have
relatively high demands for immediacy in their trades. Thus, one might expect
that the adverse effect of fund size on performance is greater among these funds.
To examine the effect of investment style on the relation between fund size
and fund performance, I divide all funds into 5 × 5 portfolios based on the av-
erage book-to-market deciles (or the fund’s turnover rate) and fund size. Table
7 reports the results on the performance of these portfolios. In Panel A, I sort
funds by average book-to-market decile and fund size. Results in Panel A indi-
cate that the diseconomies of scale are most pronounced among growth funds. In
particular, the smallest funds outperform the largest funds by 16 basis points per
month among growth funds. This evidence is consistent with the idea that growth
funds tend to have high demands for immediacy and, therefore, their trades are
associated with larger market impact and greater trading costs.
There is also some evidence that fund size erodes performance among value
funds; for funds with the highest book-to-market ratios, the smallest funds outper-
form the largest funds. Although value funds generally act as liquidity providers
and therefore should have low price impact, their holdings may be quite illiquid
because value funds tend to hold out of favor stocks, which have lower trading
volume and smaller market capitalizations. Therefore, these funds might still suf-
fer from significant diseconomies of scale.
18. 8/4/2008-1112–JFQA #43:3 Yan Page 758
758 Journal of Financial and Quantitative Analysis
TABLE 6
The Effect of Liquidity on the Relation between Fund Size and Fund Performance,
Portfolio Approach
Table 6 reports Carhart four-factor alphas (% per month) for portfolios sorted on liquidity and fund size. The sample period
is 1993–2002. I obtain mutual fund stockholdings from Thomson Financial. Fund characteristics are from the CRSP mutual
fund database. The sample includes all funds with an investment objective code of “AG” (Aggressive Growth), “LG”
(Long-Term Growth), or “GI” (Growth and Income). I combine different share classes into a single fund. I exclude index
funds and funds with total net assets less than $15 million. I exclude the first 18 months of data for each sample fund.
Transaction-level data are from the Trade and Quote (TAQ) database. QS, ES, MI1, and MI2 are liquidity measures as
defined in equations (1), (2), (4), and (5), respectively. Numbers in parentheses are t-statistics. ** indicates significance
at the 5% level.
Fund Size Quintile
Difference
Quintile 1 (small) 2 3 4 5 (large) 1−5
Panel A. QS
1 (low) −0.05 −0.03 −0.04 −0.09 −0.15 0.10 (1.16)
2 −0.10 −0.11 −0.17 −0.14 −0.05 −0.04 (−0.82)
3 −0.06 −0.12 −0.20 −0.26 −0.16 0.10 (1.48)
4 −0.15 −0.18 −0.15 −0.32 −0.32 0.17** (2.22)
5 (high) 0.19 −0.09 −0.10 −0.15 −0.17 0.35** (4.04)
Panel B. ES
1 (low) −0.05 −0.02 −0.05 −0.07 −0.11 0.06 (1.47)
2 −0.09 −0.10 −0.17 −0.17 −0.11 0.02 (0.31)
3 −0.05 −0.13 −0.18 −0.26 −0.07 0.02 (0.30)
4 −0.12 −0.17 −0.12 −0.29 −0.39 0.27** (2.99)
5 (high) 0.17 −0.12 −0.13 −0.17 −0.22 0.38** (3.81)
Panel C. MI1
1 (low) −0.15 −0.03 −0.06 −0.06 −0.08 −0.06 (−1.04)
2 −0.04 −0.08 −0.16 −0.19 −0.10 0.06 (0.64)
3 −0.05 −0.19 −0.23 −0.13 −0.13 0.08 (0.62)
4 −0.09 −0.20 −0.13 −0.25 −0.16 0.08 (0.61)
5 (high) 0.03 −0.09 −0.14 −0.31 −0.22 0.26** (3.06)
Panel D. MI2
1 (low) −0.11 −0.02 −0.06 −0.07 −0.06 −0.06 (−0.82)
2 −0.08 −0.10 −0.16 −0.19 −0.13 0.04 (0.45)
3 −0.02 −0.23 −0.28 −0.14 −0.16 0.14 (1.02)
4 −0.04 −0.26 −0.07 −0.23 −0.16 0.12 (1.21)
5 (high) 0.02 −0.10 −0.13 −0.24 −0.21 0.23** (2.63)
In Panel B of Table 7, I sort funds by turnover and fund size. I find evidence
that, among the three highest turnover quintiles, the smallest funds significantly
outperform the largest funds. In contrast, small funds do not outperform large
funds among the two lowest turnover quintiles.
As a comparison with Chen et al. (2004), I also sort funds into small-cap
funds and non-small-cap funds. I classify small-cap funds similarly as Chen et al.
(2004): Any fund that has ever had a Wiesenberger fund type code or Strategic
Insight’s fund objective code of “SCG” is classified as a small-cap fund. Panel C
of Table 7 presents the results. Consistent with Chen et al. (2004), funds in the
smallest size quintile significantly outperform funds in the largest size quintile
among small-cap funds but not among non-small-cap funds.
To check the robustness of my results, I also extend the analysis of value/
growth funds back to 1983 and the analysis of turnover to 1966.11 The results
for these extended periods are presented in Appendix A. Overall, these extended
sample periods display similar patterns to those in 1993–2002. That is, I find
the inverse relation between fund size and fund performance is stronger among
11 The turnover data are missing for all funds in 1991. I replace these missing data with the turnover
in 1990.
19. 8/4/2008-1112–JFQA #43:3 Yan Page 759
Yan 759
TABLE 7
The Effect of Investment Style on the Relation between Fund Size and Fund Performance,
Portfolio Approach
Table 7 reports Carhart four-factor alphas (% per month) for portfolios sorted on liquidity and fund size. The sample
period is 1993–2002. I obtain mutual fund stockholdings from Thomson Financial. Fund characteristics are from the CRSP
mutual fund database. The sample includes all funds with an investment objective code of “AG” (Aggressive Growth),
“LG” (Long-Term Growth), or “GI” (Growth and Income). I combine different share classes into a single fund. I exclude
index funds and funds with total net assets less than $15 million. I exclude the first 18 months of data for each sample
fund. Transaction-level data are from the Trade and Quote (TAQ) database. BM deciles are by NYSE breakpoints (decile
1 contains the highest book-to-market stocks). Numbers in parentheses are t-statistics. ** indicates significance at the
5% level.
Panel A. Portfolios Based on Book-to-Market Decile
Fund Size Quintile
Difference
BM Portfolio 1 (small) 2 3 4 5 (large) 1−5
1 (value) 0.08 −0.07 −0.11 −0.11 −0.09 0.17** (2.46)
2 −0.12 −0.02 −0.12 −0.15 −0.06 −0.06 (−0.86)
3 −0.16 −0.26 −0.13 −0.27 −0.16 −0.00 (−0.03)
4 −0.02 −0.15 −0.24 −0.27 −0.14 0.12** (1.77)
5 (growth) −0.05 −0.11 −0.06 −0.22 −0.21 0.16** (2.17)
Panel B. Portfolios Based on Fund Turnover
Fund Size Quintile
Difference
Turnover Portfolio 1 (small) 2 3 4 5 (large) 1−5
1 (low) −0.08 −0.03 −0.13 −0.09 −0.04 −0.04 (−0.70)
2 −0.12 −0.04 −0.15 −0.22 −0.11 −0.01 (−0.13)
3 −0.02 −0.11 −0.14 −0.16 −0.07 0.14** (1.81)
4 −0.07 −0.20 −0.23 −0.25 −0.24 0.17** (2.30)
5 (high) 0.04 −0.11 −0.16 −0.32 −0.19 0.23** (1.87)
Panel C. Portfolios Based on Whether Fund is a Small-Cap Fund
Fund Size Quintile
Difference
1 (small) 2 3 4 5 (large) 1−5
Small-Cap Funds 0.09 −0.12 −0.08 −0.27 −0.30 0.38** (3.87)
Non-Small-Cap Funds −0.08 −0.10 −0.12 −0.19 −0.12 0.04 (0.81)
growth funds and high turnover funds. However, these results are substantially
weaker both economically and statistically. In addition, the results are sensitive
to whether I use gross returns or net returns.
C. Empirical Results—Cross-Sectional Regression Approach
1. Method
In this section, I use a cross-sectional regression approach to examine the
effect of liquidity and investment style on the relation between fund size and fund
performance. Specifically, I regress one-month-ahead risk-adjusted fund returns
(i.e., alphas) on various fund characteristics including fund size and measures of
liquidity. Using this approach mitigates a concern that the relation between fund
size and performance may be driven by their mutual relations with other fund
characteristics.
For ease of comparison, I follow the approach of Chen et al. (2004) to es-
timate factor loadings for each fund. Specifically, I divide all funds into five
quintiles by fund size. I track these five portfolios for one quarter and then use the
entire time series of their monthly returns to estimate the loadings to various risk
factors (MKT, SMB, HML, and UMD). For each month, each fund inherits the
loadings of one of the five fund size quintiles that it belongs to. The one-month-
20. 8/4/2008-1112–JFQA #43:3 Yan Page 760
760 Journal of Financial and Quantitative Analysis
ahead expected fund return is then calculated by using the above factor loadings
along with the realized factor returns (including return on the risk-free asset) for
the next month. Finally, the risk-adjusted return is calculated as the difference
between the realized fund return and the expected fund return.
To gauge the robustness of my results to various asset pricing models, I again
consider four different models—the CAPM, the Fama-French three-factor model,
the Carhart four-factor model, and a conditional four-factor model. For brevity, I
only report results on the Fama-French three-factor alpha or Carhart four-factor
alpha in this section. The results for the CAPM alpha and the conditional four-
factor alpha are qualitatively similar and are available upon request.
The control variables used in my cross-sectional regressions are similar to
those used by Chen et al. (2004) and include fund family size, expense ratio, fund
age, turnover, total load, lagged fund flow, and lagged fund return. I calculate
both lagged fund flow and lagged fund return using the past one year’s data. In
particular, the lagged one-year fund flow is defined as:
TNAt+1 − TNAt (1 + Rt ) − MGTNAt
(8) FLOWt = ,
TNAt
where Rt is the fund return and MGTNAt is the assets acquired from merger.
The specification of the cross-sectional regression is as follows:
(9) αi,t = a + b1 LOGTNAi,t−1 + b2 LOGFAMi,t−1 + b3 EXPi,t−1
+ b4 LOGAGEi,t−1 + b5 TURNOVERi,t−1 + b6 LOADi,t−1
+ b7 LAGFLOWi,t−1 + b8 LAGFUNDRETi,t−1 + ei,t ,
where αt is the one-month-ahead risk-adjusted fund return, LOGTNA is the log-
arithm of fund TNA, LOGFAM is the logarithm of the fund family’s TNA, EXP
is the fund’s expense ratio, LOGAGE is the logarithm of the fund’s age, LOAD
is the fund’s total load, LAGFLOW is the lagged one-year fund flow, and
LAGFUNDRET is the lagged one-year fund return.
Following Chen et al. (2004), I use the Fama-MacBeth (1973) method. I
estimate the above cross-sectional regression each month and report the time-
series average coefficients. The statistical significance of the average coefficients
is evaluated based on Newey-West standard errors.
2. The Relation between Fund Size and Fund Performance
In this subsection, I first establish the relation between fund size and fund
performance. Table 8 reports the results. The first column presents the results
for the Fama-French three-factor alpha calculated using gross returns. Consistent
with Chen et al. (2004), I find that fund performance is significantly positively
related to the size of the fund family and lagged fund return. The positive as-
sociation between fund family size and performance is consistent with the idea
that large families may economize on certain fixed costs such as those on broker-
age service, research, marketing, and distribution. The positive relation between
lagged fund return and fund performance suggests that there is some persistence
in fund performance. In addition, I find a negative relation between fund returns
21. 8/4/2008-1112–JFQA #43:3 Yan Page 761
Yan 761
TABLE 8
The Effect of Fund Size on Fund Performance, Cross-Sectional Regression Approach
Table 8 examines the relation between fund size and fund performance. The sample period is 1993–2002. I obtain mutual
fund stockholdings from Thomson Financial. Fund characteristics are from the CRSP mutual fund database. The sample
includes all funds with an investment objective code of “AG” (Aggressive Growth), “LG” (Long-Term Growth), or “GI”
(Growth and Income). I combine different share classes into a single fund. I exclude index funds and funds with total net
assets less than $15 million. I exclude the first 18 months of data for each sample fund. Gross returns are calculated by
adding back 1/12 of annual expense ratio to the net return. Stock characteristics are from Compustat and the CRSP stock
database. I calculate both lagged fund flow and lagged fund return using past one year’s data. Transaction-level data are
from the Trade and Quote (TAQ) database. QS, ES, MI1, and MI2 are liquidity measures as defined in equations (1), (2),
(4), and (5), respectively. I use the Fama-MacBeth (1973) method. Numbers in parentheses are t-statistics that are based
on Newey-West standard errors. ** indicates significance at the 5% level.
Dependent Variable
Gross Return Net Return
Independent Variables 3-Factor α 4-Factor α 3-Factor α 4-Factor α
Intercept −0.288 −0.258 −0.311 −0.280
(−0.83) (−0.74) (−0.89) (−0.81)
Log TNA −0.045** −0.054** −0.044** −0.053**
(−2.81) (−3.30) (−2.75) (−3.25)
Log Family TNA 0.020** 0.019** 0.020** 0.019**
(2.66) (2.61) (2.63) (2.59)
Expense Ratio 0.028 0.028 −0.045 −0.046
(0.33) (0.32) (−0.53) (−0.53)
Log Fund Age 0.025 0.026 0.025 0.026
(1.53) (1.63) (1.55) (1.64)
Turnover 0.039 0.039 0.038 0.038
(0.98) (0.98) (0.97) (0.97)
Total Load −0.005 −0.005 −0.006 −0.006
(−0.68) (−0.71) (−0.81) (−0.83)
Lagged Fund Flow −0.111** −0.114** −0.111** −0.115**
(−2.39) (−2.42) (−2.40) (−2.42)
Lagged Fund Return 0.028** 0.028** 0.028** 0.028**
(2.91) (2.90) (2.94) (2.94)
Average R 2 0.21 0.21 0.21 0.21
and lagged fund flow, suggesting that large fund inflows may disrupt fund man-
agement and adversely affect fund performance.
More importantly, the fund performance is significantly negatively related to
lagged fund size. This result is statistically significant at the 1% level regardless of
which alpha measure I use. The effect of size on performance is also economically
significant. On average, a two-standard deviation increase in the logarithm of
fund TNA is associated with a decrease in fund performance by almost 18 basis
points per month, which translates to over 2% per year. In comparison, Chen et
al. (2004) document that in their sample period a two-standard deviation increase
in the logarithm of fund TNA is associated with a decrease of performance by
less than 1% per year. This is consistent with my portfolio results where I show
that the return differential between small funds and large funds is greater in my
sample than in those documented in Chen et al. (2004).
The results for the Carhart four-factor alpha and alphas calculated using net
returns are similar to those reported above. Overall, consistent with Chen et al.
(2004), I find strong and robust evidence of an inverse relation between fund size
and fund performance.
22. 8/4/2008-1112–JFQA #43:3 Yan Page 762
762 Journal of Financial and Quantitative Analysis
3. The Effect of Liquidity
To test if the diseconomies of scale are attenuated by liquidity, I include
in the cross-sectional regressions an interaction term between fund liquidity and
lagged fund size. If fund size erodes fund performance because of liquidity, then
one would expect the coefficient on this interaction term to be significantly nega-
tive, indicating that fund size erodes performance more among funds that are less
liquid.
Panel A of Table 9 reports the results for the spread-based liquidity mea-
sures. The dependent variable is the Carhart four-factor alpha.12 Similar to Table
8, I find that fund performance is significantly positively related to fund family
size and lagged fund return, while significantly negatively related to lagged fund
flow. More importantly, I find that the coefficient in front of the interaction term
between QS (or ES) and lagged fund size is negative in all four regressions. This
result suggests that the inverse relation between fund size and performance is
more negative for less liquid funds. In regressions (1) and (2), the coefficients on
the interaction term are statistically significant at the 1% level (t-stat = −3.05 and
−3.05). When I add lagged fund size in regressions (3) and (4), the coefficients
on the interaction term are still negative but not statistically significant (t-stat =
−1.21 and −1.40). The above insignificant result might be partly explained by
endogenous liquidity. As stated in the Introduction, the presence of endogenous
liquidity would bias against finding a significant positive effect of illiquidity on
the inverse relation between fund size and fund performance.
Panel B of Table 9 presents the results regarding market impact measures.
The qualitative results are similar to those reported in Panel A; the coefficient on
the interaction term between market impact and lagged fund size is negative in all
regressions and is statistically significant in two out of four regressions. Overall,
results in Table 9 indicate that the inverse relation between fund size and fund
performance is stronger among funds that hold less liquid portfolios.
4. The Effect of Investment Style
To examine the effect of investment style, I follow an approach similar to
that in the previous subsection. Specifically, I include the interaction term be-
tween book-to-market deciles (or turnover rate) and lagged fund size in the cross-
sectional regression. Table 10 reports the results. I find that fund performance is
positively related to fund family size and negatively related to lagged fund size.
Similar to Table 9, I find that the coefficients in front of the interaction terms
are all negative, indicating that the inverse relation between fund size and per-
formance is more pronounced for growth and high turnover funds. Overall, the
cross-sectional regression results reported in Tables 9 and 10 are consistent with
the hypothesis that liquidity is an important reason why fund size erodes perfor-
mance.
I again extend the analysis of growth/value funds back to 1983 and the anal-
ysis of turnover to 1966. The results are reported in Appendix B. Overall, the
results for these extended sample periods are similar to those reported for 1993–
12 Results on the CAPM-alpha, Fama-French three-factor alpha, or the conditional four-factor alpha
are qualitatively similar. For brevity, these results are not reported.