AWS Community Day CPH - Three problems of Terraform
130504 paper 은경
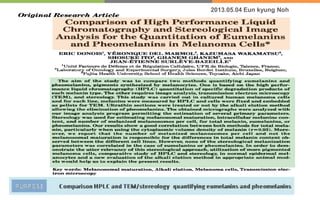
1. Comparison HPLC and TEM/stereology quantifying eumelanins and pheomelanins
PURPOS
E
2013.05.04 Eun kyung Noh
2. INTRODUCTION_concept
l MELANOCYTE l
Pigment cells that originate in the neural crest
Specialized organelle synthesizing melanin
l MELANIN l
Two types : eumelanin (black-brown, elliptic and lamellar/fibrillar in mammals)
pheomelanin (yellow-reddish, spherical with a spotty pattern in mammals)
l MELANOGENESIS l
L-tyrosine to L-3,4-dihydroxyphenylalanine(L-DOPA) and oxidation to DOPA-quinone by tyrosinase
After two stages, seperate to eumelanogenesis and pheomelanogenesis
- eumelanogenesis : DOPA-quinone to DOPAchrome, DOPAchrome to DHICA-eumelanin by TRP-2(DCT) and TRP1
DOPAchrome to DHI-eumelanin
- pheomelanogenesis : DOPA-quinone to cysteinylDOPA
PART
1
4. MATERIAL and METHODS_stereological analysis
PART
2
Cell lines : HBL, LND1
DOR, BEU
IGR3, ARN
Medium : Ham F10 medium
+10% FCS
+1% penicillinc-streptomycin
+1% kanamycin
+1% of 200mM glutamine sol.
Melanoma cells
Melanoma cells fixation in suspension
The technique to obtain (near) spherical
melanocytes and embed them as pellet
Melanoma cell were detached, pelleted,
washed, fixed in suspension → ethanol
dehydration → infiltration with ethanol : 1,2-
epoxypropane, 1,2-epoxypropane, 1,2-
epoxypropane : embeding medium
▶ Homogenization and Sampling
in pyramidal tipped plastic capsules
Cut into eight pieces
(4 summit part, 4 basal part)
Randomly selected, re-embeded in EPON
Fixation and Embedding
70 nm ultrathin section were cut
with Ultracut S ultramicrotome
equipped with a diamond knife
(Diatome)
Submittion to chloroform vapor to
correct possible deformation due to
compression
Collecting with 150 mesh copper
grids
Staining with 2% uranyl acetate &
post-staining 0.2% lead citrate
Observation with a Jeol 1200-EX
Transmission Electron Microscope
Transmission
electron
microscopy
6. MATERIAL and METHODS_stereological analysis
PART
2
Permittion to dissolve pheomelanin
on ultrathin sections
with an acceptable specificity
Internal structure of the spheroid
melanosomes is dissolved by
treatment with 0.5 N NaOH solution,
whereas the ellipsoid melanosomes
are not affected
(J Invest Dermatol, 1993, Vol. 100 ,pp. 172S-175S)
Each grid supporting the ultrathin
section was deposited on a drop of
300mM NaOH, 45 min
Rinsed with bi-distilled water
Alkali elution of
pheomelanin
Micrograph-scanner
Semper 6 plus image analysis
software
Data : An(nuclear area)
Ace(cell area)
Ami(melanin area)
Nmp(number of melanin
particles)
Nco(number of connection
between melanin particles)
Primary data/2-D measurements
were calculated to 3-D melanization
parameters by stereology
Pheomelanin to eumelanin ratio(P/E)
Image analysis
and stereology
30 cells systematically sampled
Ellipsoidal shape formula :
(D1 : long axis diameter, D2 : short
axis diameter)
Mean cell diameter(MCD) :
(vce : cell volume)
Estimation of mean
cell volume
7. MATERIAL and METHODS_HPLC analysis
PART
2
Concentration of eumelanin and pheomelanin in extraction of 106 cells
• Eumelanin to pyrrole-2,3,5-tricarboxylic acid(PTCA) : permanganate oxidation
• Pheomelanin to aminohydroxyphenylalanine(AHP) : hydriodic acid hydrolysis
▶ total melanin amount formula : TM(μg/106cells) = 50xPTCA(μg/106cells) + 50xAHP(μg/106cells)
HPLC determination of eumelanin and pheomelanin in melanoma cells
8. RESULTS and DISCUSSION_stereological data
PART
3
Figure 2 Total melanin stereological data obtained
for the 6 melanoma cell lines used in this study
A : Melanin volume per average melanoma cells
B : Melanosomal maturation or mean melanin area
per average melanized melanosome
9. RESULTS and DISCUSSION_stereological data
PART
3
Figure 3 Pheomelanin stereological data obtained for the
6 melanoma cell lines used in this study
A : Phomelanin volume per average melanoma cells
B : Melanosomal maturation or mean melanin area per
average melanized melanosome
Figure 4 Eumelanin stereological data obtained for the 6
melanoma cell lines used in this study
A : Eumelanin volume per average melanoma cells
B : Melanosomal maturation or mean melanin area per
average melanized melanosome
10. RESULTS and DISCUSSION_HPLC data
PART
3
Figure 5 Linear regression analysis of HPLC and
stereological data(cytoplasmic volume density of
melanin) for total melanin
11. RESULTS and DISCUSSION_HPLC data
PART
3
Figure 6 Linear regression analysis of HPLC and
stereological data for eumelanin and pheomelanin.
In both cases the number of melanized melanosomes was
uesd as stereological parameter.
A : Eumelanin
B : Pheomelanin
Figure 7 Linear regression analysis of the relationship
between the HPLC-derived P/E ratio and stereology-
derived P/E ratios (mean of the P/E ratios obtained in S
and B sections)
12. CONCLUSION
PART
4
• Stereological image analysis method could be an interesting approach for the quantitative of melanins
• Advantage of Stereological method is that it requires a low number of pigment cells
• Stereological method needs supplementary confrontations with the HPLC chemical approach to clarify these results
(J Invest Dermatol, 1993, Vol. 100 ,pp. 172S-175S)