Industrial Production Index IPI

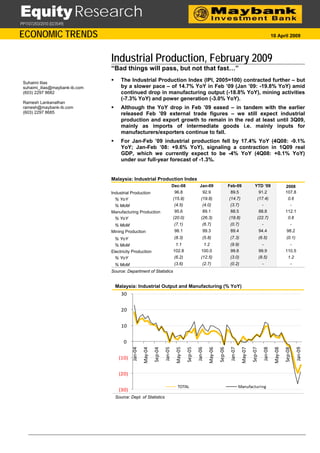
“Bad things will pass, but not that fast…” The Industrial Production Index (IPI, 2005=100) contracted further – but by a slower pace – of 14.7% YoY in Feb ’09 (Jan ’09: -19.8% YoY) amid continued drop in manufacturing output (-18.8% YoY), mining activities (-7.3% YoY) and power generation (-3.0% YoY). Although the YoY drop in Feb ’09 eased – in tandem with the earlier released Feb ’09 external trade figures – we still expect industrial production and export growth to remain in the red at least until 3Q09, mainly as imports of intermediate goods i.e. mainly inputs for manufacturers/exporters continue to fall. For Jan-Feb ’09 industrial production fell by 17.4% YoY (4Q08: -9.1% YoY; Jan-Feb ’08: +9.6% YoY), signaling a contraction in 1Q09 real GDP, which we currently expect to be -4% YoY (4Q08: +0.1% YoY) under our full-year forecast of -1.3%.

Recommended
More Related Content
More from Boyboy cute
More from Boyboy cute (20)
Recently uploaded
Recently uploaded (20)
Industrial Production Index IPI
- 1. Equity Research PP11072/03/2010 (023549) ECONOMIC TRENDS 10 April 2009 Industrial Production, February 2009 “Bad things will pass, but not that fast…” The Industrial Production Index (IPI, 2005=100) contracted further – but Suhaimi Ilias by a slower pace – of 14.7% YoY in Feb ’09 (Jan ’09: -19.8% YoY) amid suhaimi_ilias@maybank-ib.com continued drop in manufacturing output (-18.8% YoY), mining activities (603) 2297 8682 (-7.3% YoY) and power generation (-3.0% YoY). Ramesh Lankanathan Although the YoY drop in Feb ’09 eased – in tandem with the earlier ramesh@maybank-ib.com (603) 2297 8685 released Feb ’09 external trade figures – we still expect industrial production and export growth to remain in the red at least until 3Q09, mainly as imports of intermediate goods i.e. mainly inputs for manufacturers/exporters continue to fall. For Jan-Feb ’09 industrial production fell by 17.4% YoY (4Q08: -9.1% YoY; Jan-Feb ’08: +9.6% YoY), signaling a contraction in 1Q09 real GDP, which we currently expect to be -4% YoY (4Q08: +0.1% YoY) under our full-year forecast of -1.3%. Malaysia: Industrial Production Index Dec-08 Jan-09 Feb-09 YTD ‘09 2008 96.8 92.9 89.5 91.2 107.8 Industrial Production (15.9) (19.8) (14.7) (17.4) 0.6 % YoY - - (4.5) (4.0) (3.7) % MoM 95.6 89.1 88.5 88.8 112.1 Manufacturing Production (20.0) (26.3) (18.8) (22.7) 0.6 % YoY - - (7.1) (6.7) (0.7) % MoM 98.1 99.3 89.4 94.4 98.2 Mining Production (8.3) (5.8) (7.3) (6.5) (0.1) % YoY 1.1 1.2 (9.9) - - % MoM 102.8 100.0 99.8 99.9 110.5 Electricity Production (6.2) (12.5) (3.0) (8.5) 1.2 % YoY (3.6) (2.7) (0.2) - - % MoM Source: Department of Statistics Malaysia: Industrial Output and Manufacturing (% YoY) 30 20 10 0 Jan‐07 Jan‐08 Jan‐09 Jan‐04 Jan‐05 Jan‐06 Sep‐07 May‐08 Sep‐08 Sep‐05 May‐06 Sep‐06 May‐07 May‐04 Sep‐04 May‐05 (10) (20) TOTAL Manufacturing (30) Source: Dept. of Statistics
- 2. Industrial Production, Feb 2009 Malaysia: Mining and Electricity Output (% YoY) 20 15 10 5 0 Sep‐04 Sep‐05 Sep‐06 Sep‐07 Sep‐08 Jan‐04 Jan‐05 Jan‐06 Jan‐07 Jan‐08 Jan‐09 May‐04 May‐05 May‐06 May‐07 May‐08 (5) (10) Mining Electricity (15) Source: Dept. of Statistics The drop in industrial production continued in Feb ’09 but at a slower pace of 14.7% YoY (Jan ‘09: -19.8% YoY). This was within our expectations of -15% YoY while consensus estimate was -13.5% YoY. ... amid further falls in all three components. All three segments declined, led by manufacturing (-18.8% YoY), mining (-7.3% YoY on a 4.5% YoY drop in crude petroleum output and 2.8% YoY fall in natural gas output) and electricity (-3% YoY). First two months’ data signals contraction in 1Q09 real GDP… For the first two months of this year, industrial production fell by 17.4% YoY vs. the 9.1% YoY drop in 4Q08 and 9.6% YoY growth in Jan-Feb ’08, foretelling a contraction in 1Q09 real GDP growth. Our 2009 real GDP forecast of -1.3% assumes a 4% YoY contraction in the economy in the first three months (4Q08: +0.1% YoY). Malaysia: Quarterly Industrial Output & Real GDP (% YoY) 12 30 10 20 8 10 6 4 0 Jan-Feb 09 1Q00 3Q00 1Q01 3Q01 1Q02 3Q02 1Q03 3Q03 1Q04 3Q04 1Q05 3Q05 1Q06 3Q06 1Q07 3Q07 1Q08 3Q08 2 (10) 0 (20) (2) Industrial Production (LHS) Real GDP (RHS) Source: Dept. of Statistics ECONOMIC TRENDS ▪ 10 April 2009 Page 2 of 6
- 3. Industrial Production, Feb 2009 Most key East Asian economies also recorded smaller YoY contractions in Feb ’09, but the drop in major economies worsened… Like Malaysia, most of the East Asian countries that have released industrial production figures for Feb ’09 (e.g. South Korea, Taiwan, Singapore, Thailand) recorded smaller YoY contractions compared to the previous month’s figures. Major emerging economies like Russia and Brazil also registered similar trends. Interestingly, China’s Feb ’09 factory output growth rebounded by 11% YoY (Jan ‘09: -3.4% YoY), fuelling speculation that the huge fiscal stimulus package is taking effect on the economy. The rebound in China’s industrial output data coincided with an improvement in the Purchasing Managers Index in the last four months to pass the 50 mark to 52.4 in Mar ’09, after the sharp slump between Apr and Nov last year. Meanwhile Vietnam ‘s industrial output growth for Mar ’09 eased to 2.4% YoY after the rebound to 14.9% YoY in Feb ’09, from the 4.4% YoY contraction in Jan ’09. Major advanced economies – US, Japan and UK – continue to see worsening declines in industrial production. Global Industrial Production (% YoY) 20 8 6 15 4 10 2 5 0 0 (2) Apr‐08 Feb‐07 Sep‐07 Jul‐03 Jul‐06 Jun‐09 Mar‐01 Dec‐02 Mar‐04 Dec‐05 Oct‐01 Oct‐04 Aug‐00 Jan‐00 Nov‐08 May‐02 May‐05 (5) (4) (10) (6) (15) (8) (20) (10) Global Industrial Production (Weighted) (YoY) OECD LEI (RHS) Source: Bloomberg, Maybank-IB Global: Industrial Production (% YoY) Aug-08 Sep-08 Oct-08 Nov-08 Dec-08 Jan-09 Feb-09 US (1.9) (6.2) (4.3) (5.9) (8.2) (10.7) (11.8) EU (1.5) (3.1) (5.8) (8.8) (10.2) (13.8) - Japan (6.9) 0.2 (7.1) (16.6) (20.8) (31.0) (38.4) Germany 1.6 (1.8) (3.7) (6.9) (12.0) (19.3) - UK (3.2) (3.5) (5.9) (7.9) (9.3) (11.4) (12.5) France (2.6) (2.0) (7.7) (8.8) (10.2) (13.8) - Italy (5.7) (5.8) (6.9) (10.1) (14.3) (16.7) - Canada 8.6 8.3 9.5 5.8 2.4 1.4 1.6 China 12.8 11.4 8.2 5.4 5.7 (3.4) 11.0 Russia 4.7 6.4 1.7 (8.7) (10.2) (15.9) (13.2) Brazil 2.0 9.7 1.1 (6.4) (14.8) (17.4) (17.0) India 1.7 6.0 (0.3) 1.7 (0.6) (0.5) - S. Korea 1.9 6.3 (1.9) (13.8) (18.7) (25.5) (10.3) Taiwan 0.7 (1.2) (12.6) (28.3) (32.0) (43.3) (27.1) Singapore (11.9) 3.2 (12.2) (6.6) (13.5) (29.8) (22.4) Malaysia 1.2 (1.7) (2.8) (8.2) (15.9) (19.8) (17.7) Thailand 7.8 4.3 2.4 (7.7) (18.5) (21.2) (19.8) Indonesia 2.9 (0.8) 6.2 1.0 (2.8) (6.1) - Philippines 6.3 12.4 8.7 0.1 (9.7) (16.9) - Vietnam * 16.1 15.2 15.4 15.0 11.8 (4.4) 14.9 Source: Bloomberg, CEIC * Mar ‘09 growth slowed to 2.4% YoY ECONOMIC TRENDS ▪ 10 April 2009 Page 3 of 6
- 4. Industrial Production, Feb 2009 But expect Malaysia’s industrial production to remain in the red up to 3Q09… Based on the last two recessions in 1998 and 2001, industrial production – specifically manufacturing output – fell continuously for 12-13 months (1998 recession: 12 months, from Feb ’98 to Jan ’99; 2001 recession: 13 months, from Mar ’01 to Mar ’02). So far, Malaysia’s IPI has recorded six consecutive months of declines since Oct ’08, implying that industrial production can be expected to stay in the red for the first three quarters of 2009. Moreover, imports of intermediate goods fell YoY and MoM for the fifth consecutive month in Feb ’09, indicating manufacturers are not re-building their inventories of raw materials, parts, components and semi-finished goods, which implies further declines in output in the next 1-3 months after Feb ’09. Moreover, the latest data on the index of leading economic indicators of OECD, BRIC and East Asia, showed that the global economic downturn is still in progress until early-3Q09. Malaysia: Months of Continuous YoY Drop in Industrial Production Sep 08 - Feb 09 Mar 01 - Mar 02 Feb 98 - Jan 99 0 2 4 6 8 10 12 14 Source: Department of Statistics Malaysia: Imports of Intermediate Goods (% YoY) 80 60 40 20 0 Apr-99 Oct-01 Apr-04 Oct-06 Sep-99 Aug-02 Sep-04 Aug-07 Nov-98 Dec-00 Nov-03 Dec-05 Nov-08 Jan-98 Jun-98 Jan-03 Jun-03 Jan-08 Jun-08 Jul-00 Jul-05 May-01 May-06 Feb-00 Mar-02 Feb-05 Mar-07 (20) % YoY % MoM (40) Source: Department of Statistics ECONOMIC TRENDS ▪ 10 April 2009 Page 4 of 6
- 5. Industrial Production, Feb 2009 Index of Leading Economic Indicators (12-month rate of change) 20 15 10 5 0 Jan-96 Oct-96 Jul-97 Jan-99 Oct-99 Jul-00 Jan-02 Oct-02 Jul-03 Jan-05 Oct-05 Jul-06 Jan-08 Oct-08 Jul-09 Apr-98 Apr-01 Apr-04 Apr-07 (5) (10) BRIC East Asia ex Japan and China OECD - Total (15) Source: Bloomberg ECONOMIC TRENDS ▪ 10 April 2009 Page 5 of 6
- 6. Industrial Production, Feb 2009 Definition of Ratings Maybank Investment Bank Research uses the following rating system: STRONG BUY Total return is expected to exceed 20% in the next 12 months; high conviction call BUY Total return is expected to be above 10% in the next 12 months HOLD Total return is expected to be between above 0% to 10% in the next 12 months FULLY VALUED Total return is expected to be between -10% and 0% in the next 12 months SELL Total return is expected to be below -10% in the next 12 months TRADING BUY Total return is expected to be between 10-20% in the next 6 months arising from positive newsflow e.g. mergers and acquisition, corporate restructuring, and potential of obtaining new projects. However, the upside may or may not be sustainable WITHHELD Rating and target price withheld in the exercise of Maybank Investment Bank 's duties under the applicable laws, rules, regulations, policies and procedures for the time being in force, and is not a reflection of expected returns. Applicability of Ratings The respective analyst maintains a coverage universe of stocks, the list of which may be adjusted according to needs. Investment ratings are only applicable to the stocks which form part of the coverage universe. Reports on companies which are not part of the coverage do not carry investment ratings as we do not actively follow developments in these companies. Some common terms abbreviated in this report (where they appear): Adex = Advertising Expenditure FCF = Free Cashflow PE = Price Earnings BV = Book Value FV = Fair Value PEG = PE Ratio To Growth CAGR = Compounded Annual Growth Rate FY = Financial Year PER = PE Ratio Capex = Capital Expenditure FYE = Financial Year End QoQ = Quarter-On-Quarter CY = Calendar Year MoM = Month-On-Month ROA = Return On Asset DCF = Discounted Cashflow NAV = Net Asset Value ROE = Return On Equity DPS = Dividend Per Share NTA = Net Tangible Asset ROSF = Return On Shareholders’ Funds EBIT = Earnings Before Interest And Tax P = Price WACC = Weighted Average Cost Of Capital EBITDA = EBIT, Depreciation And Amortisation P.A. = Per Annum YoY = Year-On-Year EPS = Earnings Per Share PAT = Profit After Tax YTD = Year-To-Date EV = Enterprise Value PBT = Profit Before Tax Disclaimer This report is for information purposes only and under no circumstances is it to be considered or intended as an offer to sell or a solicitation of an offer to buy the securities referred to herein. Investors should note that income from such securities, if any, may fluctuate and that each security’s price or value may rise or fall. Opinions or recommendations contained herein are in form of technical ratings and fundamental ratings. Technical ratings may differ from fundamental ratings as technical valuations apply different methodologies and are purely based on price and volume-related information extracted from Bursa Malaysia Securities Berhad in the equity analysis. Accordingly, investors may receive back less than originally invested. Past performance is not necessarily a guide to future performance. This report is not intended to provide personal investment advice and does not take into account the specific investment objectives, the financial situation and the particular needs of persons who may receive or read this report. Investors should therefore seek financial, legal and other advice regarding the appropriateness of investing in any securities or the investment strategies discussed or recommended in this report. The information contained herein has been obtained from sources believed to be reliable but such sources have not been independently verified by Maybank Investment Bank Bhd and consequently no representation is made as to the accuracy or completeness of this report by Maybank Investment Bank Bhd and it should not be relied upon as such. Accordingly, no liability can be accepted for any direct, indirect or consequential losses or damages that may arise from the use or reliance of this report. Maybank Investment Bank Bhd, its affiliates and related companies and their officers, directors, associates, connected parties and/or employees may from time to time have positions or be materially interested in the securities referred to herein and may further act as market maker or may have assumed an underwriting commitment or deal with such securities and may also perform or seek to perform investment banking services, advisory and other services for or relating to those companies. Any information, opinions or recommendations contained herein are subject to change at any time, without prior notice. This report may contain forward looking statements which are often but not always identified by the use of words such as “anticipate”, “believe”, “estimate”, “intend”, “plan”, “expect”, “forecast”, “predict” and “project” and statements that an event or result “may”, “will”, “can”, “should”, “could” or “might” occur or be achieved and other similar expressions. Such forward looking statements are based on assumptions made and information currently available to us and are subject to certain risks and uncertainties that could cause the actual results to differ materially from those expressed in any forward looking statements. Readers are cautioned not to place undue relevance on these forward- looking statements. Maybank Investment Bank Bhd expressly disclaims any obligation to update or revise any such forward looking statements to reflect new information, events or circumstances after the date of this publication or to reflect the occurrence of unanticipated events. This report is prepared for the use of Maybank Investment Bank Bhd's clients and may not be reproduced, altered in any way, transmitted to, copied or distributed to any other party in whole or in part in any form or manner without the prior express written consent of Maybank Investment Bank Bhd and Maybank Investment Bank Bhd accepts no liability whatsoever for the actions of third parties in this respect. This report is not directed to or intended for distribution to or use by any person or entity who is a citizen or resident of or located in any locality, state, country or other jurisdiction where such distribution, publication, availability or use would be contrary to law or regulation. Published / Printed by Maybank Investment Bank Berhad (15938-H) (Formerly known as Aseambankers Malaysia Berhad) (A Participating Organisation of Bursa Malaysia Securities Berhad) 33rd Floor, Menara Maybank, 100 Jalan Tun Perak, 50050 Kuala Lumpur Tel: (603) 2059 1888; Fax: (603) 2078 4194 Stockbroking Business: Level 8, MaybanLife Tower, Dataran Maybank, No.1, Jalan Maarof 59000 Kuala Lumpur Tel: (603) 2297 8888; Fax: (603) 2282 5136 http://www.maybank-ib.com ECONOMIC TRENDS ▪ 10 April 2009 Page 6 of 6