SlideShare a Scribd company logo
1 of 1
Download to read offline
THE IMPACT OF AGING ON FINGERPRINT QUALITY
The purpose of this study is to determine the impact of age on fingerprint quality. We will be comparing two different sets of data from two different sensors,
Digital Persona U.are.U and Fujitsu Touch. The data that is being used to answer our question includes, quality score, age, and number of minutiae points for
only the right index finger. By taking these two sets of data and comparing them we plan on being able to determine if there are similarities between the results.
We will be looking to see if the quality score decreases with age and if the number of minutiae points increases with age.
Chelan Simonds, Darryl McLaurin, Michael Brockly, Stephen Elliott
Overview
Digital Persona U.are.U
18-25 26 - 63
Fujitsu Touch
18-25 26 - 61
Ages 18-25 Ages 26 & Above
# People
Mean
Quality
Mean
Minutiae
# People
Mean
Quality
Mean
Minutiae
Digital Persona
U.are.U
55 73.82 38.03 11 69.87 45.17
Fujitsu Touch 146 83.32 28.14 36 78.69 31.15
Results Conclusion
All the quality scores for 18-25
year olds. Most of the quality
scores are above 70. There is an
outlier with a quality score of 28.
Number of minutiae points for 18-
25 year olds. Most fingerprints
have between 35 and 45 minutiae
points.
All the quality scores for 26 years
old and above. Most of the quality
scores are between 65 and 75.
There is an outlier with a quality
score of 26.
Number of minutiae points for 26
years old and above. Most
fingerprints have 45 minutiae points.
There are a few outliers with 108,
116, and 121 minutiae points.
All the quality scores for 18-25
year olds. Most of the quality
scores are above 80. There is an
outlier with a quality score of 44.
Number of minutiae points for 18-
25 year olds. Most fingerprints
have around 30 minutiae points.
All the quality scores for 26 years
old and above. Most of the quality
scores are 75 and above. There are
some outliers who have quality
scores of 43 and 47.
Number of minutiae points for 26
years old and above. Most
fingerprints have a mean of 30
minutiae points. There is an outlier
with 60 minutiae points.
This table shows the mean
quality scores and mean
number of minutiae points for
ages 18-25 and ages 26 and
above. The data came from
analyzing the Digital Persona
U.are.U and Fujitsu Touch
fingerprint sensors.
We have determined that people in that 18-25 age
range have better quality pictures. For each sensor
the difference between the mean quality scores for
the two age groups was an average of 5 which is not
a very significant difference. Another thing we noticed
was that the Fujitsu Touch had higher mean quality
scores for each group by 10. This could also be due
to the fact that Fujitsu Touch has over double the
amount of people represented in each age group. We
also can conclude that ages 26 and above have a
greater number of minutiae points.

More Related Content

Similar to (Spring 2013) The Impact of Aging on Fingerprint Quality

Data Analysis Projectnour91318iul2024.pptx
Data Analysis Projectnour91318iul2024.pptxData Analysis Projectnour91318iul2024.pptx
Data Analysis Projectnour91318iul2024.pptx
nhamze865
 
(2007) Impact of Age Groups on Fingerprint Recognition Performance
(2007) Impact of Age Groups on Fingerprint Recognition Performance(2007) Impact of Age Groups on Fingerprint Recognition Performance
(2007) Impact of Age Groups on Fingerprint Recognition Performance
International Center for Biometric Research
 
A study of critical flickering fusion frequency rate in media players
A study of critical flickering fusion frequency rate in media playersA study of critical flickering fusion frequency rate in media players
A study of critical flickering fusion frequency rate in media players
Chiranjeevi JIPMER Puducherry
 
Adobe 2012 mobile consumer survey results
Adobe 2012 mobile consumer survey resultsAdobe 2012 mobile consumer survey results
Adobe 2012 mobile consumer survey results
Dung Tri
 
Skills and education
Skills and educationSkills and education
Skills and education
Matt Jones
 
(2006) Impact of Image Quality on Performance: Comparison of Young and Elderl...
(2006) Impact of Image Quality on Performance: Comparison of Young and Elderl...(2006) Impact of Image Quality on Performance: Comparison of Young and Elderl...
(2006) Impact of Image Quality on Performance: Comparison of Young and Elderl...
International Center for Biometric Research
 
Skills in New Zealand and around the world
Skills in New Zealand and around the worldSkills in New Zealand and around the world
Skills in New Zealand and around the world
Matt Jones
 

Similar to (Spring 2013) The Impact of Aging on Fingerprint Quality (19)

Data Analysis Projectnour91318iul2024.pptx
Data Analysis Projectnour91318iul2024.pptxData Analysis Projectnour91318iul2024.pptx
Data Analysis Projectnour91318iul2024.pptx
 
Can Concussions Be Diagnosed Using the Microsoft Kinect and Machine Learning?
Can Concussions Be Diagnosed Using the Microsoft Kinect and Machine Learning?Can Concussions Be Diagnosed Using the Microsoft Kinect and Machine Learning?
Can Concussions Be Diagnosed Using the Microsoft Kinect and Machine Learning?
 
(2007) Impact of Age Groups on Fingerprint Recognition Performance
(2007) Impact of Age Groups on Fingerprint Recognition Performance(2007) Impact of Age Groups on Fingerprint Recognition Performance
(2007) Impact of Age Groups on Fingerprint Recognition Performance
 
(Spring 2013) The Effect of MOET Values and Age on Image Quality
(Spring 2013) The Effect of MOET Values and Age on Image Quality(Spring 2013) The Effect of MOET Values and Age on Image Quality
(Spring 2013) The Effect of MOET Values and Age on Image Quality
 
A study of critical flickering fusion frequency rate in media players
A study of critical flickering fusion frequency rate in media playersA study of critical flickering fusion frequency rate in media players
A study of critical flickering fusion frequency rate in media players
 
F0321032034
F0321032034F0321032034
F0321032034
 
Basic statistical & pharmaceutical statistical applications
Basic statistical & pharmaceutical statistical applicationsBasic statistical & pharmaceutical statistical applications
Basic statistical & pharmaceutical statistical applications
 
Adobe 2012 mobile consumer survey results
Adobe 2012 mobile consumer survey resultsAdobe 2012 mobile consumer survey results
Adobe 2012 mobile consumer survey results
 
Skills and education
Skills and educationSkills and education
Skills and education
 
Biostatistics Workshop: Sample Size & Power
Biostatistics Workshop: Sample Size & PowerBiostatistics Workshop: Sample Size & Power
Biostatistics Workshop: Sample Size & Power
 
How NOT to Lie with Statistics
How NOT to Lie with StatisticsHow NOT to Lie with Statistics
How NOT to Lie with Statistics
 
Views about Automation
Views about AutomationViews about Automation
Views about Automation
 
Poster: Equivalence of Electronic and Paper Administration of PRO
Poster: Equivalence of Electronic and Paper Administration of PROPoster: Equivalence of Electronic and Paper Administration of PRO
Poster: Equivalence of Electronic and Paper Administration of PRO
 
GSA Falls Poster FINAL
GSA Falls Poster FINALGSA Falls Poster FINAL
GSA Falls Poster FINAL
 
(2006) Impact of Image Quality on Performance: Comparison of Young and Elderl...
(2006) Impact of Image Quality on Performance: Comparison of Young and Elderl...(2006) Impact of Image Quality on Performance: Comparison of Young and Elderl...
(2006) Impact of Image Quality on Performance: Comparison of Young and Elderl...
 
CDC’s Program to Incubate Games for Public Health Awareness
CDC’s Program to Incubate Games for Public Health AwarenessCDC’s Program to Incubate Games for Public Health Awareness
CDC’s Program to Incubate Games for Public Health Awareness
 
Doctoralia Report on Health and the Internet 2015
Doctoralia Report on Health and the Internet 2015Doctoralia Report on Health and the Internet 2015
Doctoralia Report on Health and the Internet 2015
 
Skills in New Zealand and around the world
Skills in New Zealand and around the worldSkills in New Zealand and around the world
Skills in New Zealand and around the world
 
IRJET - Monitoring Suicidal Behaviour System
IRJET -  	  Monitoring Suicidal Behaviour SystemIRJET -  	  Monitoring Suicidal Behaviour System
IRJET - Monitoring Suicidal Behaviour System
 

More from International Center for Biometric Research

Best Practices in Reporting Time Duration in Biometrics
Best Practices in Reporting Time Duration in BiometricsBest Practices in Reporting Time Duration in Biometrics
Best Practices in Reporting Time Duration in Biometrics
International Center for Biometric Research
 

More from International Center for Biometric Research (20)

HBSI Automation Using the Kinect
HBSI Automation Using the KinectHBSI Automation Using the Kinect
HBSI Automation Using the Kinect
 
IT 34500
IT 34500IT 34500
IT 34500
 
An Investigation into Biometric Signature Capture Device Performance and User...
An Investigation into Biometric Signature Capture Device Performance and User...An Investigation into Biometric Signature Capture Device Performance and User...
An Investigation into Biometric Signature Capture Device Performance and User...
 
Entropy of Fingerprints
Entropy of FingerprintsEntropy of Fingerprints
Entropy of Fingerprints
 
Biometric and usability
Biometric and usabilityBiometric and usability
Biometric and usability
 
Examining Intra-Visit Iris Stability - Visit 4
Examining Intra-Visit Iris Stability - Visit 4Examining Intra-Visit Iris Stability - Visit 4
Examining Intra-Visit Iris Stability - Visit 4
 
Examining Intra-Visit Iris Stability - Visit 6
Examining Intra-Visit Iris Stability - Visit 6Examining Intra-Visit Iris Stability - Visit 6
Examining Intra-Visit Iris Stability - Visit 6
 
Examining Intra-Visit Iris Stability - Visit 2
Examining Intra-Visit Iris Stability - Visit 2Examining Intra-Visit Iris Stability - Visit 2
Examining Intra-Visit Iris Stability - Visit 2
 
Examining Intra-Visit Iris Stability - Visit 1
Examining Intra-Visit Iris Stability - Visit 1Examining Intra-Visit Iris Stability - Visit 1
Examining Intra-Visit Iris Stability - Visit 1
 
Examining Intra-Visit Iris Stability - Visit 3
Examining Intra-Visit Iris Stability - Visit 3Examining Intra-Visit Iris Stability - Visit 3
Examining Intra-Visit Iris Stability - Visit 3
 
Best Practices in Reporting Time Duration in Biometrics
Best Practices in Reporting Time Duration in BiometricsBest Practices in Reporting Time Duration in Biometrics
Best Practices in Reporting Time Duration in Biometrics
 
Examining Intra-Visit Iris Stability - Visit 5
Examining Intra-Visit Iris Stability - Visit 5Examining Intra-Visit Iris Stability - Visit 5
Examining Intra-Visit Iris Stability - Visit 5
 
Standards and Academia
Standards and AcademiaStandards and Academia
Standards and Academia
 
Interoperability and the Stability Score Index
Interoperability and the Stability Score IndexInteroperability and the Stability Score Index
Interoperability and the Stability Score Index
 
Advances in testing and evaluation using Human-Biometric sensor interaction m...
Advances in testing and evaluation using Human-Biometric sensor interaction m...Advances in testing and evaluation using Human-Biometric sensor interaction m...
Advances in testing and evaluation using Human-Biometric sensor interaction m...
 
Cerias talk on testing and evaluation
Cerias talk on testing and evaluationCerias talk on testing and evaluation
Cerias talk on testing and evaluation
 
IT 54500 overview
IT 54500 overviewIT 54500 overview
IT 54500 overview
 
Ben thesis slideshow
Ben thesis slideshowBen thesis slideshow
Ben thesis slideshow
 
(2010) Fingerprint recognition performance evaluation for mobile ID applications
(2010) Fingerprint recognition performance evaluation for mobile ID applications(2010) Fingerprint recognition performance evaluation for mobile ID applications
(2010) Fingerprint recognition performance evaluation for mobile ID applications
 
ICBR Databases
ICBR DatabasesICBR Databases
ICBR Databases
 

(Spring 2013) The Impact of Aging on Fingerprint Quality

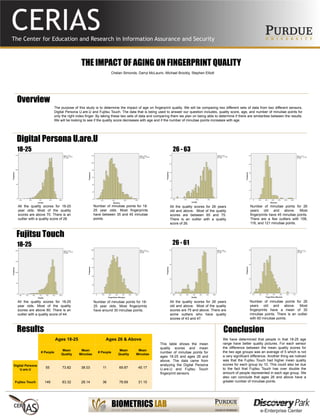
  • 1. THE IMPACT OF AGING ON FINGERPRINT QUALITY The purpose of this study is to determine the impact of age on fingerprint quality. We will be comparing two different sets of data from two different sensors, Digital Persona U.are.U and Fujitsu Touch. The data that is being used to answer our question includes, quality score, age, and number of minutiae points for only the right index finger. By taking these two sets of data and comparing them we plan on being able to determine if there are similarities between the results. We will be looking to see if the quality score decreases with age and if the number of minutiae points increases with age. Chelan Simonds, Darryl McLaurin, Michael Brockly, Stephen Elliott Overview Digital Persona U.are.U 18-25 26 - 63 Fujitsu Touch 18-25 26 - 61 Ages 18-25 Ages 26 & Above # People Mean Quality Mean Minutiae # People Mean Quality Mean Minutiae Digital Persona U.are.U 55 73.82 38.03 11 69.87 45.17 Fujitsu Touch 146 83.32 28.14 36 78.69 31.15 Results Conclusion All the quality scores for 18-25 year olds. Most of the quality scores are above 70. There is an outlier with a quality score of 28. Number of minutiae points for 18- 25 year olds. Most fingerprints have between 35 and 45 minutiae points. All the quality scores for 26 years old and above. Most of the quality scores are between 65 and 75. There is an outlier with a quality score of 26. Number of minutiae points for 26 years old and above. Most fingerprints have 45 minutiae points. There are a few outliers with 108, 116, and 121 minutiae points. All the quality scores for 18-25 year olds. Most of the quality scores are above 80. There is an outlier with a quality score of 44. Number of minutiae points for 18- 25 year olds. Most fingerprints have around 30 minutiae points. All the quality scores for 26 years old and above. Most of the quality scores are 75 and above. There are some outliers who have quality scores of 43 and 47. Number of minutiae points for 26 years old and above. Most fingerprints have a mean of 30 minutiae points. There is an outlier with 60 minutiae points. This table shows the mean quality scores and mean number of minutiae points for ages 18-25 and ages 26 and above. The data came from analyzing the Digital Persona U.are.U and Fujitsu Touch fingerprint sensors. We have determined that people in that 18-25 age range have better quality pictures. For each sensor the difference between the mean quality scores for the two age groups was an average of 5 which is not a very significant difference. Another thing we noticed was that the Fujitsu Touch had higher mean quality scores for each group by 10. This could also be due to the fact that Fujitsu Touch has over double the amount of people represented in each age group. We also can conclude that ages 26 and above have a greater number of minutiae points.