1. OceanForest Investment Partners
Portfolio Managers Commentary – Q2 2012
Q4 2013
A Look Back at 2013 and What’s Ahead
“Investors repeatedly jump ship on a good strategy just because it hasn’t worked so
well lately, and, almost invariably, abandon it at precisely the wrong time.”
– David Dreman
Every January it’s customary to take a look back at the year that was. What were the
highlights? What were the lowlights? What got us to where we are today? What were
the events we’ll always remember? Perhaps the most important question is, “What did
we learn?”
Brent Woyat, CIM, CMT
Portfolio Manager
Raymond James Ltd.
Suite 102 – 2168 Marine Dr.
West Vancouver, BC
V7V 1K3
Tel: 604-921-9222
brent.woyat@raymondjames.ca
www.ofip.ca
I think the biggest lesson we learned is not to overreact to what we hear in the news. Much
of 2013 was dominated by a jittery media that constantly forecasted doom and gloom at
the slightest provocation. If you turned on the TV at all during year, you probably heard
about numerous things that could derail the economy or sink the markets. The year was
filled with prophecies that never came to pass.
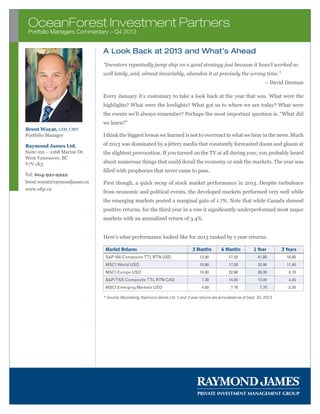
First though, a quick recap of stock market performance in 2013. Despite turbulence
from economic and political events, the developed markets performed very well while
the emerging markets posted a marginal gain of 1.7%. Note that while Canada showed
positive returns, for the third year in a row it significantly underperformed most major
markets with an annualized return of 3.4%.
Here’s what performance looked like for 2013 ranked by 1 year returns:
Market Returns
1 Year
3 Years
S&P 500 Composite TTL RTN USD
3 Months
13.90
6 Months
17.50
41.80
18.60
MSCI World USD
10.90
17.00
32.90
11.40
MSCI Europe USD
10.80
22.90
30.30
8.70
S&P/TSX Composite TTL RTN CAD
7.30
14.00
13.00
3.40
MSCI Emerging Markets USD
4.60
7.70
1.70
-2.50
* Source: Bloomberg, Raymond James Ltd. 1 and 3 year returns are annualized as of Sept. 30, 2013
2. OceanForest Investment Partners
Portfolio Managers Commentary – Q2 2012
Q4 2013
The Year in Review
The Fiscal Cliff
Remember this? This time last year, it’s all we ever heard about. It was the combination of simultaneous budget cuts and tax
increases that, taken together, could have possibly caused the U.S. economy to shrink, bringing about a second recession.
It was an important topic—everything I’m about to recap was important, in its own way—but the fear that it prompted
was unwarranted. It was never likely that we would reach the fiscal cliff, or that the effects would be as bad as some
predicted. And indeed, Congress reached an eleventh hour agreement (this will become a theme) to avert the worst of
the fiscal cliff’s effects.
Despite all the worry, the economy kept chugging along, albeit slowly
Bernanke, Bonds, and Buzzwords
Around May and June, you probably started hearing a lot about the Federal Reserve and its chairman, Ben Bernanke. The
chatter was all centered on numerous financial terms and buzzwords like “tapering,” and “quantitative easing.” This had to
do with the Fed’s massive bond-buying program. For several years now, the Federal Reserve has been buying bonds at an
incredible level, to the tune of $85 billion a month. This is called “quantitative easing.” The Fed has been keeping interest
rates low through buying bonds, essentially by putting “new” money into circulation for the first time. In short, think of the
Fed buying bonds as if it’s trying to fill a gigantic swimming pool full of cash. The more it throws into the pool, the more is
available for others to use. The more that’s available for use means the more that is available to lend … which is what keeps
interest rates so low. It’s a handy short-term prop for the economy.
This program couldn’t go on indefinitely. So in June, Bernanke made the following statement:
“If the economy is able to sustain a reasonable cruising speed, we will ease the pressure on the accelerator by gradually
reducing the pace of [bond] purchases.” - Ben Bernanke, CNN June 19, 2013
But tapering didn’t come immediately, interest rates didn’t skyrocket, and everyone had a chance to take a deep breath and
get used to the idea. So when the Federal Reserve announced they would begin tapering starting in January of this year, the
markets not only reacted more calmly, but positively. The Dow and the S&P 500 both closed at record highs, while bond
yields barely moved at all. Once again, there was never any need for panic in the first place.
The Dog Days of Summer
Overall, the markets have had a very good year, but that hasn’t stopped many pundits from predicting a market correction.
There was a lot of talk about it during the summer especially. The markets had gone too high, many said, so a correction
was “due.” Others worried about the aforementioned tapering, or even a war with Syria.
3. OceanForest Investment Partners
Portfolio Managers Commentary – Q2 2012
Q4 2013
In August, war with Syria seemed like a real possibility. Previously, Barack Obama had declared that if Syrian president
Bashar al-Assad ever used chemical weapons against his enemies, he would have crossed a “red line,” a line that merited
a U.S. response. So when the news broke out that Assad actually had used chemical weapons, it seemed like another
Middle-Eastern conflict was on the horizon.
As you know, war never happened. The point is that another potential crisis was averted and things returned to normal.
The Affordable Care Act (Obamacare), Debt Ceilings, and Government Shutdowns
And by “returning to normal,” I of course mean a return to political gridlock in Washington. In this case, the gridlock
was mostly over three issues: the rollout of the Affordable Care Act, a potential government shutdown, and whether to
raise the debt ceiling or not.
All three subjects prompted a lot of handwringing. Pundits asked themselves, “What if the Affordable Care Act makes
unemployment rates go up? What if we don’t raise the debt ceiling and the U.S. ends up defaulting on its obligations?
What will happen if the government shuts down?”
Again, I won’t comment on the politics involved. The message here is that the Affordable Care Act hasn’t negatively
impacted unemployment rates, nor the economy at large. The government did shut down most of its non-essential
operations briefly however it wasn’t the economic disaster that many feared.
Finally, Congress resorted to its tried-and-true playbook and reached a last-minute deal to raise the debt ceiling, thus
staving off a credit default
So What Does It All Mean?
Wow! 2013 was a hectic year. But in many ways, it was the year where the worst never happened. That doesn’t mean the
worst can’t ever happen, of course, but the fact remains: we shouldn’t overreact. When it looks like the worst is happening
on Capitol Hill, it usually won’t. When it looks like the market will lose its head over a bit of bad news, it usually won’t.
And when it looks like a storm will last forever …
You guessed it. It usually won’t!
Again, all these events—the fiscal cliff, tapering, the debt ceiling, etc.—were important. They do matter, and we should
absolutely keep ourselves educated about them so that we won’t often get taken by surprise.
After all, I’m sure 2014 will have its share of storm clouds! But whenever you turn on the TV, tune into the radio, or open
up a newspaper, remember the lesson of 2013: don’t overreact to what you hear. Don’t waste your life always fearing for
the worst. Furthermore, don’t sweat the daily waves you see in the markets. It will only make you sea-sick.
What we should do, always, is concentrate on what your goals are and what strategy we’re using to help you achieve them.
By having concrete goals, and by having a strategy, you can weather any storm the world throws at you. So the next time
4. OceanForest Investment Partners
Portfolio Managers Commentary – Q2 2012
Q4 2013
you hear about gridlock in Washington, or a dip in investor confidence, remind yourself that it’s not about what other
people do, it’s about what you do.
Portfolio Strategy
As we’ve mentioned in most of our previous commentaries, one of the key indicators we use for guiding our long-term
positioning in the markets is our Tactical Asset Allocation model. The model has a pretty good track record of helping
us position our portfolios to be either on the defensive or be more aggressive with our equity allocations.
Each month we update our model and the current reading at the end of December continued to call for a bullish stance
on both the U.S. and Canadian markets. Although Canada has underperformed the U.S. for many months now, our
model is telling us nevertheless to stay invested in the current environment near the upper end of the allocation range
as outlined in your Investment Policy Statement (IPS).
When you invest your money, there are five potential outcomes:
1. A large gain
2. A small gain
3. Break even
4. A small loss
5. A large loss
The large gain and the large loss usually happen in extreme markets. The other three outcomes happen in normal markets.
To protect your investments, you need to minimize large losses. The success of your portfolio and your retirement depends
on how successful you are at avoiding such extreme losses. The bottom line is, if you can avoid large losses, then markets
can probably take care of your portfolio.
While our tactical indicator does not try to predict the future it does provide us with an objective signal based on market
action only. It helps to reduce much of the subjectivity and emotion in the decision making process. When our model
finally tells us to be on the defensive we will reduce the equity exposure in the portfolios towards the lower end of the
allocation range as indicated in the IPS.
While it’s true that the Canadian markets have been underperforming the U.S. markets, beginning last August we began
to notice an important trend change was developing in relative performance between the two markets. For the past six
months the Canadian market has actually shown equal performance to the U.S. and it appears that we may be in the
early stages of an important turnaround with Canada regaining some of its former glory!
The sectors that have been a real drag on our market are the resource stocks. Weak commodity prices across the board
resulted in a crippling bear market in precious and base metal mining stocks while energy stocks have also been under
pressure. However, we feel that the bear market in resource stocks has run its course and we are looking at 2014 as the
beginning of the next bull market cycle. Commodities and commodity related stocks are setting up for a strong move this
year which should help propel the Canadian stock market higher, potentially outperforming our neighbors to the south.
5. OceanForest Investment Partners
Portfolio Managers Commentary – Q2 2012
Q4 2013
In our managed accounts we have been upgrading our holdings and focusing on good quality dividend paying companies.
Our research has shown that owning the highest yielding large cap companies in both the Canadian and U.S. markets
have outperformed the major market indexes not only on an absolute basis but also on a risk adjusted basis over long
periods of time. Risk adjusted returns are important as it measures how much risk is involved in producing that return.
By focusing on the highest yielding blue chip companies we are going to create a higher income stream and provide
some capital growth while at the same time reducing the volatility of returns. In addition, stocks that provide a higher
dividend yield have been shown to decline less in a bear market than the broader indexes providing some comfort in
uncertain times.
For those investors looking at the long term, ignore the taper talk and focus on dividends. The pay-outs from equities
have been some of the leading contributors to total returns and can have powerful effects on a portfolio.
Before I wrap up this commentary, let me leave you with a few thoughts. Media headlines have a way of playing to our
vulnerability. Too often they fuel our fear and raise our sense of insecurity – leaving us walking through life in a permanent
state of anxiety; forever worried about what danger lurks around the next corner, forever focusing on what we might lose
rather than on what we can do to gain more of what we want.
But here’s the deal. Fear is a powerful emotion and, left unchecked, it can overpower your life, keeping you from doing
the very things that would ultimately serve you and make you more safe, not less. Accordingly, during times when fear
runs most rampant, it is those who are able to rein it in and take decisive action in its presence who will find opportunity
amidst uncertainty and reap the greatest rewards.
I hope you found this overview helpful. Should you have questions about this note or about any other issue, please feel
free to give me or one of the members of my team a call.
And as always, thank you for the opportunity to serve as your financial advisor.
Brent Woyat, CIM, CMT
Portfolio Manager
OceanForest Investment Partners
P.S. - I don’t often ask for referrals, but during these unsettling times you might have a friend, relative, or co-worker who is in need of levelheaded counsel on investing. Give me a call if you think I can help.
The model account performance reflects returns, net of fees, and it is historical, including compounding and reinvestment of distributions. The performance calculation for the
models may be different than that of the index/markets used as a reference point for comparison. Individual client account performance is likely not to be exactly the same as the
model account due to several factors, including timing of contributions, date invested in the model and redemptions, etc. Performance data represents past performance and is
not necessarily indicative of future performance; that there is no guarantee of performance. The index rates of return do not take into account sales, redemptions, distributions
or optional charges or income taxes payable; whereas the model performance takes into account the respective charges and fees. Investors should read the available disclosure
documents before investing.
The information contained in this report was obtained from sources believed to be reliable, however, we cannot represent that it is accurate or complete. This report is provided as
a general source of information and should not be considered personal investment advice or solicitation to buy or sell securities. The views expressed are those of the author and
not necessarily those of Raymond James Ltd. The performance numbers are based on the underlying “model” client account in Dataphile, and that the source of the performance
is Dataphile, which generates on “dollar weighted” returns. Raymond James Ltd. is a Member-Canadian Investor Protection Fund.
Market indices return data in this table is from sources believed to be reliable, but accuracy cannot be guaranteed.
Privacy legislation requires that anyone you are referring consents to having his/her information provided to me.
![OceanForest Investment Partners
Portfolio Managers Commentary – Q2 2012
Q4 2013
The Year in Review
The Fiscal Cliff
Remember this? This time last year, it’s all we ever heard about. It was the combination of simultaneous budget cuts and tax
increases that, taken together, could have possibly caused the U.S. economy to shrink, bringing about a second recession.
It was an important topic—everything I’m about to recap was important, in its own way—but the fear that it prompted
was unwarranted. It was never likely that we would reach the fiscal cliff, or that the effects would be as bad as some
predicted. And indeed, Congress reached an eleventh hour agreement (this will become a theme) to avert the worst of
the fiscal cliff’s effects.
Despite all the worry, the economy kept chugging along, albeit slowly
Bernanke, Bonds, and Buzzwords
Around May and June, you probably started hearing a lot about the Federal Reserve and its chairman, Ben Bernanke. The
chatter was all centered on numerous financial terms and buzzwords like “tapering,” and “quantitative easing.” This had to
do with the Fed’s massive bond-buying program. For several years now, the Federal Reserve has been buying bonds at an
incredible level, to the tune of $85 billion a month. This is called “quantitative easing.” The Fed has been keeping interest
rates low through buying bonds, essentially by putting “new” money into circulation for the first time. In short, think of the
Fed buying bonds as if it’s trying to fill a gigantic swimming pool full of cash. The more it throws into the pool, the more is
available for others to use. The more that’s available for use means the more that is available to lend … which is what keeps
interest rates so low. It’s a handy short-term prop for the economy.
This program couldn’t go on indefinitely. So in June, Bernanke made the following statement:
“If the economy is able to sustain a reasonable cruising speed, we will ease the pressure on the accelerator by gradually
reducing the pace of [bond] purchases.” - Ben Bernanke, CNN June 19, 2013
But tapering didn’t come immediately, interest rates didn’t skyrocket, and everyone had a chance to take a deep breath and
get used to the idea. So when the Federal Reserve announced they would begin tapering starting in January of this year, the
markets not only reacted more calmly, but positively. The Dow and the S&P 500 both closed at record highs, while bond
yields barely moved at all. Once again, there was never any need for panic in the first place.
The Dog Days of Summer
Overall, the markets have had a very good year, but that hasn’t stopped many pundits from predicting a market correction.
There was a lot of talk about it during the summer especially. The markets had gone too high, many said, so a correction
was “due.” Others worried about the aforementioned tapering, or even a war with Syria.](data:image/gif;base64,R0lGODlhAQABAIAAAAAAAP///yH5BAEAAAAALAAAAAABAAEAAAIBRAA7)