
Recommended
Recommended
More Related Content
Similar to Communicated by Grzegorz Żurek Volume 73 2016 P L A N T .docx
Similar to Communicated by Grzegorz Żurek Volume 73 2016 P L A N T .docx (20)
More from cargillfilberto
More from cargillfilberto (20)
Recently uploaded
Recently uploaded (20)
Communicated by Grzegorz Żurek Volume 73 2016 P L A N T .docx
- 1. Communicated by Grzegorz Żurek Volume 73 2016 P L A N T B R E E D I N G A N D S E E D S C I E N C E Fardin Khazaei 1 , Majid AghaAlikhani 1 , Samad Mobasser 2 , Ali Mokhtassi-Bidgoli 1 , Hesam Asharin 2 , Hossein Sadeghi 2 1 Department of Agronomy, Faculty of Agriculture, Tarbiat Modares University, Tehran, Iran; 2 Seed and Plant Certification and Registration Institute, Agricultural Research,
- 2. Education and Extension Organization (AREEO), Karaj, Iran EVALUATION OF WHEAT (TRITICUM AESTIVUM, L.) SEED QUALITY OF CERTIFIED SEED AND FARM- SAVED SEED IN THREE PROVINCES OF IRAN ABSTRACT The objective of this study was to study the seed quality aspects of wheat (Triticum aestivum L.) and the extent of weed seed contamination present in wheat seeds produced in different regions of Iran. Four districts (cities), each including 12 fields (six certified seed fields and six farm-saved seed fields), were selected in each regions (provinces). One kilogram of the wheat seed sample was collected from each field for analysis in the laboratory. Wheat seeding was commonly done by farm- saved seed sourced from within the farm due to the high costs of certified seeds purchased from outside sources, followed by the low seed quality. The use of a farm-saved seed resulted in a higher germination rate and a lower mean time to germination compared with another system. The more positive temperatures experienced by mother plants could decrease the number of
- 3. normal seedling and seedling length vigor index. Generally there was virtually no difference about physiologi- cal quality between certified seed and farm- saved seed sector that is related to lower quality of certified seed. The certified produced seeds had the lower number of weed seed, species and genus before and after cleaning. The highest seed purity and 1000 seed weight was obtained from the certified seed production system. The need for cleaning the farm-saved seed samples before sowing is one of the important findings of this survey. Keywords: germination indices; seed production system; vigor; weed seed dispersal; winnowing INTRODUCTION Importance of wheat (Triticum aestivum L.) as an agricultural crop is punctuated by the fact that it ranks second after maize in the world cereal output and it is a staple food for billions of people of the world. It is also the most important winter cereal DOI: 10.1515/plass-2016-0009 100 Fardin Khazaei et al.. grown in Iran (Zand et al. 2007). A little more than 9 million ha
- 4. of arable land in Iran are planted with cereals, of which wheat occupies 6.6 million ha. To grow this plant, 80-85% of the national seed requirements of the country are derived from farm-saved seeds, so a substantial investment has been made in agricultural research to evaluate the wheat farm-saved seed performance (Mobasser et al. 2012). More than 80% of the crops in developing countries are planted from seed stocks of the farmers (Almekinders and Louwaars 1999). According to the crop, the share of the certified seed system in supplying the country's seed requirement varies. For some hybrid seeds, 100% of the needed seed are produced by state companies, while for self pollinated crops as cereals, the share of certified system is estimated lower than 20% (Mobasser et al. 2012). Since seed quality is a critical and basic input that affects crop production potential, it should reach farmers in a good quality state. Seed quality is composed of many as-
- 5. pects where four key attributes as genetic, physical, physiological and health quality are clearly identified. However, seed quality can be influenced by environmental con- ditions and also the cultural practices used for production. Preserving seed quality is fundamental if the variety meet the expectation of farmers and consumers (van Gastel et al. 2002). Seed quality within farmer seed systems is controlled by social norms of reciprocity, whereas in the certified sector seed schemes, seed is produced commer- cially; without seed regulation, the onus is on the procedure (i.e. the project) to main- tain quality standards (Jones et al. 2002). Dispersal and spread of weed seeds is an important biological factor affecting seed quality control and an essential element when considering crop weed management strategies (Michael et al. 2010). Previous studies have identified high levels of weed seed contamination in crop seed in Australia (Michael et al. 2010) and Ethiopia and Syria (Bishaw 2004). In addition, Bishaw (2004) reported that
- 6. the average physical purity of wheat seed samples collected from different districts of Ethiopia was 98.92% and also there were significant differences in physical purity between differ- ent wheat growing regions in Ethiopia. Considering seed quality, the first and the most important step in reducing weed infestation is the use of clean seeds (Michael et al. 2010; Chauhan 2013). Weeds can cause significant reductions in both productivity and seed quality of desirable species such as wheat (Mokhtassi-Bidgoli et al. 2013b). It has long been thought that many infestations of weed populations are a direct result of seeding with contaminated crop seed. Therefore, the objective of this study was to study the quality aspects of wheat seeds and the extent of weed seed contamination present in wheat seeds produced in different regions of Iran taking into account weather conditions, seed sources and ag- ronomic practices.
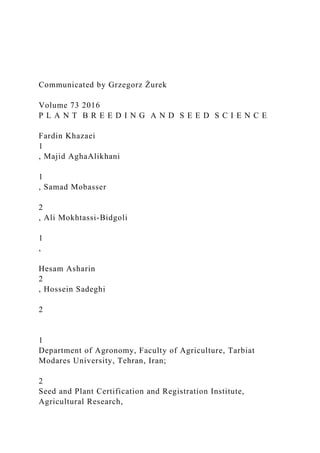
- 7. MATERIALS AND METHODS A total of 144 wheat farmers were interviewed in three wheat growing regions of Iran. Four districts (cities), each including 12 fields (six certified fields and six farm- saved seed fields), were selected in each regions (provinces) (Fig. 1). One primary Evaluation of wheat (Triticum aestivum L.) seed quality of certified seed and farm … 101 sample for each 500 kg of 3001-20000 kg lot size and also one primary sample for each 700 kg of 20001 kg and above lot size were taken and samples were mixed and finally one kilogram of seed sample was prepared by the divider (ISTA hand book on seed sampling, 2004) from each field for analysis in the laboratory. All samples col- lected during the survey were used to determine the number of weed seed, genus and species before and after cleaning. Weed seeds were separated manually from the sam- ples and their species and genera were identified. These weed seeds were returned to
- 8. the samples. After that, the samples were cleaned using a Westrup LA-LS air/screen cleaner. The grain velocity used was 3.5 m/sec. The screen system is consisting of one sieve boat with 1 short scalping screen 275 × 275 mm and 2 long grading/-sand screens 275 × 540 mm which gives a total screen area of 0.34 m 2 . Fig. 1. Geographic distribution of wheat farms in studied areas All samples were analyzed for seed quality (physical purity, thousand seed weight, germination, vigor, etc.). The tests were conducted at the seed testing 102 Fardin Khazaei et al.. laboratory of the Seed and Plant Certification and Registration Institute (SPCRI), Karaj, Iran in 2011-2012. The meteorological data recorded during the study period in each growing season and geographical altitudes are given in Table 1.
- 9. Table 1 The averag0e annual maximum, minimum and mean temperatures (°C), annual total precipitation [mm] recorded in 2011-2012 and geographical altitudes (m) in studied areas. The farmers were asked to give information about their preferences and uses of seed sources and agronomic practices for wheat production (Tables 2, 3 and 4). Seed quality attributes - physical Other seeds by number analysis According to ISTA rules (2012), the 1000g seed sample was evaluated for determination of the number of other seeds. Province Cities Maximum temperature Minimum temperature Mean tem- perature
- 10. Precipitation Altitude Tehran and Alborz Karaj 22.4 1.3 10.6 174.1 1380 Hashtgerd&Nazarabad 21.2 1.2 10.4 181.3 1191 Varamin 19.9 6.7 13.3 148.0 918 Rey 18.6 6.5 12.5 159.0 1060 Average 20.5 3.9 11.7 165.6 1137.2 Kermanshah Sarab Niloofar 18.5 1.9 10.1 293.0 1331 Mahidasht 18.8 2.0 10.4 344.2 1420 Kuzaran 18.8 1.7 10.2 273.3 1368 Ravansar 16.8 4.1 10.3 378.2 1362 Average 18.2 2.4 10.3 322.2 1370.2 West Azarbai- jan Orumiyeh 13.3 0.4 6.8 217.5 1328 Oshnavieh 13.2 0.5 6.9 327.1 1415
- 11. Naghadeh 13.9 2.3 8.0 214.0 1307 Miandoab 14.7 1.9 8.2 192.0 1300 Average 13.8 1.3 7.5 237.7 1337.5 Evaluation of wheat (Triticum aestivum L.) seed quality of certified seed and farm … 103 Physical (analytical) purity test Two replicates of 60 g from each seed sample were analyzed. The samples were divided into four fractions (pure seed, other seed and inert matter). After analysis, the percentage of each fraction (based on weight) was calculated (ISTA 1996). Thousand Seed Weight (TSW) Two replicates of 1000 seeds were separated using a seed counter and then the mean seed weight was calculated (Bonner 1974). Seed quality attributes - physiological Germination Test Four replicates of 100 seeds from each sample were planted in
- 12. pleated paper. Then, seeds were placed in a germination room maintained at 20°C for 8 days for wheat according to ISTA Rules (ISTA 1996). The germination boxes were removed at the end of the incubation period and seedlings were evaluated (Bekendam and Grob 1979). Normal seedling, abnormal seedling, dormant and dead seeds were recorded and the average calculated based on the final count. Vigor tests Germination rate Four replicates of 100 seeds were planted from each sample and kept at 20 ± 1°C for a maximum of 12 days in a germination room until no further germination took place. Normal seedlings were removed each day at predeter- mined size and time until all seeds that are capable to produce normal seedlings, germinated. An index was calculated by dividing the number of seedlings re-
- 13. moved each day by the number of days in which they were removed (Maguire 1962). First seedling count The first count was made during the germination test, and the numbers of normal seedlings were recorded (fourth day after planting). The final count was made on the eighth day and total number of normal seedlings, number of abnor- mal seedling, fresh seed and dead seeds was recorded (Agarwal 1986). 104 Fardin Khazaei et al.. Seedlings shoot and root length The seedling shoot and root lengths were assessed after the final count. 40 normal seedlings were randomly selected from each sample and the shoot
- 14. length was measured from the point of attachment to the cotyledon to the tip of the seedling. The root length was measured from the point of attachment to the cotyledon to the tip of the root. The average shoot or root length was calculated by dividing the total shoot or root lengths by the total number of normal seed- lings measured (Fiala 1987). Seedling dry weight The seedling dry weight was measured after the final count. From each repli- cate, ten seedlings was selected randomly and were cut free from their cotyle- dons and placed in envelopes and dried in an oven at 80 ± 1°C for 24 hours. The dried seedlings were weighed and the average seedling dry weight was calcu- lated. Germination indices The following indices were calculated: Mean time germination (MTG) was calculated as follows:
- 15. where ni is number of germinated seeds till i th day and di is number of days from start of experiment till i th counting and n is total germinated seeds. Mean daily germination (MDG) is contrast to day germination speed (time to need for germination a seed), MDG is ‘mean germination days’ and it is speed germina- tion day index and was determined as follows: where FGP is final germination percentage and D is number of days from start to end of the experiment. Seedling vigor index length (SVIL) was calcu- lated as follows: where LP is length of seedling and nor is number of normal seedlings. Seed- ling vigor index weight (SVIW) was calculated as follows: where WDP is total weight of seedlings and nor is number of normal seed- lings (Ellis and Roberts 1981).
- 16. Evaluation of wheat (Triticum aestivum L.) seed quality of certified seed and farm … 105 Statistical analyses After initially testing the normal distribution of residuals, data were subjected to analysis of variance (ANOVA), using the GLM and Nested procedures of SAS (SAS Institute Inc. 2002) for a nested design. Nested analyses were con- ducted by nesting fields within seed production systems and seed production systems within districts (cities). The appropriate error term for province F-test was district (province). Differences between means were determined by Dun- can's multiple range tests at the 0.05 probability levels. RESULTS AND DISCUSSION Natural precipitation, temperature and farmlands management As Table 1 shows, temperature and natural precipitation varied
- 17. among the cities. The annual total precipitation for provinces was in the declining order of Kerman- shah > West Azarbaijan > Tehran and Alborz, while the average annual tempera- ture followed the trend West Azarbaijan < Kermanshah < Tehran and Alborz. In Iran, wheat seeding is commonly done by farmers saved seed seeds sourced from within the farm due to the high costs of certified seeds (40% more than farmers saved seed) purchased from outside sources, followed by the low seed quality (Table 2). A study by Michael et al. (2010) found that of the 16 not cleaned crop seed samples, nine were wheat and seven were an alternative crop (barley and lupin), with most samples sourced from within the farm (94%). Table 2 The proportion (% based on farmer reports in studied areas) of reasons for not using the certified seeds Three methods were used to treat the wheat seeds of farm-saved seed section
- 18. after harvest (Table 3), with fungicide seed treatment (51%), followed by ma- chine cleaning (22%), and then sieving (15%). Michael et al. (2010) reported the share of gravity table, rotary screen and sieves considered for the cleaning of crop seeds were 38%, 8% and 3%, respectively. Most farmers rely on herbicides for weed management (Table 4). The level of weed control and price were the top two things that farmers considered when select- ing herbicides. Province Cities Maximum temperature Minimum temperature Mean tem- perature Precipitation Altitude Tehran and Alborz
- 19. Karaj 22.4 1.3 10.6 174.1 1380 Hashtgerd&Nazarabad 21.2 1.2 10.4 181.3 1191 Varamin 19.9 6.7 13.3 148.0 918 Rey 18.6 6.5 12.5 159.0 1060 Average 20.5 3.9 11.7 165.6 1137.2 106 Fardin Khazaei et al.. Table 3 The proportion (%) of different post harvest activities on farm- saved seed in studied areas in 2011-12 Table 4 The proportion (%) of types of weed control methods in wheat farmlands and seed production systems in areas studied in 2011-12. Three main reasons of the farmers for not using of certified seed was related to the High price (45.8%), low seed quality (27.1%) and insufficient supply (14.6%). Physiological quality There were significant differences among provinces on normal seedling (P<0.05),
- 20. dead seed (P<0.05), abnormal seed (P<0.01), seedling shoot length (P<0.05) and seedling root length (P<0.01), while the effect of seed production system was signifi- cant only for fresh seed (Table 5). Seedling length vigor index and both germination rate and mean time to germination were affected significantly by provinces and seed production systems, respectively (Table 5). The highest and lowest values of normal seed, seedling shoot length, seedling root length, abnormal seed and seedling length vigor index of wheat were related to West Azarbaijan and Kermanshah provinces, respectively, while the highest and lowest dead seed values were related to Tehran & Alborz and Kermanshah provinces, respectively (Table 5). Maximum and minimum fresh seed percentages were obtained from farm-saved seed and certified seed pro- duction systems, respectively (Table 5). The use of a farm- saved seed production sys- tem resulted in a higher germination rate and a lower mean time to germination com-
- 21. pared with certified seed system (Table 5). The reason of these finding might is re- lated to incorrect management at the nucleolus seed production by the formal institu- tions. Province Sieving Machine cleaning Fungicide seed treatment No action Tehran and Alborz 6.2 16.7 60.4 16.7 Kermanshah 2.1 45.8 52.1 0.0 West Azarbaijan 35.4 4.2 39.6 20.9 Average 14.6 22.2 50.7 12.5 Province Hand weeding Herbicide application No control Tehran and Alborz 4.2 82.3 13.5 Kermanshah 1.1 88.5 10.4 West Azarbaijan 0.0 93.8 6.3 Seed production system Informal 0.7 79.2 20.1 Formal 2.8 97.2 0.0
- 22. Average 1.8 88.2 10.1 Evaluation of wheat (Triticum aestivum L.) seed quality of certified seed and farm … 107 Table 5a Physiological quality (vigour) of wheat seed collected from certified seed and farm-saved seed sources in 2011-2012. Summary of F significance from analysis of variance (ANOVA) of experimental factors Table 5b Physiological quality (vigour) of wheat seed collected from certified seed and farm-saved seed sources in 2011-2012. Summary of F significance from analysis of variance (ANOVA) of experimental factors Means within a column and study factor followed by the same letter are not significantly different according to Duncan's multiple range test at the 0.05 probability level of significance; n.s., * and ** are non significant, significant at the 0.05 and 0.01 probability levels, respectively. Provinces Normal
- 23. seedling [%] Abnormal seedling [%] Ungerminated seeds Seedling shoot length [cm] Hypocotyl length [cm] Seedling root length [cm] Seedling fresh weight [cm] Dead seed [%] Fresh seed [%] Tehran and
- 24. Alborz 95.8125ab 2.0208 b 1.6667a 0.9167a 21.6998b 11.3738a 10.3265b 1.1940a Kermanshah 95.0417b 3.7500a 0.4792b 1.0833a 21.4017b 11.7840a 9.6194b 1.3638a West Azar- baijan 97.0625 a 1.7708b 0.8333ab 0.7708a 22.8085a 11.1667a 11.6463a 1.0456a Seed production system Farm-saved seed 95.7917a 2.4583a 0.9444a 1.1250a 21.9040a 11.3461a 10.5589 a 1.0092a Certified seed 96.1528a 2.5694a 1.0417a 0.7222b 22.0360a 11.5368a 10.5025 a 1.3931a Source Provinces * ** * ns * ns ** ns Cities ns ns * ns ns ns ns ns Seed sys- tems
- 25. ns ns ns ** ns ns ns ns Provinces Seedling dry weight [g] Final germi- nation [%] Germination rate Mean daily germination [number/day] Mean time to germination [day] Seedling length vigor index Seedling weight vigor index
- 26. Tehran and Alborz 0.166042a 97.8333a 61.466a 39.181a 1.75292a 2077.45b 15.8327a Kermanshah 0.162708a 98.6458a 61.485a 42.124a 1.75729a 2031.63b 15.3531a West Azarbai- jan 0.169375a 98.6458a 59.578a 40.754a 1.79771a 2211.51a 16.3171a Seed production system Farm-saved seed 0.160139a 98.1389a 61.898a 40.7665a 1.74556 b 2097.23a 15.2331a Certified seed 0.171944a 98.6111a 59.788b 40.6060a 1.79306 a 2116.50a 16.4356a Source Provinces ns ns ns ns ns ** ns Cities ns ns ns * ns ns ns Seed systems ns ns ** ns ** ns ns
- 27. 108 Fardin Khazaei et al.. These findings are in contrast with those of Kshetri (2010) who observed the highest levels in seed quality attributes such as germination, 1000 seed weight genetic purity percentage in certified seed. It was noticed that farmers who used own saved seeds produced seeds with less germination percentage compared to farmers who used certified seeds. Both biotic and abiotic conditions experienced by mother-plants during the formation, development and maturation of seed affect the phenotype of the off- spring. In the present study, the average annual temperature was significantly correlated with normal seed (r=-0.66, P<0.05), seedling shoot length (r=0.66, P<0.05), seedling root length (r=-0.74, P<0.01) and seedling length vigor index (r=-0.65, P<0.05). As can be seen, the more positive temperatures experienced by mother plants can decrease the number of normal seed and
- 28. seedling length vigor index. In fact, high temperature combined with drought and high winds in the maternal environment may negatively affected plants, especially during the heading, flowering and grain filling stages. The results of Sales et al. (2013) have indicated that stressful environmental conditions experienced by mother plants may act as cues signalizing unfavorable conditions for seed germination. Generally there was virtually no difference about physiological quality be- tween certified seed and farm- saved seed sector (just small number of traits were statistically different) that is might related to reduction of financial support of the government and incorrect management in formal seed production system. Weed seed contamination before and after cleaning The number of weed seed, genus and species in wheat before and after clean- ing was affected significantly by seed production system (P<0.01). In addition,
- 29. significant differences for the number of weed genus and species in wheat after cleaning were observed between provinces (P<0.05) (Table 6). The maximum and minimum number of weed seed, genus and species before and after clean- ing were related to farm-saved seed and certified seed production systems, re- spectively (Table 6). The highest and lowest number of weed genus and species after cleaning was related to Kermanshah and Tehran and Alborz provinces, respectively (Table 6). These results are in line with those of Bishaw (2004) who reported highly significant differences in seed quality for seed samples col- lected from different regions and seed systems for wheat and barley crops in Syria and Ethiopia in a way that certified seeds showed better conditions. As above mentioned, the number of other crop seed and other distinguishable variety were significantly lower in certified seed than that of seed produced by
- 30. farm-saved seed production system. In certified seed production, farmers re- moved the off-types and all other crop plants during rouging due to compulsion of seed certification. So, it is necessary to suggest to farmers to adopt proper practice in additional management as in certified seed production for maintain- ing the physical and genetic purity of seed. As it is indicated in Table 4, certi- fied seed farmers have applied more weed control compared to farm-saved seed Evaluation of wheat (Triticum aestivum L.) seed quality of certified seed and farm … 109 farmers and this can be one of the reasons for lower rate of weed seeds in certi- fied seed samples than farm-saved seed. The certified seeds had the lower num- ber of weed seed, species and genus by 50%, 8% and 8% before cleaning and by 17%, 45% and 45% after cleaning, respectively, compared with the produced
- 31. seeds of the farm-saved seed section (Table 6). Furthermore, cleaned seeds had significantly the lower number of weed seed, genus and species by 91%, 25% and 74% for certified seeds and by 97%, 83% and 83% for farm- saved seeds, respectively, than uncleaned indicting the importance of employing crop clean- ing techniques. Table 6 The number of weed seed, genus and species within wheat seed before and after cleaning in provinces and seed production systems tested in 2011-12. Summary of F significance from analysis of variance (ANOVA) of experimental factors Means within a column and study factor followed by the same letter are not significantly different according to Duncan's multiple range test at the 0.05 probability level of significance; n.s., * and ** are nonsignificant, significant at the 0.05 and 0.01 probability levels, respectively. As it can be seen, cleaned seeds had some level of weed seed contamination. Michael et al. (2010) found that it is impossible to completely
- 32. remove all for- eign weeds seeds from grain due to high costs and the purchase of certified seed does not guarantee weed seed–free status. On the other hand, the differences among the provinces regarding to seed (species) purity, and the lower rate of weed seed contamination in certified seed might be related to origin of the seed source, agricultural practices, and field's inspection by inspectors. There were negative significant correlations for the number of weed genus and species be- fore and after cleaning vs. planted area and vs. nitrogen application (data not shown). As may be expected, the presence of more N may promote higher crop growth rates and plant spacing will be low enough to permit additional weed plants per area unit (Mokhtassi-Bidgoli et al. 2013a). It seems that the larger the Provinces
- 33. The number of weed Seed Genus Species Seed Genus Species Before cleaning After cleaning Tehran and Alborz 385.3a 7.73b 8.67a 28.13a 1.44b 1.56b Kermanshah 413.5a 10.15ab 11.54a 32.06a 3.00a 3.56a West Azarbaijan 445.3a 11.63a 13.17a 26.00a 1.96ab 2.23ab Seed production system Farm-saved seed 552.8a 10.82a 12.24a 49.24a 2.75a 3.17a Certified seed 276.7b 8.85b 10.01b 8.22b 1.51b 1.74b Source Provinces ns ns ns ns * * Cities ns ns ns ns ns ns Seed systems ** ** ** ** ** ** 110 Fardin Khazaei et al.. area under cultivation, the higher the economic return, the greater the power of the farmer and consequently the greater the control of the weed. Analytical purity and seed loss during cleaning
- 34. There were significant differences between different seed sources for analytical purity (Table 7). The highest seed purity and 1000 seed weight was obtained from the certified seed production system (Table 7). This finding is in line with those of Hasan (1995) who reported significantly higher purity values for wheat certified seed compared to farm-saved seed source except in other crop seed contamination. Also this result is in contrast with Ensermu et al. (1998) that reported no significant difference for analytical purity and other crop seeds contamination of seed samples collected from different sources of wheat in Ethiopia. Table 7 The values of seed loss weight after cleaning, seed purity and 1000 seed weight in provinces and seed production systems tested in 2011-12. Summary of F significance from analysis of variance (ANOVA) of experimental factors Means within a column and study factor followed by the same letter are not significantly different according
- 35. to Duncan's multiple range test at the 0.05 probability level of significance; n.s., * and ** are nonsignificant, significant at the 0.05 and 0.01 probability levels, respectively. Based on the results the highest seed loss after cleaning was related to Tehran and Alborz province and farmers saved seed section (Table 7). Since all of the produced seeds by the farmers are not supposed to be planted for the next season and just some part of the seed (about 250 kg × h -1 ) is needed for planting and also as we find the seed loss during the cleaning in farm-saved seed is about 15% (37.5kg) and furthermore the price of 1kg of certified seed is about 50% more than farmers saved seed. So providing the certified seed for Provinces Seed loss weight after cleaning [g]
- 36. Seed purity [%] Weed seed [%] Inert matter [%] 1000 seed weight [g] Tehran and Alborz 157.86a 99.43a 0.16a 0.41a 44.30a Kermanshah 133.33ab 99.41a 0.10a 0.50a 43.16a West Azarbaijan 108.00b 99.51a 0.10a 0.39a 41.47a Seed production system Farm-saved seed 148.87a 99.34b 0.21a 0.45a 41.74b Certified seed 117.26b 99.56a 0.03b 0.41a 44.22a Source Provinces ns ns ns ns ns Cities ns ns ns * ns Seed systems ** * ** ns **
- 37. Evaluation of wheat (Triticum aestivum L.) seed quality of certified seed and farm … 111 farmers of farm-saved seed is not economical. Also in the other side as we find the certified seed did not have enough quality and if the problems in this section don’t be solved, we don't recommend the farmers use certified seed and its bet- ter the farmers in the farm-saved seed sector clean the needed seed for planting in the next season that can be considered as important outcome of the research. Detected weed seed species Based on the results, 24 families included 73 weed genus and 124 weed spe- cies were detected in studied areas. The highest and lowest weed diversity was related to dicotyledonous (97) and monocotyledonous (27) respectively. About 90% of weed species were C3 plants (included 18 monocotyledonous and 93 dicotyledonous) and just 10% of weed species were C4 (included 9 monocotyle-
- 38. donous and 4 dicotyledonous). Annual (80 species), perennial (38) and biennial (6) weed had the highest diversity in respect of life cycle, respectively. Generally, the highest variation of weed species was related to Poacea (24) and Fabaceae (18) families, while the lowest weed species was included Dipsa- caceae, Euphorbiaceae, Primulaceae, Resedaceae and Scrophulariaceae (Table 8). The same results were reported by Norozzadeh et al (2008) and Koocheki et al. (2006). Table 8 Weeds family detected and its number in studied traits Koocheki et al. (2006) by Assessing species and functional diversity and community structure for weeds in wheat and sugar beet in Iran, reported that the total number of weed species were 72 and 52 species in wheat and sugar beet, respectively. Also he showed the Poaceae and Asteraceae had the most diverse
- 39. amongst monocotyledonous and dicotyledonous groups in the wheat fields while Poaceae and Brassicaceae were the most diverse family amongst mono- cotyledonous and dicotyledonous groups in the sugar beet fields. Family Number Family Number Poacea 24 Malvaceae 3 Fabaceae 18 Liliaceae 3 Brassicaceae 11 Rubiaceae 3 Polygonaceae 10 Lamiaceae 2 Apiaceae 6 Plantaginaceae 2 Asteraceae 6 Ranunculaceae 2 Boraginaceae 6 Rosaceae 2 Caryophillaceae 6 Dipsacaceae 1 Chenopodiaceae 5 Euphorbiaceae 1 Amaranthaceae 4 Primulaceae 1 Convolvulaceae 3 Resedaceae 1 Cuscutaceae 3 Scrophulariaceae 1
- 40. 112 Fardin Khazaei et al.. Norozzadeh et al. (2008) by evaluation of species, functional and structural diversity of weeds in wheat fields of three provinces in Iran showed that the weeds of wheat fields were belong to 26 families and 120 species. The majority of weed species were of Asteraceae (20 species) and Poaceae (25 species) amongst dicotyledonous and monocotyledonous, respectively. In another research, Poggio et al. (2004) by evaluation of Structure of weed communities occurring in pea and wheat crops in the Rolling Pampa of Argen- tina reported that the weed community in pea was more diverse than wheat field. 12 weed species included Polygonum aviculare, Lolium perenne, Convol- vulus arvensis, Secale cereale, Hordeum vulgare, Chenopodium album, Conrin- gia orientalis, Galium tricornatum, Avena fatua, Convolvulus sepium, Sorghum halepense and Panicum miliaceum which were more diverse than the others in
- 41. the studied areas and seed production systems were analyzed. Lolium perenne, Convolvulus arvensis, Secale cereale, Chenopodium album, Conringia orientalis, and Galium tricornatum were affected significantly by the provinces (Table 9). Table 9a Effect of provinces and seed production systems on weed seed number. Summary of F significance from analysis of variance (ANOVA) of experimental factors Means within a column and study factor followed by the same letter are not significantly different according to Duncan's multiple range test at the 0.05 probability level of significance; n.s., * and ** are non significant, significant at the 0.05 and 0.01 probability levels, respectively. Source Polygonum
- 42. aviculare Lolium peren- ne Convolvulus arvensis Secale cereale Hordeum vulgare Chenopodium album Provinces Tehran and Al- borz 93.44 123.32 7.25 0.33 37.73 42.04 Kermanshah 182.84 0.04 38.31 0.00 11.90 5.73 West Azarbaijan 82.04 0.77 75.92 66.48 16.94 10.25 F test ns * ** * ns * Seed production system Farm-saved seed 165.63 52.53 71.40 44.46 33.43 25.43 Certified seed 72.97 30.22 40.28 0.08 10.94 13.25 F test ns ns ns ns * ns
- 43. Evaluation of wheat (Triticum aestivum L.) seed quality of certified seed and farm … 113 Table 9b Effect of provinces and seed production systems on weed seed number. Summary of F significance from analysis of variance (ANOVA) of experimental factors Means within a column and study factor followed by the same letter are not significantly different according to Duncan's multiple range test at the 0.05 probability level of significance; n.s., * and ** are non significant, significant at the 0.05 and 0.01 probability levels, respectively. While just Conringia orientalis, Galium tricornatum and Hordeum vulgare were affected significantly by the seed systems. Furthermore some weed species as Hordeum spontaneum, Hordeum disti- cum, Secale cereal, Avenea fatua, Avenea luduviciana, Acroptilon repens, Gly- cegrrhiza glabra, Vicia Villosa, Lathyrus sativus, Malva neglecta, Convolvulus
- 44. arvensis, Turgenia latifolia and Lisaea heterocarpa that are considered as nox- ious weed were removed very few through cleaning (data no Shown). Difference in hand weeding, fertilizer and fungicide application management, the crop rotation and also weed seed bank of the soil might are the reason for difference the weed seed in provinces and seed systems. CONCLUSIONS Generally there was virtually no difference about physiological quality be- tween certified seed and farm- saved seed sector that is related to lower quality of certified seed. This issue might occurred through more reduction of financial support of the government and also incorrect management of formal seed pro- duction sector and consequently reduction of seed quality in the breeder seed, foundation seed and finally certified seed systems. Since some part of the produced seed (about 250 kg × ha -1
- 45. ) is needed for planting and also as we find the seed loss during the cleaning in farmers saved seed is about 15% (37.5kg) and furthermore the price of 1kg of certified seed is about 50% more than farmers saved seed. So providing the certified seed for farm-saved seed farmers is not economical. Also in the other side as we ob- Source Conringia orientalis Galium tricornatum Avena fatua Convolvulus sepium Sorghum halepense Panicum miliaceum Provinces Tehran and Alborz 0.00 0.00 0.79 3.00 5.25 10.92
- 46. Kermanshah 44.43 33.44 8.27 5.56 6.65 5.25 West Azarbaijan 4.67 1.75 22.40 22.13 14.44 9.31 F test ** ** ns ns ns ns Seed production system Farm- saved seed 25.28 21.03 18.60 15.49 12.03 10.56 Certified seed 6.79 2.43 2.38 4.97 5.71 6.43 F test * * * ns ns ns 114 Fardin Khazaei et al.. served, the certified seed in studied areas did not have enough quality and if the problems in this section don’t be solved, it is recommend the farmers don’t use certified seed and its better the farmers in the farmers saved seed sector clean the needed seed for planting in the next season. Also it was recognized, the cleaning is an inevitable practice, which should be conducted to reduce weeds in seed samples especially for farmers saved seed
- 47. samples that are supposed to be planted for the next season. Prevention is the most important method of dealing with weeds. Once a weed has entered an area and become established, eradication is far more expensive and it is likely that greater resources will be required to control its further spread and decrease its impact. So, the first step in weed prevention is considered as preventing the en- try of weeds into fields. It is also necessary to organize the Seed Quality Man- agement training program effectively in farmer conditions for strengthening farmer seed system in the country. The need for cleaning the farmers saved seed samples before sowing is one of the important findings of this survey. Thereby, removing a large quantity of weeds and other crop seeds from the main sample will result in more purity in harvested seeds, less herbicide application, less soil and water contamination, more yield and production of healthy food. it is sug-
- 48. gested that not only the same study in another parts of the country but also in another countries be conducted to get more information about the seed systems and making the strategies for improvement the seed systems based on the re- sults. ACKNOWLEDGEMENTS The authors gratefully acknowledge the financial support provided for this survey by the Research deputy of Tarbiat Modares University (Iran) and techni- cal support provided Seed and Plant Certification and Registration Institute (Iran). REFERENCES Agarwal V.K. 1986. Karnal bunt of wheat: A seed borne disease of considerable importance. Seed Res. 14:1-11 Almekinders C.J.M, Louwaars N.P. 1999. Farmers' seed production: new approaches and practices. Intermediate Technology Publications Ltd, London, UK. Bekendam J, Grob R. 1979. Handbook for seedling evaluation. ISTA, Zürich, Switzerland.
- 49. Bishaw Z. 2004. Wheat and barley seed systems in Ethiopia and Syria [PhD dissertation]. Wageningen Uni- versity, the Netherlands. Bonner F.T. 1974. Seed testing. In Seeds of Woody Plants in the United States, Agriculture Handbook No. 450. For. Service, USDA, Washington D.C. Chauhan B.S. 2013. Strategies to manage weedy rice in Asia. Crop Prot. 48:51-56. Ensermu R, Mwangi W.M, Verkuijl H, Hasenna M, Alemayehu Z. 1998. Farmers' wheat seed sources and seed management in Chilalo Awraja, Ethiopia. CIMMYT, Mexico and IAR, Ethiopia. Fiala F. 1987. Handbook of vigour test methods. ISTA, Zürich, Switzerland. Gastel van A.J.G., Bishaw Z., Gregg B.R. 2002. Wheat seed production. In: Curtis BC, Rajaram S, Gomez Macpherson H, editors. Bread wheat- improvement and production. FAO, Rome; p. 463-482. Evaluation of wheat (Triticum aestivum L.) seed quality of certified seed and farm … 115 Hasan BMA. 1995. A survey of wheat seed quality in Jordan [MSc thesis]. University of Jordan, Amman,
- 50. Jordan. ISTA. 1996. International Rules for Seed Testing., Zürich, Switzerland. ISTA. 2004. Handbook on Seed Health Testing. Zürich, Switzerland. ISTA. 2013. International Rules for Seed Testing. Zürich, Switzerland. Jones RB., Bramel P., Longley C., Remington T. 2002. The need to look beyond the production and provision of relief seed: experiences from southern Sudan. Disasters. 26:302-315. Koocheki A, Nassiri Mahallati M, Tabrizi L, Azizi G, Jahan M. 2006. Assessing species and functional diver- sity and community structure for weeds in wheat and sugar beet in Iran. Iranian Journal of Field Crops Research. 4(1):105-129. In Persian. Kshetri B.T. 2010. On-farm management and quality assessment of farmers’ saved wheat seed in the western Terai, Nepal. Agron J N. 1:50-60. Maguire J.D. 1962. Speed of germination - aid in selection and evaluation for seedling emergence and vigor. Crop Sci. 2:176-177.
- 51. Michael P.J., Owen M.J., Powles S.B. 2010. Herbicide-resistant weed seeds contaminate grain sown in the Western Australian grainbelt. Weed Sci. 58:466-472. Mobasser S., Jazayeri M.R., Khazaei F., Sadeghi L. 2012. Wheat seed contamination with seed-borne diseases in cold climatic zone of Iran. Int J Plant Prod. 6:337-352. Mokhtassi-Bidgoli A., AghaAlikhani M., Nassiri-Mahallati M., Zand E., Gonzalez-Andujar J.L., Azari A. 2013a. Agronomic performance, seed quality and nitrogen uptake of Descurainia sophia in response to different nitrogen rates and water regimes. Ind Crop Prod. 44:583-592. Mokhtassi-Bidgoli A., Navarrete L., AghaAlikhani M., Gonzalez-Andujar JL. 2013b. Modelling the popula- tion dynamic and management of Bromus diandrus in a non- tillage system. Crop Prot. 43:128-133. Norozzadeh Sh., Rashed Mohasel M.H., Nassiri Mahallati M., Koocheki A., AbbasPour M. 2008. Evaluation of species, functional and structural diversity of weeds in wheat fields of Northern, Southern and Razavi Khorasan provinces. Iranian Journal of Field Crops Research. 2(2):471-485. In Persian. Poggio S.L., Satorre E.H., Delafuente E.B. 2004. Structure of weed communities occurring in pea and wheat
- 52. crops in the Rolling Pampa Argentina .Agriculture Ecosystems and Environment 103: 225-235. Sales N.M., Pérez-García F., Silveira F.A.O. 2013. Consistent variation in seed germination across an envi- ronmental gradient in a Neotropical savanna. S Afr J Bot. 87:129-133. SAS Institute Inc. 2002. The SAS System for Windows, Release 9.0. Statistical Analysis System Institute, Cary, NC, USA. Zand E., Baghestani M.A., Soufizadeh S., PourAzar R., Veysi M., Bagherani N., Barjastehe A., Khayamia M.M., Nezamabadi N. 2007. Broadleaved weed control in winter wheat (Triticum aestivum L.) with post –emergence herbicides in Iran. Crop Prot. 26:746-752. Good pre s e ntation for the two pape rs you chos e ! I’ve include d s uggestions, corre ctions, and note s in blue and re d font. THE EFFECTS OF GLYPHOSATE ON THE CONTENT OF MINERAL NUTRIENTS IN SEEDS AND LEAVES and THE EFFECTS OF GENE/GENTICALLY MODIFIED
- 53. SEED ON THE ROOT COLONIZATION AND SUDDEN DEATH SYNDROME OF SOYBEANS (Glycine max (L.) Me rr.) ABSTRACT This report reflects on two separate soybean studies that were performed by others. The objective of the paper is to demonstrate the various effects that occur in soybeans in the field using genetically modified gene with glyphosate and a greenhouse experiment using non- glyphosate resistant soybean crops to study the effects of glyphosate drift on plant growth and concentration of mineral nutrients in leaves and seeds. The materials used include specific research performed by others on soybeans regarding the use of glyphosate and illustrates the outcome of each of the findings. The first study used Roundup Ready (RR) soybeans of unknown cultivars grown in field conditions to determine glyphosate effects on Fusarium solani (Fsg) root colonization and sudden death syndrome (SDS). Data from this study indicate that the development of SDS on RR soybeans is influenced by genotype. Farmers planting RR soybeans in Fsg infested fields are encouraged to select cultivars with resistance to SDS. The second study was performed in greenhouse conditions to study the effects of glyphosate drift on plant growth and concentrations of mineral nutrients in leaves and seeds of non-glyphosate resistant soybean plants at both the early growth stage and at the grain seed maturation. The
- 54. results suggested that glyphosate might interfere with uptake and re-translocation of Calcium (Ca), Manganese (Mn), Iron (Fe), and Magnesium (Mg), most probably by binding and thus immobilizing them. The decreases in seed concentration of Ca, Mn, Fe, and Mg by glyphosate are very specific and may affect seed quality. At grain seed maturation, however, glyphosate did not reduce seed concentrations of Nitrogen (N), Potassium (K), Phosphorus (P), Zinc (Zn) and Copper (Cu). In fact, according to the study, they increased with the exception of Phosphorus. The major findings indicate that the glyphosate genetically modified soybean seeds do not outperform conventional seeds in all cases for any given environment for desirable traits and that glyphosate drift impairs the plant’s ability of the non- glyphosate resistant variety to decrease seed yield and affect the generative organs whereby, the seed showed decreased concentrations of Ca, Mn, Fe, and Mg which raises concern in terms of seed quality (How seed quality was measured?). The desirable traits are to increase yield, resistance to herbicide (in the case of the transgene study) without adverse affects, and improve the nutritiona l value of food. However, in order to obtain and sustain these desirable traits via genetic engineering, there is an input cost associated which may not be desirable and may offset any desired gains in the long term. By placing glyphosate gene into the soybean and spraying the soybean crop with glyphosate raises the question whether this would have the same effect as the spray drift experiment performed on the non-resistant glyphosate relative to nutrients or does the
- 55. inserted gene “protect” the plant from the decreases in mineral nutrients and decrease in seed yield. These types of studies need to be performed to address such questions. 2 INTRODUCTION Most commercial transgenic varieties of corn, cotton, soybeans, and canola/rapeseed contain only two traits herbicide and insect resistance. Genetically Engineered (GE) seeds, or Genetically Modified (GM) also called transgenic seeds are those seeds that have been genetically modified by adding specific genes to enhance a desired trait such as herbicide or insect tolerance through molecular biology techniques. Currently, two herbicide resistant cropping systems are common for soybean, corn, canola/rapeseed, and cotton: Roundup Ready (active agent, glyphosate) and Liberty Link (active agent, glufosinate). This paper will be limited to the effects of only one trait; the herbicide, glyphosate and will look at performance and results established based on the findings. This paper will not address the processes of mutation and natural selection — as in cross- pollination or grafting — but rather the use of biotechnology to alter DNA to attain desired traits in field studies and the effects of non-
- 56. glyphosate resistant variety of soybean on mineral nutrients. Glyphosate is a non-selective herbicide registered for use on many food and non-food field crops as well as non-crop areas where total vegetation control is desired (1). When applied at lower rates, glyphosate also is a plant growth regulator (1). Glyphosate is usually formulated as an isopropylamine salt (2). At the time these studies were performed, the Roundup Ready formulation contained this salt as various glyphosate formulas later entered the market; formulations were modified (3). Some plants have been genetically engineered to be resistant to glyphosate and soybeans are an example of such a plant. Glyphosate acts by enzyme inhibition in the shikimic acid pathway (4). The target of the herbicide is the enzyme 5-enolpyruvylshikimate-3-phosphate synthetase (EPSPS) (4). Inhibition of EPSP disrupts plant synthesis of aromatic compounds such as vitamin K, ubiquinones, and the amino acids tryptophan, tyrosine, and phenylalanine (4). Glyphosate is absorbed across the plant surface and is translocated throughout the plant (4). The herbicide tends to accumulate in plant regions with actively dividing cells (4). Plants exposed to glyphosate display stunted growth, loss of green coloration, leaf wrinkling or malformation, and tissue death. Death of the plant may take several days to weeks (4-20 days) to occur (4). These amino acids are essential for crucial plant processes such as protein synthesis, cell wall formation, defense against pathogens and insects, production of hormones, and production of compounds required in energy transduction
- 57. such as plastoquinone (Duke 1988). Plastoquinone refers to any of a group of quinones that are involved in electron transport in chloroplasts during photosynthesis (5). A gene for glyphosate- tolerant EPSPS was isolated from the soil bacterium Agrobacterium sp. strain CP4 and was introduced into the soybean genome by means of the particle acceleration method (Barry et al. 1992; Padgette et al., 1996a). Upon glyphosate treatment, soybean expressing glyphosate- tolerant EPSPS remains unaffected because of the continued action of the introduced EPSPS that meets the plant’s need for aromatic amino acids. The chemical composition of seeds is basically determined by genetic factors and varies among different species and seed parts. However, it is influenced by environmental and cultural practices (Copeland & McDonald, 2001). Because of genetic factors, the chemical composition of seeds varies widely among species and even among varieties. 3 Every seed is genetically unique producing a population that respond best to changing or different environments because they are a product of sexual recombination. Therefore, seeds provide evolutionary advantages. However, a very important thing to note is that in addition to the manipulation of genes through crossing and selection, plant breeders have been able to manipulate the chemical composition of many domesticated
- 58. crops and increase their value as food, fiber, or raw material. The effects of glyphosate through genetic engineering of plants and selective breeding in addition to environmental conditions add much complexity to the desired outcomes. Thus, the reproductive background of the soybean along with an explanation of maturity grouping and growth stages would be beneficial in the understanding of the conventional reproductive and vegetative process, whereby, the transgenic process on the other hand is demonstrated in the objectives of one of the following studies. These will be important for the analysis of the studies as well as concluding the results. Re productive Background on Soybe an (Glycine max (L.) Me rr.), Maturity Groups and Growth Stage s Soybean is considered a self-pollinated species, propagated commercially by seed. Artificial hybridization is used for cultivar breeding. The soybean flower stigma is receptive to pollen approximately 24 hours before anthesis and remains receptive 48 hours after anthesis. The anthers mature in the bud and directly pollinate the stigma of the same flower. As a result, soybeans exhibit a high percentage of self-fertilization, and cross pollination is usually less than one percent (Caviness, 1966). A soybean plant can produce as many as 400 pods, with two to twenty pods at a single node. Each pod contains one to five seeds. Neither the seedpod, nor the seed, has morphological characteristics that would encourage
- 59. animal transportation (6). Because the first soybean study uses maturity groupings, a description identifying them is useful. Varieties grown in the United States are divided into 13 maturity groups (MG) (Wiatrak, et al., year?). The earlier varieties bloom when days are long and nights are short, while the later- maturing varieties bloom under relatively shorter days and longer nights. Earlier and later maturing groups develop differently and knowing the growth habit of different maturity groups (MG) can help with the crop management (Wiatrak et.al., year). Most indeterminate varieties are adapted to maturity group IV and earlier. These varieties have overlapping vegetative and reproductive growth stages (Wiatrak et.al., year). Terminal growth bud on the main stem continues to grow after the first bloom and most of the pods are on the main (Wiatrak et.al., year). Flowers and pods develop at different times and rates depending on node locations (Wiatrak et.al., year). Nodes with the earliest flowers located near the bottom of stem; therefore, an indeterminate plant may contain pods with developing seed at lower nodes while upper nodes contain only small pods or flowers (Wiatrak et.al., year). Most varieties with a determinate growth habit (maturity group V and later) have distinct vegetative and reproductive growth stages (Wiatrak et.al., year). Number of nodes and plant height of the main stem are terminated at the full bloom stage (R2) (Wiatrak et.al., year). However, branch growth continues after first bloom and the
- 60. number of pods often greater on branches than the main stem (Wiatrak et.al., year). See Table 1, Vegetative and Reproductive 4 Stages for the definition of the various stages and Figure 1, Illustrated Soybean Stages to understand the reproductive and vegetative stages. In addition to maturity growth, these stages illustrate where they occur. This is helpful when discussion of the timing of glyphosate application is performed. The early reproductive period (R1 to R5.5) is sensitive to altered source strength and crop growth rate (Palle Pedersen, 2003-2007). Pederson also indicated that yield is mostly determined by seed number. Neither of the two studies correlated this. Table 1. Ve ge tative & Reproductive Stages of De velopme nt of Soybe ans Ve ge tative Stage s Re productive Stage s VE (emergence) VC (cotyledon stage) V1 (first trifoliolate) V2 (second trifoliolate) V3 (third trifoliolate) V(n) (nth trifoliolate) V6 (flowering will soon start) R1 (beginning bloom, first flower) R2 (full bloom, flower in top 2 nodes)
- 61. R3 (beginning pod, 3/16" pod in top 4 nodes) R4 (full pod, 3/4" pod in top 4 nodes) R5 (1/8" seed in top 4 nodes) R6 (full size seed in top 4 nodes) R7 (beginning maturity, one mature pod) R8 (full maturity, 95% of pods on the plant are mature) Source: Nort h Dakot a St at e Universit y Figure 1, Illus trate d Soybe an Stage s Ve ge tative Stage s Re productive Stage s * V-Stage s * R- Stage s *VE,VC,V1,V2,V3, Vn * R1, R2, R3, …R8 * Starts at Flowe ring Source: Iowa St at e Universit y, Dept of Agronomy 5 MATERIALS AND METHODS Because soybean crops rate as the highest transgenic crop in the world, two soybean studies have been selected. See Table 2, Global Area of Transgenic Crops 1996-2002 by Crop. Observations from the table illustrate that soybeans are the most
- 62. genetically modified crop by acreage followed by corn as the second largest by acreage for genetic modification of crop. The important factor to mention is that most of these genetically modified crops that are planted in the fields are rotated by another genetically modified crop followed by yet another genetically modified crop. Hence, the undesirable trait of herbicide resistance and the growth of weeds that no longer respond to the chemical, glyphosate. See Table 3, Changes in the Pounds of Glyphosate Applied per Acre per Crop Year on Corn, Cotton, and Soybeans: 1996-2007. Table (this is Figure ) 2, Global Are a of Trans ge nic Crops 1996-2002 (Source: ht t p://cls.casa.colost ate.edu/t ransgeniccrops/references.html#James2002) Table 3, Change s in the Pounds of Glyphos ate Applie d pe r Acre pe r Crop Ye ar on Corn, Cotton, and Soybe ans : 1996-2007 Crop and Period Glyphosate Rate in 1996 Total Increase (Pounds active ingredient per Acre) Percent Change
- 63. Average Annual % Change in Period Noted Corn (1996-2005) 0.68 0.27 39% 4.3% Cotton (1996-2007) 0.63 1.26 199.8% 18.2% Soybean (1996-2006) 0.69 0.67 97.6% 9.8% Not e: All use dat a is from t he USDA Nat ional Agricult ural St at ist ics Service (NASS) annual surveys of pest icide use, and t ake int o account bot h changes in t he one-t ime rat e of application and t he average number of applicat ions per crop year. Corn was last surveyed by NASS in 2005, Cot t on in 2007, and Soybeans in 2006. (Source: www.organic-cent er.org) The above information is us e ful, but it is not Mate rials & Me thods. It can be move d to the “Introduction” s e ction. http://cls.casa.colostate.edu/transgeniccrops/references.html#Ja mes2002 http://www.organic-center.org/ 6 Firs t Soybe an Study - Mate rials and Me thods are lis ted from actual s tudy From the 1st soybean study, the objective was to evaluate the effects of glyphosate on root
- 64. colonization by Fusarium solani f. sp. glycines (Fsg) and development of sudden death syndrome (SDS) on Round Up Ready (RR) soybean. Ten Roundup Ready (RR) soybean cultivars from maturity group (MG) II to VI were used. There were two cultivars per maturity group. The cultivars were provided by Monsanto without disclosing their identity. Each cultivar was previously characterized for SDS resistance (by the companies) and was identified as either partially resistant or susceptible to SDS. The cultivars in each maturity group included one SDS resistant and one SDS susceptible cultivar. Five RR cultivar pairs that contrasted for SDS resistance from maturity groups (MG) II to VI were evaluated with and without glyphosate application. The Fsg root infection severity (IS), colony forming units per gram of root (CFU), SDS leaf scorch disease index (DX), and grain yield were determined. Each maturity group was considered a separate experiment. The cultivar pairs within each experiment were evaluated at two locations per year for two years. All fields were selected based on a history of uniform SDS leaf symptoms expression. All plots were established using conventional tilling. All plots were treated with a pre-emergence herbicide combination of 0.84 kg (active ingredient) a.i. ha_1 trifluralin [2,6-dinitro-N ,N-dipropyl-4-(trifluoromethyl)- benzamine] and 0.07 kg a.i. ha_1 imaziquin (2-[4,5-dihydro-4-methyl-4-(1-methylethyl)-5-oxo- 1H-imida zol-2-yl]-3- quinolinecarboxylic). Treatments consisted of glyphosate- sprayed and a non-sprayed control. At the R6 growth stage, subplots were rated for SDS disease incidence (DI) and disease severity
- 65. (DS). Disease incidence was the percent of plants in the subplot with visible SDS leaf symptoms. Disease severity (percentage leaf surface chlorotic/necrotic) was rated on a scale of 1 to 9 as described: (1 =0–10%/1–5%, 2= 10–20%/6–10%, 3=20– 40%/10–20%, 4=40–60%/20–40%, 5=>60%/=40%, 6=up to 33% premature defoliation, 7 = up to 66% premature defoliation, 8=>66% premature defoliation, and 9 = premature death of plant). Disease index (DX, expressed as %) was then calculated as (DI _ DS)/9, with a possible range of 0 (no disease) to 100 (death of all plants). Eight taproots were harvested from each subplot at R6 growth stage. Four roots were used for IS and four for CFU determination. For IS determination, taproots were washed and surface sterilized in 0.5% (v/v) sodium hypochlorite. Each taproot was cut into several 1- cmsegments. Ten root segments were randomly selected and placed on a Petri plate containing a selective medium composed of 20 g agar, 20 g sucrose, 1 g KH2PO4, 0.5 gMgSO4·7H2O, 1 g KNO3 and 1 L distille d water; autoclaved at 110°C for 40 min and cooled to 42°C before 0.3 g streptomycin sulfate, 0.1 g neomycin, 0.1 g chlortetracycline, 0.05 g rifampicin, and 0.23 g pentachloronitrobenze ne (PCNB) (Terrachlor, Uniroyal Chemical Co., Vaugntuk, CT) were added. Infection severity was determined as the percentage of root segments yielding slow- growing, blue fungus (Njiti et al., 1997). A total of 40 root segments from 4 taproots per subplot were used in IS determination. For determination of CFU, the four taproots from each subplot were treated as one sample. The roots were washed, surface- sterilized in 0.5% (v/v) sodium
- 66. hypochlorite , oven dried at 28°C for 48 h, ground using a Wiley cutting mill (Thomas Scientific, Swedesboro, NJ) to pass through a 40-mesh screen, weighed, and suspended in 2 L of distilled water. One mL of the suspension was transferred onto each of five Petri plates containing the selective medium described above. Plates were inoculated and incubated at room temperature for 14 d. The number of slow-growing, appressed, and blue fungal colonies (Rupe et al., 1996) was counted as CFUs. The CFU per gram of root tissue was calculated (Luo et al., 2001). At the R8 developmental stage, the middle two rows for each plot were harvested with a two-row combine. 7 The seeds were cleaned without losing broken seeds. Yield was calculated for each plot at 13 g kg _1 seed moisture content. Data were collected for root IS in all test environments, CFU in 10 environments (2 per MG) in 1998, disease index in 4 environments for MG II and III; 3 environments for MG V and VI and 0 environment for MG IV, and grain yield in 4 environments in MG II, III, IV, and V; and 3 environments in MG VI. In this study, environment was considered a random factor and cultivar and glyphosate were considered fixed factors. To avoid violation of the assumptions for analysis of variance, the CFU values were subjected to logarithmic transformation using the formula log10(CFU + 1). The values of DX and IS were
- 67. subjected to square root transformation using the formulae √(DX + 0.5) and √(IS + 0.5), respectively. Transformed data were subjected to analysis of variance (SAS Inst., 1985). Analysis of variance was conducted for combined environments to test possible interaction of treatments with environments. Se cond Soybe an Study - Mate rial and Me thods are lis ted from actual s tudy For the second soybean study: the objective was to study the effects of glyphosate drift on plant growth and concentrations of mineral nutrients in leaves and seeds of non-glyphosate resistant soybeans. It was demonstrated that glyphosate reduced seed and leaf concentrations of calcium, manganese, magnesium, and iron in non-glyphosate resistant soybean. The non- glyphosate resistant soybeans (Cultivar: Nova) were grown under greenhouse conditions equipped with an evaporative cooling system (24-28; 21-24°C day/night) under natural daylight during the summer season. The soil was transported from Turkey where soil Zn deficiency has been well documented (Cakmak et al., 1999). The concentrations of DTPA-extractable Zn, Fe, Mn, and Cu were 0.10, 5.6, 7.2, and 1.7, respectively measured according to the method described by Lindsay and Norvell, 1978. Soil was not inoculated with N-fixing bacteria. Eight seeds were sown per pot and after emergence the seedlings were thinned to four per pot. Plants were watered daily with deionized water. Two separate pot experiments were conducted in a randomized block design with 4 (in the first experiment) or 6
- 68. (in the second experiment) replications. In the first experiment, plants were grown for 3 weeks under greenhouse conditions, and foliar glyphosate applications were made at 13 days after planting. At harvest, the shoot apex together with the youngest expanded leaves was harvested to represent the young plant parts and the remaining leaves as old plant part. The leaf samples were analyzed for mineral nutrient concentrations as described below. In the second experiment, plants were grown until seed maturation in the plastic pots containing 2.8 kg loamy clay soil. In addition to the basal fertilizer treatment, 100mg N as Ca(NO3)2 and 50mg P and 63mg K as KH2PO4 per kg soil was applied into soil at the R1 growth stage. Glyphosate applications during the second experiment were made at the V4, V6 and early R1 stages. Plants were harvested at the grain maturation stage, and the grains harvested were used for determination of grain yield and for analysis of mineral nutrient concentrations. In all foliar applications, the isopropylamine salt of glyphosate (Roundup Ultra Herbicide, Monsanto Ltd., Adana, Turkey) with an active ingredient (a.i.) 480 g L−1 was used. In the first experiment, when plants were 13 days old, foliar applications of glyphosate was initiated and realized three times with two days intervals. The doses applied for simulating foliar glyphosate drift were 0.06, 0.2, and 0.6% of the recommended application rate (i.e. 1.44 kg ha−1 a.i. glyphosate applied with 200 L of water ha−1: 31.55mM glyphosate as active ingredient), which are equivalent to 19, 63 and 189µM glyphosate in the spray solution,
- 69. 8 respectively. These concentrations have been selected based on the preliminary tests to determine the different sub lethal doses of glyphosate and the selected doses were similar to those used previously by De Maria et al. (2006) and Eker et al. (2006). In the experiment done until seed maturation, the simulated drift rates of the glyphosate applied at the V4, V6 and early R1 stages and were 0, 0.3, 0.6, 0.9 and 1.2% of the recommended application rate which are equivalent to 0, 95, 189, 284 and 379µM glyphosate in the spray solution, respectively. Glyphosate solutions were freshly prepared before the foliar treatments. Applications were made onto the leaves using a plastic hand-sprayer until most of the leaves became wet but not allowing any surface runoff. Changes in levels of chlorophyll (SPAD value) were measured on the same area of the youngest expanded leaves before harvest using a chlorophyll meter (Minolta SPAD- 502, Japan). For the measurement of mineral nutrient concentrations, the dried and ground leaf and seed samples were digested in 2 ml 35% H2O2 and 4 ml 65% HNO3 by using a microwave digestion system (MarsExpress; CEM Corp., Matthews, NC, USA). The analysis of P, K, Mg, Ca, Mn, Fe, Zn and Cu was performed by using inductively coupled plasma optical emission spectrometry (ICP-OES) (Vista-Pro Axial; Varian Pty Ltd., Mulgrave, Australia). Total nitrogen concentrations of the samples were measured by an automated N
- 70. analyzer (TruSpec CN, LECO Corp., Michigan, USA). All treatments were performed in four and six independent replications in the first and second experiment, respectively. Differences among the means and treatments were compared by the least significant difference (LSD) test at P = 0.05 probability level. Shikimic acid accumulation was determined in the youngest leaves at the growing points and oldest trifoliate leaves using a modified method of Cromartie and Polge (2002). About 500mg (± 25 mg) of fresh leaf tissues was extracted in 5 ml of 0.25N HCl in an ice cold mortar and centrifuged at 15,000×g for 15min at +4 °C. The resulting supernatant was diluted with 0.25N HCl at a ratio of 1:10 (v:v) and directly used in the colorimetric assay. Aliquots of 200µL of 1:10 diluted samples were mixed with 400µL of reaction solution consisting of 0.25% periodic acid and 0.25% Na meta-periodate. All samples were incubated at room temperature for 1 h to oxidize the shikimic acid. Finally 400µL of quenching solution consisting of 0.6M NaOH and 0.22M Na2SO3 was added to yield a yellow color chromophore that correlates directly with the amount of shikimic acid in the samples. Concentration of shikimic acid was determined by measuring the absorbance at 380nm using a standard curve of 0– 200µM shikimic acid (S5375; Sigma, St. Louis, MO, USA) and presented on a fresh weight basis. RESULTS
- 71. Firs t Soybe an Study Re s ults lis ted are adapte d from actual s tudy There was significant (P ≤ 0.05) variation among environments in MG III, IV, V, and VI for IS; MG II and VI for CFU; MG II, III, and VI for DX. There were no significant Glyphosate X Environment interactions for any disease measure within any maturity groups. Across cultivars within each maturity group, there was no significant difference between glyphosate sprayed and non-sprayed subplots for all disease measures. There was no Glyphosate X Cultivar interaction in any disease measure within any maturity group. For each disease measure, significant variation between cultivars was only observed in some maturity groups. There was significant variation between cultivars for IS in MG IV and VI, for CFU in MG VI, and for DX in MG III 9 and VI. The SDS-resistant cultivar generally had less disease (as measured by IS, CFU, and DX) than the SDS-susceptible cultivar except for IS in MG III, V, and VI. The application of glyphosate did not reduce yield in this study. There was significant Glyphosate X Cultivar interaction for yield in MG VI. In MG VI, the SDS-susceptible cultivar sprayed with glyphosate had significantly higher grain yield than the non-sprayed. In this study root colonization by Fsg and SDS leaf symptoms
- 72. did not significantly increase following the application of glyphosate. Data from this study indicate that the development of SDS on RR soybean is influenced by the genotype of the cultivar. Farmers planting RR soybean in Fsg-infested fields are encouraged to select cultivars that have been shown to be resistant to SDS. See Figure 2, Bar graphs of glyphosate cultivar interaction means for yield. The study was performed by Victor N. Njiti, Oval Myers Jr., Daniel Schroeder, and David A. Lightfoot and published in Agron. J. 95:1140-1145 (2003). Fig. 2. Bar graphs of Glyphos ate X Cultivar inte raction me ans for yie ld. Clust ers of bars for MG II t o V are averaged over four environment s and MG VI is averaged over t hree environments. Source: Agronomy Journal, Vol. 95, Sept -Oct 2003 Se cond Soybe an Study Re s ults lis ted are adapte d from actual s tudy The effect of foliar-applied glyphosate on the shoot growth and leaf concentrations of mineral nutrients was first studied in 21-dayold plants by analyzing young and old leaves separately. The first reaction of plants to increasing glyphosate application up to 0.6% of the recommended dose was the development of chlorosis on the youngest leaves. As expected, chlorophyll concentrations (SPAD values) showed a clear decrease by glyphosate. Increasing application of glyphosate significantly reduced dry weight of
- 73. young leaves, but did not affect the dry weight of the old leaves. The dry weight ratio of older parts to younger parts of plants was nearly 2 at the nil glyphosate treatment and increased to about 10 at the highest glyphosate treatment. Increasing rates of glyphosate caused marked increases in shikimate concentrations of Yi el d/ M g/ H a Maturity Group (Mg) Sprayed_S Non-Spray_S Sprayed_R Non-Spray_R 10 young parts of plants; but, remained less effective on the shikimate concentrations in the old parts of plants. Among the mineral nutrients analyzed, the leaf concentrations of K, P, Cu and Zn were not affected, or even increased significantly in case of P and Cu in young leaves by glyphosate. Phosphorus concentrations of young leaves showed significant increases by increasing glyphosate rate that might be related to accumulation
- 74. of P-containing glyphosate in young parts of plants. In the case of Fe concentrations of leaves, there were inconsistent changes by glyphosate applications. But, at the highest glyphosate rate, leaf concentrations of Fe showed clear declining tendency when compared to other glyphosate treatments. In contrast to other mineral nutrients analyzed, the leaf concentrations of Ca, Mn and Mg were reduced greatly by glyphosate, particularly Ca and Mn in young leaves. For example, in young leaves, the concentration of Ca was reduced from 14.9 to 9.0mgkg−1 and Mn was reduced from 182 to 29mgkg−1. In the second experiment, plants were grown until grain maturation, and glyphosate was sprayed three times at the V4, V6 and early R1 stages. Distinct decreases in shoot biomass production and seed yield by glyphosate were found at the higher glyphosate rates (e.g., 0.9 and 1.2% of the recommended dose) which also resulted in development of chlorosis on young leaves. When compared to the shoot dry weight, seed yield was more clearly declined by glyphosate. At the 1.2% glyphosate application, seed yield was declined by nearly 5-fold when compared to the plants without glyphosate application; but, this decrease was only 2.8-fold for shoot dryweight, indicating higher sensitivity of generative organs to glyphosate. Increases in glyphosate application resulted in significant changes in seed concentrations of all measured elements with exception of P. At the highest level of the glyphosate application, the seed concentrations of N, K, Zn and Cu were significantly increased when compared to the control
- 75. plants without glyphosate treatment. By contrast, the seed concentrations of Ca, Mn, Fe and Mg were significantly reduced by the highest rates of glyphosate, particularly in the case of Ca and Mn (Table 4). To verify such clear effects of glyphosate on seed concentrations of Mn and Ca and partly on Fe and Mg, this experiment was repeated by using 0, 0.3 and 1.2% glyphosate doses, and the results obtained. The effects of glyphosate drift on plant growth and concentrations of mineral nutrients in leaves and seeds of non-glyphosate resistant soybeans demonstrated in Table 4, of the foliar-applied glyphosate on the shoot growth and leaf concentrations of mineral nutrients in 21-day old plants by analyzing young and old leaves separately. The first reaction of plants to increasing glyphosate application up to 0.6% of the recommended dose was the development of chlorosis on the youngest leaves. The chlorophyll concentrations (SPAD values) showed a clear decrease by glyphosate. Increasing application of glyphosate significantly reduced dry weight of young leaves, but did not affect the dry weight of the old leaves (Table 4). The dry weight ratio of older parts to younger parts of plants was nearly 2 at the nil glyphosate treatment and increased to about 10 at the highest glyphosate treatment (Table 4). Increasing rates of glyphosate caused marked increases in shikimate concentrations of young parts of plants; but, remained less effective on the Shikimate concentrations in the old parts of plants (Table 4).
- 76. 11 Table 4. Effe ct of incre as ing glyphos ate rate s on SPAD value s (chlorophyll) and dry matte r production of young and old le ave s of 21-day-old s oybe an plants grown unde r gre e nhouse conditions . T he values represent means of four independent replicat ions. Glyphosate rate(% of recommended)a SPAD value Dry Matter Production Shikimate Young leaves (mg plantµ 1) Old leaves (mg plantµ 1) Young leaves (µ mol g−1 FW) Old leaves (µ mol g−1 FW) a Glyphosat e was applied t o foliage at t he concent rations of 0.06% (19_M glyphosate), 0.2% (63_M glyphosat e) and 0.6% (189_M glyphosat e) of t he recommended applicat ion rate for
- 77. weed cont rol. Among the mineral nutrients analyzed, the leaf concentrations of K, P, Cu and Zn were not affected, or even increased significantly in case of P and Cu in young leaves by glyphosate (Table 5). Phosphorus concentrations of young leaves showed significant increases by increasing glyphosate rate that might be related to accumulation of P- containing glyphosate in young parts of plants (Table 5). In the case of Fe concentrations of leaves, there were inconsistent changes by glyphosate applications. But, at the highest glyphosate rate, leaf concentrations of Fe showed a clear declining tendency when compared to other glyphosate treatments (Table 5). In contrast to other mineral nutrients analyzed, the leaf concentrations of Ca, Mn and Mg were reduced greatly by glyphosate, particularly Ca and Mn in young leaves (Table 5). For example, in young leaves, the concentration of Ca was reduced from 14.9 to 9.0mgkgµ1 and Mn was reduced from 182 to 129mgkgµ1. In the second experiment, plants were grown until grain maturation, and glyphosate was sprayed three times at the V4, V6 and early R1 stages. Distinct decreases in shoot biomass production and seed yield by glyphosate were found at the higher glyphosate rates (e.g., 0.9 and 1.2% of the recommended dose) which also resulted in development of chlorosis on young leaves (Fig. 2; Table 3). When compared to the shoot dry weight, seed yield was more clearly declined by glyphosate. At the 1.2% glyphosate application, seed yield was declined by nearly 5- fold when compared to the plants without glyphosate application; but, this decrease was only
- 78. 2.8-fold for shoot dry weight, indicating higher sensitivity of generative organs to glyphosate. Increases in glyphosate application resulted in significant changes in seed concentrations of all measured elements with exception of P (Table 5). At the highest level of the glyphosate application, the seed concentrations of N, K, Zn and Cu were significantly increased when compared to the control plants without glyphosate treatment. By contrast, the seed concentrations of Ca, Mn, Fe and Mg were significantly reduced by the highest rates of glyphosate, particularly in the case of Ca and Mn (Table 5). To verify such clear effects of glyphosate on seed concentrations of Mn and Ca and partly on Fe and Mg, this experiment was repeated by using 0, 0.3 and 1.2% glyphosate doses, and the results obtained confirmed the results given in Table 5 (no data shown). 0 3 4.4 183 346 1.6 2.4 0.06 31.9 103 353 1.4 2.2 0.2 23.0 120 373 9.3 2.2 0.6 12.0 40 440 34.6 6.3 LSD0.05 1.6 33 NS 3.2 1.7 12
- 79. Table 5. Effe ct of incre as ing glyphos ate rate s on the concentrations of mine ral nutrie nts in young and old le ave s of 21-day-old s oybe an plants grown unde r gre e nhous e conditions . T he values represent means of four independent replicat ions. Glyphosate rate (% of recommended)a P (gkg−1 DW) K (g kg−1 DW) Ca (g kg−1 DW) Mg (g kg−1 DW) Fe (mg kg−1 DW) Mn (mg kg−1 DW) Zn (mg kg−1 DW) Cu (mg kg−1 DW) Young leaves
- 80. 0 4.5 33.7 14.9 6.4 45 182 81 5.5 0.06 5.0 28.6 12.5 6.1 59 152 78 5.8 0.2 5.2 30.9 11.2 5.6 53 148 77 6.1 0.6 6.0 28.3 9.0 4.6 42 129 89 7.2 LSD0.05 0.9 NS 1.0 0.5 14 25 NS 0.8 Old leaves 0 2.3 26.3 22.3 8.8 49 232 93 5.5 0.06 2.2 24.0 18.4 7.2 54 160 78 4.8 0.2 2.3 25.6 19.2 7.6 51 190 84 4.9 0.6 2.3 25.2 15.6 5.8 40 121 65 4.1 LSD0.05 NS NS NS 2.7 NS 75 NS NS a Glyphosat e was applied t o foliage at t he concent rations of 0.06% (19µM glyphosat e), 0.2% (63µM glyphosat e) and 0.6% (189µM glyphosat e) of t he recommended applicat ion rat e for weed cont rol. Reproductive organs are known to be more sensitive to glyphosate than the vegetative tissues. The reported decreases in seed concentration of Fe, Mn, Ca and Mg by glyphosate raise concerns in terms of seed quality. Seed reserves of mineral nutrients play an important role in seed viability and seedling vigor and establishment, particularly under adverse soil conditions (Welch, 1999). It is of great importance to examine the concentrations of mineral nutrients in grains harvested in cropping systems with frequent glyphosate applications. Preharvest application of glyphosate to stimulate grain maturation is a common practice in many cropping systems. In most cases, this practice is, however, associated with poor seed germination and reduced seedling vigor (Bennett and Shaw, 2000; Baig et al., 2003). Such adverse effects of pre-harvest applied glyphosate on seed germination and seedling growth
- 81. might also be related to the reduction or physiological inactivation of mineral nutrients in seeds, such as Ca and Mn. For better understanding and characterization of the adverse effects of glyphosate on plant growth, future studies should also focus on differentiation between bound and unbound divalent cations in the glyphosate-treated plants. Currently, experiments are on- going to test the role of glyphosate on physiological availability of divalent cations by measuring the activity of enzymes which are dependent on those cations. The study was performed by Ismail Cakmak, Atilla Yazici, Yusuf Tutus, Levent Ozturk Sabanci University, Faculty of Engineering and Natural Sciences, 34956 Istanbul, Turkey. See Table 6, Effect of increasing glyphosate rates on grain and shoot matter production of soybean plants, and Figure 3, Effect of increasing glyphosate rates on growth of soybean plants. 13 Table 6. Effe ct of incre as ing glyphos ate rate s on grain and s hoot dry matte r production of
- 82. s oybe an plants grown until grain maturation s tage unde r gre e nhouse conditions. T he values represent means of six independent replicat ions. Glyphosat e rat e (% of recommended)a Seed yield (g plant -1) Shoot yield (g plant -1) 0 12.5 19.3 0.3 13.4 18.7 0.6 12.1 20.0 0.9 9.2 14.6 1.2 2.3 6.8 LSD0.05 1.9 2.6 a Glyphosat e was applied t o foliage at t he concent rations of 0.3% (95µM glyphosat e), 0.6% (189µM glyphosat e), 0.9% (284µM glyphosat e) and 1.2% (379µM glyphosat e) of t he recommended applicat ion rat e for weed cont rol. Fig. 3. Effe ct of incre as ing glyphos ate rate s on growth of s oybe an plants unde r gre e nhouse conditions . T he values on t he pot s represent % of t he recommended applicat ion rat e for weed cont rol corresponding t o 0, 95, 189, 284 and 379µM glyphosat e. DISCUSSION Herbicide resistance, insect resistance, yield, vigor, viability and nutrition are some of the reasons that transgenic seeds are being adopted. The reason Roundup Ready soybeans were created was to reduce the use of pesticide and not to increase
- 83. yield. As a result, there is more pesticide use on soybeans since RR soybeans have been on the market. Glyphosate use increased more than six-fold between 1992 and 2002, to become the most used herbicide in the United States (Gianessi and Reigner, 2006). Most of this increase is due to the adoption of Genetically Resistant Crops (GRCs). (Antonio L. Cerdeira and Stephen O. Duke, 2006). The most striking finding is that GE crops have been responsible for an increase of 383 million pounds of herbicide use in the U.S. over the first 13 years of commercial use of GE crops 1996-2008 (Benbrook 2009). The average rate of herbicides applied to conventional soybean acres dropped from 1.19 pounds of active ingredient per acre in 1996 to 0.49 pounds in 2008. (Figure 4.0). The steady reduction in the rate of application of conventional soybean herbicides accounts for roughly one-half of the difference in herbicide use on GE versus conventional soybean acres. The increase in the total pounds of herbicides applied to HT soybean acres, from 14 0.89 pounds in 1996 to 1.65 pounds in 2008, accounts for the other one-half of the difference (Benbrook 2009). From another study performed by Benbrook (2001), states the following about RR soybean herbicide use:
- 84. • Slightly more pounds of herbicides are applied on the average acre of Roundup-Ready (RR) soybeans compared to the average acre planted to conventional soybean varieties. • Fewer herbicide active ingredients are applied on the average acre of RR soybeans relative to the average conventional acre. • Average per acre pounds of herbicide applied on RR soybeans exceeds by 2- to 10-fold herbicide use on the approximate 30% of soybean acres where farmers depend largely on low-dose imidazolinone and sulfonylurea herbicides. • Herbicide use on RR soybean acres is gradually rising as a result of weed shifts, late- season weed escapes leading to a buildup in weed seedbanks, and the loss of susceptibility to glyphosate in some weed species (Hartzler, 1999; HRAC, 2001). However, Benbrook also stated the obvious that farmers have embraced the technology because it greatly simplifies soybean weed management and provides additional degrees of freedom in managing weeds (Gianessi and Carpenter, 2000; ERS, 1999). Figure 4.0. He rbicide Us e Rate on All RR and Conve ntional Soybe an Acre s A study performed at the University of Missouri, herbicide-
- 85. tolerant soybeans appear to suffer what is referred to as "yield drag." (7,8). It explains that in some areas and on some farms the tendency of Roundup Ready soybean varieties to yield less than their comparable, conventional counterparts although, variable, but overall, they appear to average yields that are five to ten percent lower per acre. 15 In addition, they stated that they experienced impaired root development, nodulation, and that nitrogen fixation is likely account for the yield drag (7, 8). Drought conditions worsen the effects. The bacterium that facilitates nodulation and nitrogen fixation in the root zone is apparently sensitive to both Roundup and drought (7, 8). University of Missouri scientists reported problems with germination of Roundup Ready soybeans in the 2001 crop year (8). Experiments conducted in 1997 through 2000 at two Missouri locations revealed that Roundup Ready soybeans receiving glyphosate at recommended rates had significantly higher incidence of Fusarium on roots within one week of application compared with" soybeans that did not receive glyphosate, reported Pat Donald, MU plant pathologist, and Robert Kremer, an MU soil scientist and USDA Agricultural Research Service microbiologist (8). It has also reported increased levels of cracked soy beans at harvest due to dry weather - work has already established that RR soybeans are
- 86. especially vulnerable in drought compared to conventional varieties (7, 8). This was followed by poor germination from many soy seed bags when planting took place in the spring. University of Arkansas scientists have shown that root development, nodulation and nitrogen fixation are impaired in some RR soybean varieties and that the effects are worse under conditions of drought stress or in relatively infertile fields (9). In reference to the Reproductive Soybean Maturity section mentioned earlier, Wiatrak et.al., indicated that adequate soil moisture from bloom through pod fill is important for good yields, farmers should consider planting varieties from more than one maturity group to reduce the risks of drought damage during pod fill. These findings support the first soybean study in this paper where they evaluated the effects of glyphosate on root colonization by Fsg and development of SDS on RR soybeans and it was recommended that farmers planting RR soybeans in Fsg infested fields are encouraged to select cultivars that are resistant to SDS. Table7, RR Soybean Yield Compared to Conv Varieties. Table 7. Roundup Re ady (RR) Soybe an Yie ld Compare d to Conve ntional (Conv) Varie tie s in Eight State s , 1998 [bus hels pe r acre ] States Trial Mean Top Five Varieties
- 87. Top Variety Conv RR Conv RR Conv RR Illinois 58 60 65 65 67 67 Iowa 61 57 64 60 66 60 Michigan 66 64 74 69 78 70 Minnesota 66 61 73 67 74 69 Nebraska 58 51 65 58 66 60 Ohio 60 58 67 63 69 65 South Dakota 49 44 54 50 56 51 Wisconsin 71 69 85 82 87 84 Source: ‘P erformance of T ransgenic Soybeans – Nort hern U.S.’, E.S. Oplinger, M.J. Mart inka, K.A. Schmit z. 16 From a nutritional standpoint, an abstract of a study (Lappe, et. al.) published in the Journal of Medicinal Foods (Vol. 1, No. 4) claims that Roundup Ready soybeans may have reduced levels of isoflavones. The authors further claim the implications are meaningful since isoflavones are potentially beneficial nutritional components in soybeans. Dr. Clare Hasler, Executive Director
- 88. of the Functional Foods Health Program at the University of Illinois Urbana-Champaign, and a member of the Journal of Medicinal Foods' editorial review board, expressed concern about the Lappe paper. Dr. Hasler stated, "Concluding that the results of the Lappe paper are biologica lly relevant would be inappropriate and misleading since the scientific literature clearly suggests that isoflavone amounts in soybeans can vary as much as 300 percent or more." A publication by the University of Illinois shows that numerous environmental factors, such as weather during the growing season, and even the slope of the field where the soybeans are grown, can lead to variability in the isoflavone content of soybeans. "Variability is due to the varietal component and the environmental component," said Dr. Don Bullock, Associate Professor of Biometry, at the University of Illinois at Urbana-Champaign. "Right now, the environmental effect is far greater than the varietal effect." These publications and comments support the findings in the second soybean study in this paper where the reported decreases in seed concentration of Fe, Ca, Mn and Mg by glyphosate raised concerns in terms of seed quality in that seed reserves of mineral nutrients play a important role in seed viability, and seedling vigor and establishment, particularly under adverse soil conditions. Therefore, environment is a significant variable in addition to soil. However, in the cases presented here, there are additional reasons that may need to be considered in order to grant the crop grower the full economic
- 89. benefits that come with such guarantees such as herbicide resistance, increased yields, nutrient composition. The costs of weed control, the equipment needed (including maintenance) to collect seeds, costs of conventional breeding to obtain yields without the added costs of additional herbicide when added with the high cost of the transgenic seeds. Based on the numbers in the above tables, it seems that some growers may even come out ahead with the use of selecting particular cultivars for their intended purpose based on their soil, and environmental conditions. The overwhelming evidence suggests that there needs to be additional research that performs tight studies that mimic identical situations. For example, studies suggest that there exists different genes used throughout the years (improvements made over prior years for RR crops, i.e. stacked genes), climate is always variable, application of herbicide/insecticide timing is variable (before, during and after harvest), not to mention soil conditions and timing of planting, use of various maturity groups, and as one of the publications mentioned, even consider the slope of the field where soybeans are grown. It is very well known that the environment plays a significant role in determining additional stress levels that add a variable of complexity to growing any type of crop. The objective of this paper is to demonstrate the effects that occur with using a glyphosate resistant soybean crops with genetic engineering and using glyphosate on non-resistant soybean crops with desirable traits such as increasing yield, resistance to herbicide (in the
- 90. case of the transgenic soybean study without adverse affects), and improve the nutritional value of food. The outcome of these results leads to the conclusive evidence that there is more complexity as all the variables are difficult to test at any one time for consistent results and more rigorous scientific studies are needed. 17 CONCLUSION Trials are typically conducted in different regions of a state and cover different maturity groups at different stages of growth. Soybean varieties are often sold and studied within maturity groups. In general, the longer the maturity period for a variety, the higher the expected yields. In the second soybean study it was difficult to compare maturity groups to the first soybean study as they used the vegetative or reproductive stages. It would have been helpful to tie these together to observe those stages within the maturity groups for concentrations of mineral nutrients. It is inappropriate to compare the yields harvested of a long season variety in contrast to a short season one as the first study also had overlapping maturity groups. In some of the states where these trials have been carried out used a variety of tillage and planting systems. The first soybean study used conventional tillage when establishing their plot
- 91. and it was treated with a pre-emergent herbicide combination. The study also had various soil conditions, silty, clay, loam combination and fine-loamy, mixed, superactive. In the second study, the soil was transported from the Eskisehir region in Central Anatolia, Turkey where Zn deficiency is well documented. In summary, there is not one “cookie cutter” transgenic seed that will work for everyone in every situation. After all, Mother Nature breeds seeds that are best adapted to the environment. The seeds have survived this long. Everything else is just a gamble. It is extremely complicated to understand the biological evolution and the diversity of life and bring in manipulating a few genes in seeds. Seeds are life. The heritable characteristics, which can be biochemical and anatomical, largely determine what capabilities an organism will have, how it will behave, and how likely it is to survive and reproduce. This is not well known with transgenic seeds. The variation of organisms within a species increases the chance of survival of the species, and how the great diversity of species on Earth increases the chance of survival of life in the event of major global changes. How can any transgenic seeds do that? This would mean that science can predict the future and “make” seeds accordingly. Is this ideal of Genetically Engineered Seeds? As the tables and the content of information within them as presented in this paper indicate that the jury is still out. We just do not know the consequences of
- 92. what we have done so far. To march forward without additional scientific data is simply not science. The charts below represent a simple summary. Be ne fits of Trans ge nics Crop/ Cultivar Studies Growth Conditions Germination Vigor Viability Persistence Longevity Less tilling Less soil erosion Less pesticide use Selective Breeding/ Cultivar just as good Soybean1/ Unknown
- 93. Field Variable Variable Variable Variable Unknown Yes No Yes Soybean2/ Nova Greenhouse Variable Variable Variable No Unknown N/A No Yes 18 Ris ks of Trans ge nics Crop/ Cultivar Studies More herbicide /insecticide use More weeds or weed resistance Unwanted gene flow Irreparable changes in species diversity and genetic diversity within a species Soybean1/ Unknown Yes Yes Undetermined Unknown Soybean2/
- 94. Nova Yes Yes Undetermined Unknown Good discussion and conclusions! Generally, the “Conclusion” section does not include tables. Your references are a bit confusing. Most science journals do not number their sources in References or, more often, Literature Cited. When a format is set for the Literature Cited, remain true to the format. Your references look as though your borrowed them from different sources and kept their formats (which are not the same). But you should determine which style you will use for the paper and remain true to one format. Most are listed in alphabetical order by lead author last name – not numbered. REFERENCES 1. United States Environmental Protection Agency, Prevention, Pesticides and Toxic Substances, EPA-738-F-93-011, September 1993, http://www.epa.gov/oppsrrd1/REDs/factsheets/0178fact.pdf 2. Pesticide Information Profile, Extension Toxicology Network, 5/94, http://pmep.cce.cornell.edu/profiles/extoxnet/dienochlor- glyphosate/glyphosate-ext.html 3. Sorting Through the Glyphosate Jungle, Alan C. York, N. C. State University, http://www.ces.ncsu.edu/martin/glyphosate.html 4. National Pesticide Information Center (NPIC) Fact Sheet.
- 95. http://npic.orst.edu/factsheets/glyphotech.pdf 5. McGraw-Hill Dictionary of Environmental Science – Definition of plastoquinone. http://www.ecomii.com/dictionary/science/plastoquinone 6. Joint Meeting of the Chemicals Committee and Working Party on Chemicals, Pesticides and Biotechnology, Paris 2000, Environment Directorate, Series on Harmonization of Regulatory Oversight in Biotechnology No. 15, CONSENSUS DOCUMENT ON THE BIOLOGY OF GLYCINE MAX (L.) MERR. SOYBEAN, Unclassified, Section IV, Reproductive Biology, p.14. http://www.olis.oecd.org/olis/2000doc.nsf/LinkTo/NT00002C3 A/$FILE/00085953.PDF 7. University of Missouri Press Release, July 27, 2001. Bad news beans—A year of challenges confronts soybean growers. http://www.btinternet.com/~nlpWESSEX/Documents/Missouriso ybeans.htm 8. Environmental Impacts, MU researchers find fungi buildup in glyphosate-treated soybean fields, December 21, 2001. http://www.biotech-info. net/fungi_buildup2.html 9. Troubled Times Amid Commercial Success for Roundup Ready Soybeans, Glyphosate Efficacy is Slipping and Unstable Transgene, Expression Erodes Plant Defenses and Yields, AgBioTech InfoNet Technical Paper Number 4, May 3, 2001. http://www.btinternet.com/~nlpwessex/Documents/Benbrooksoy report. htm
- 96. http://www.epa.gov/oppsrrd1/REDs/factsheets/0178fact.pdf http://pmep.cce.cornell.edu/profiles/extoxnet/dienochlor- glyphosate/glyphosate-ext.html http://www.ces.ncsu.edu/martin/glyphosate.html http://npic.orst.edu/factsheets/glyphotech.pdf http://www.ecomii.com/dictionary/science/plastoquinone http://www.olis.oecd.org/olis/2000doc.nsf/LinkTo/NT00002C3 A/$FILE/00085953.PDF http://www.btinternet.com/%7EnlpWESSEX/Documents/Missou risoybeans.htm http://www.btinternet.com/%7EnlpWESSEX/Documents/Missou risoybeans.htm http://www.btinternet.com/%7EnlpWESSEX/Documents/Missou risoybeans.htm http://www.biotech-info.net/fungi_buildup2.html http://www.btinternet.com/%7Enlpwessex/Documents/Benbrook soyreport.htm 19 Barry et al. 1992; Padgette et al. 1996a, http://www.agbios.com/docroot/artic les/09-215-002.pdf Caviness, C.E. 1996. Estimates of natural cross-pollination in Jackson soybeans in Arkansas. Crop Sci. 6:211. Cerdeira, Antonio L. and Duke, O. Stephen, The Current Status and Environmental Impacts of Glyphosate-Resistant Crops, Published online 9 August 2006, Published in J Environ Qual
- 97. 35:1633-1658 (2006), DOI: 10.2134/jeq2005.0378, http://jeq.scijourna ls.org/cgi/content/abstract/35/5/1633 Benbrook, Charles, Nov 2009, Crops on Pesticide Use in the United States: The First Thirteen Years, The Organic Center Report, www.organic-center.org Benbrook, Charles, Oct 2001, Pesticide Outlook, Do GM Crops Mean Less Pesticide Use? http://www.mindfully. org/Pestic ide/More-GMOs-Less- Pesticide.htm Benbrook, Charles, Evidence of the Magnitude and Consequences of the Roundup Ready Soybean Yield Drag from University-Based Varietal Trials in 1998, Ag BioTech InfoNet Technical Paper Number 1 13jul99, http://www.mindfully.org/GE/RRS-Y ie ld-Drag.htm Copeland & McDonald, 2001, Seed Science & Technology, p. 59. D.A. McWilliams , D.R. Berglund, G.J. Endres, North Dakota State University and University of Minnesota, Soybean Growth and Management Quick Guide, A- 1174, June 1999, Reviewed and Reprinted August 2004, http://www.ag.ndsu.edu/pubs/plantsc i/rowcrops/a1174/a1174w.htm Duke, S.O. 1988. Glyphosate. p. 1–70, P.C. Kearney, D.D. Kaufmann (ed.) Herbicides: Chemistry, degradation and mode of action Vol. III. Marcel Dekker, New York, NY, USA Dr. E. S. Oplinger, Dr. M. J. Martinka, and Dr. K. A. Schmitz, "Performance of Transgenic
- 98. Soybeans in the Northern U.S., 1998, Dept. of Agronomy, UW- Madison, Pedersen, Palle, Soybean Physiology: Yield, Maturity Groups, and Growth Stages, Dept of Agronomy Iowa State Univ., 2003- 2007, http://www.plantmanageme ntnetwork.org/infocenter/topic/soybeanrust/2007/presentations/ Peder sen.pdf Schahczenski, Jeff and Adam, Katherine, Transgenic Crops, National Sustainable Agriculture Information Service, ATTRA Publication #IP189, 2006, http://attra.ncat.org/attra- pub/geneticeng.html http://www.agbios.com/docroot/articles/09-215-002.pdf http://jeq.scijournals.org/cgi/content/abstract/35/5/1633 http://www.organic-center.org/ http://www.mindfully.org/Pesticide/More-GMOs-Less- Pesticide.htm http://www.mindfully.org/GE/RRS-Yield-Drag.htm http://www.ag.ndsu.edu/pubs/plantsci/rowcrops/a1174/a1174w.h tm http://www.plantmanagementnetwork.org/infocenter/topic/soybe anrust/2007/presentations/Pedersen.pdf http://www.plantmanagementnetwork.org/infocenter/topic/soybe anrust/2007/presentations/Pedersen.pdf http://attra.ncat.org/attra-pub/geneticeng.html http://attra.ncat.org/attra-pub/geneticeng.html
- 99. 20 Taylor, N. B.; Fuchs, R. L.; MacDonald, J.; Shariff, A. R.; Padgette, S. R. Compositiona l Analysis of Glyphosate-Tolerant Soybeans Treated with Glyphosate. J. Agric. Food Chem. 1999, 47, 4469-4473. http://www.agbios.com/docroot/artic les/09-090- 006. pdf Wiatrak, Pawel, Shipe, Emerson and Norsworthy, Jason, Soybean maturity groups and growth habit, Clemson University, http://www.clemson.edu/edisto/soybeans/maturity_groups/ and http://www.clemson.edu/edisto/s oybeans/growth_stages/ http://oregonstate.edu/instruct/bi430-fs430/D ocuments- 2004/7B-MIN%20TILL%20A G/CAST- ComparEnvImpactGMOCrops-2002.pdf, Comparative Environmenta l Impacts of Biotechnology-derived and Traditional Soybean, Corn, and Cotton Crops, The Council for Agricultural Science and Technology (CAST) and The United Soybean Board, 2002. http://www.biotech-info. net/ASA_response.html , ASA Response to: "Alterations in Clinically Important Phytoestrogens in Genetically Modified, Herbicide- Tolerant Soybeans", ASA Confirms the Natural Variability of Isoflavones in Soybeans, June 23, 1999. http://www.ohcs.oregon.gov/ODF/BOARD/docs/FFAC_120707_ Comment_JPR_Glyphosate.pd f , Herbicide Fact Sheet, Journal of Pesticide Reform, Vol. 24, No. 4,Winter 2004.