SlideShare a Scribd company logo
1 of 44
Download to read offline
Example 15: Miles Run
Class Boundaries Frequency
5.5 – 10.5 1
10.5 – 15.5 2
15.5 – 20.5 3
20.5 – 25.5 5
25.5 – 30.5 4
30.5 – 35.5 3
35.5 – 40.5 2
Below is a frequency distribution of the number of miles run per week for a sample
of individuals. Find the variance and standard deviation
Example 15: Miles Run
Class Boundaries Frequency
5.5 – 10.5 1
10.5 – 15.5 2
15.5 – 20.5 3
20.5 – 25.5 5
25.5 – 30.5 4
30.5 – 35.5 3
35.5 – 40.5 2
Below is a frequency distribution of the number of miles run per week for a sample
of individuals. Find the variance and standard deviation
: =
∑( · ) 
  − ∑( · ) 
 
( − 1)
= =
 
 
Example 15: Miles Run
Class Boundaries Frequency
5.5 – 10.5 1
10.5 – 15.5 2
15.5 – 20.5 3
20.5 – 25.5 5
25.5 – 30.5 4
30.5 – 35.5 3
35.5 – 40.5 2
= ∑ 
  = 20
Below is a frequency distribution of the number of miles run per week for a sample
of individuals. Find the variance and standard deviation
: =
∑( · ) 
  − ∑( · ) 
 
( − 1)
=
Example 15: Miles Run
Class Boundaries Frequency x, Midpoint
5.5 – 10.5 1 (5.5+10.5)/2 = 8
10.5 – 15.5 2 (10.5+15.5)/2 = 13
15.5 – 20.5 3 (15.5+20.5)/2 = 18
20.5 – 25.5 5 (20.5+25.5)/2 = 23
25.5 – 30.5 4 (25.5+30.5)/2 = 28
30.5 – 35.5 3 (30.5+35.5)/2 = 33
35.5 – 40.5 2 (35.5+40.5)/2 = 38
= ∑ 
  = 20
Below is a frequency distribution of the number of miles run per week for a sample
of individuals. Find the variance and standard deviation
: =
∑( · ) 
  − ∑( · ) 
 
( − 1)
Example 15: Miles Run
Class Boundaries Frequency x, Midpoint f∙x
5.5 – 10.5 1 (5.5+10.5)/2 = 8 1∙8 = 8
10.5 – 15.5 2 (10.5+15.5)/2 = 13 2∙13 = 26
15.5 – 20.5 3 (15.5+20.5)/2 = 18 3∙18 = 54
20.5 – 25.5 5 (20.5+25.5)/2 = 23 5∙23 = 115
25.5 – 30.5 4 (25.5+30.5)/2 = 28 4∙28 = 112
30.5 – 35.5 3 (30.5+35.5)/2 = 33 3∙33 = 99
35.5 – 40.5 2 (35.5+40.5)/2 = 38 2∙38 = 76
= ∑ 
  = 20
Below is a frequency distribution of the number of miles run per week for a sample
of individuals. Find the variance and standard deviation
: =
∑( · ) 
  − ∑( · ) 
 
( − 1)
( · )
Example 15: Miles Run
Class Boundaries Frequency x, Midpoint f∙x
5.5 – 10.5 1 (5.5+10.5)/2 = 8 1∙8 = 8
10.5 – 15.5 2 (10.5+15.5)/2 = 13 2∙13 = 26
15.5 – 20.5 3 (15.5+20.5)/2 = 18 3∙18 = 54
20.5 – 25.5 5 (20.5+25.5)/2 = 23 5∙23 = 115
25.5 – 30.5 4 (25.5+30.5)/2 = 28 4∙28 = 112
30.5 – 35.5 3 (30.5+35.5)/2 = 33 3∙33 = 99
35.5 – 40.5 2 (35.5+40.5)/2 = 38 2∙38 = 76
= ∑ 
  = 20 ∑( · ) 
  = 490
Below is a frequency distribution of the number of miles run per week for a sample
of individuals. Find the variance and standard deviation
: =
∑( · ) 
  − ∑( · ) 
 
( − 1)
,
Example 15: Miles Run
Class Boundaries Frequency x, Midpoint f∙x x2
5.5 – 10.5 1 (5.5+10.5)/2 = 8 1∙8 = 8 82 = 64
10.5 – 15.5 2 (10.5+15.5)/2 = 13 2∙13 = 26 132 = 169
15.5 – 20.5 3 (15.5+20.5)/2 = 18 3∙18 = 54 182 = 324
20.5 – 25.5 5 (20.5+25.5)/2 = 23 5∙23 = 115 232 = 529
25.5 – 30.5 4 (25.5+30.5)/2 = 28 4∙28 = 112 282 = 784
30.5 – 35.5 3 (30.5+35.5)/2 = 33 3∙33 = 99 332 = 1089
35.5 – 40.5 2 (35.5+40.5)/2 = 38 2∙38 = 76 382 = 1444
= ∑ 
  = 20 ∑( · ) 
  = 490
Below is a frequency distribution of the number of miles run per week for a sample
of individuals. Find the variance and standard deviation
: =
∑( · ) 
  − ∑( · ) 
 
( − 1)
, ( · )
Example 15: Miles Run
Class Boundaries Frequency x, Midpoint f∙x x2 f∙x2
5.5 – 10.5 1 (5.5+10.5)/2 = 8 1∙8 = 8 82 = 64 1∙64 = 64
10.5 – 15.5 2 (10.5+15.5)/2 = 13 2∙13 = 26 132 = 169 2∙169 = 338
15.5 – 20.5 3 (15.5+20.5)/2 = 18 3∙18 = 54 182 = 324 3∙324 = 972
20.5 – 25.5 5 (20.5+25.5)/2 = 23 5∙23 = 115 232 = 529 5∙529 = 2645
25.5 – 30.5 4 (25.5+30.5)/2 = 28 4∙28 = 112 282 = 784 4∙784 = 3136
30.5 – 35.5 3 (30.5+35.5)/2 = 33 3∙33 = 99 332 = 1089 3∙1089 = 3267
35.5 – 40.5 2 (35.5+40.5)/2 = 38 2∙38 = 76 382 = 1444 2∙1444 = 2888
= ∑ 
  = 20 ∑( · ) 
  = 490
Below is a frequency distribution of the number of miles run per week for a sample
of individuals. Find the variance and standard deviation
: =
∑( · ) 
  − ∑( · ) 
 
( − 1)
( · )
Example 15: Miles Run
Class Boundaries Frequency x, Midpoint f∙x x2 f∙x2
5.5 – 10.5 1 (5.5+10.5)/2 = 8 1∙8 = 8 82 = 64 1∙64 = 64
10.5 – 15.5 2 (10.5+15.5)/2 = 13 2∙13 = 26 132 = 169 2∙169 = 338
15.5 – 20.5 3 (15.5+20.5)/2 = 18 3∙18 = 54 182 = 324 3∙324 = 972
20.5 – 25.5 5 (20.5+25.5)/2 = 23 5∙23 = 115 232 = 529 5∙529 = 2645
25.5 – 30.5 4 (25.5+30.5)/2 = 28 4∙28 = 112 282 = 784 4∙784 = 3136
30.5 – 35.5 3 (30.5+35.5)/2 = 33 3∙33 = 99 332 = 1089 3∙1089 = 3267
35.5 – 40.5 2 (35.5+40.5)/2 = 38 2∙38 = 76 382 = 1444 2∙1444 = 2888
= ∑ 
  = 20 ∑( · ) 
  = 490 ∑( · 2) 
  = 13310
Below is a frequency distribution of the number of miles run per week for a sample
of individuals. Find the variance and standard deviation
: =
∑( · ) 
  − ∑( · ) 
 
( − 1)
=
20 13310 − (490)
20(19)
=
266200 − 240100
380
=
26100
380
≈ 68.7
Example 15: Miles Run
Class Boundaries Frequency x, Midpoint f∙x x2 f∙x2
5.5 – 10.5 1 (5.5+10.5)/2 = 8 1∙8 = 8 82 = 64 1∙64 = 64
10.5 – 15.5 2 (10.5+15.5)/2 = 13 2∙13 = 26 132 = 169 2∙169 = 338
15.5 – 20.5 3 (15.5+20.5)/2 = 18 3∙18 = 54 182 = 324 3∙324 = 972
20.5 – 25.5 5 (20.5+25.5)/2 = 23 5∙23 = 115 232 = 529 5∙529 = 2645
25.5 – 30.5 4 (25.5+30.5)/2 = 28 4∙28 = 112 282 = 784 4∙784 = 3136
30.5 – 35.5 3 (30.5+35.5)/2 = 33 3∙33 = 99 332 = 1089 3∙1089 = 3267
35.5 – 40.5 2 (35.5+40.5)/2 = 38 2∙38 = 76 382 = 1444 2∙1444 = 2888
= ∑ 
  = 20 ∑( · ) 
  = 490 ∑( · 2) 
  = 13310
Below is a frequency distribution of the number of miles run per week for a sample
of individuals. Find the variance and standard deviation
: =
26100
380
≈ 68.7 : =
 
=
26100
380
 
≈ 8.3

More Related Content

Viewers also liked

Sample Standard Deviation
Sample Standard DeviationSample Standard Deviation
Sample Standard Deviationccooking
 
Relative frequency approximation Blood Types
Relative frequency approximation Blood TypesRelative frequency approximation Blood Types
Relative frequency approximation Blood Typesccooking
 
Weighted Mean - Helicopter Costs
Weighted Mean - Helicopter CostsWeighted Mean - Helicopter Costs
Weighted Mean - Helicopter Costsccooking
 
Weighted Mean - Class Average (Desk Work 6)
Weighted Mean - Class Average (Desk Work 6)Weighted Mean - Class Average (Desk Work 6)
Weighted Mean - Class Average (Desk Work 6)ccooking
 
Sample Standard Deviation - Desk Work 8
Sample Standard Deviation - Desk Work 8Sample Standard Deviation - Desk Work 8
Sample Standard Deviation - Desk Work 8ccooking
 
Population Standard Deviation - Desk Work 7
Population Standard Deviation - Desk Work 7Population Standard Deviation - Desk Work 7
Population Standard Deviation - Desk Work 7ccooking
 
Weighted Mean - New Diet Cola
Weighted Mean - New Diet ColaWeighted Mean - New Diet Cola
Weighted Mean - New Diet Colaccooking
 
Weighted Mean - Class Average
Weighted Mean - Class AverageWeighted Mean - Class Average
Weighted Mean - Class Averageccooking
 
Weighted Mean - GPA
Weighted Mean - GPAWeighted Mean - GPA
Weighted Mean - GPAccooking
 
Mean of a discrete random variable.ppt
Mean of a discrete random variable.pptMean of a discrete random variable.ppt
Mean of a discrete random variable.pptccooking
 
Variance and standard deviation of a discrete random variable
Variance and standard deviation of a discrete random variableVariance and standard deviation of a discrete random variable
Variance and standard deviation of a discrete random variableccooking
 
Indefinite pronouns üst seviye
Indefinite pronouns üst seviyeIndefinite pronouns üst seviye
Indefinite pronouns üst seviyeayse06inci
 
Indefinite Pronouns
 Indefinite Pronouns Indefinite Pronouns
Indefinite PronounsDiana Gamez
 
Sentence Pattern
Sentence PatternSentence Pattern
Sentence Patterncharity94
 
Indefinite pronouns powerpoint
Indefinite pronouns powerpointIndefinite pronouns powerpoint
Indefinite pronouns powerpointRoya Falatoonzadeh
 

Viewers also liked (16)

Sample Standard Deviation
Sample Standard DeviationSample Standard Deviation
Sample Standard Deviation
 
Relative frequency approximation Blood Types
Relative frequency approximation Blood TypesRelative frequency approximation Blood Types
Relative frequency approximation Blood Types
 
Weighted Mean - Helicopter Costs
Weighted Mean - Helicopter CostsWeighted Mean - Helicopter Costs
Weighted Mean - Helicopter Costs
 
Weighted Mean - Class Average (Desk Work 6)
Weighted Mean - Class Average (Desk Work 6)Weighted Mean - Class Average (Desk Work 6)
Weighted Mean - Class Average (Desk Work 6)
 
Sample Standard Deviation - Desk Work 8
Sample Standard Deviation - Desk Work 8Sample Standard Deviation - Desk Work 8
Sample Standard Deviation - Desk Work 8
 
Population Standard Deviation - Desk Work 7
Population Standard Deviation - Desk Work 7Population Standard Deviation - Desk Work 7
Population Standard Deviation - Desk Work 7
 
Weighted Mean - New Diet Cola
Weighted Mean - New Diet ColaWeighted Mean - New Diet Cola
Weighted Mean - New Diet Cola
 
Weighted Mean - Class Average
Weighted Mean - Class AverageWeighted Mean - Class Average
Weighted Mean - Class Average
 
Weighted Mean - GPA
Weighted Mean - GPAWeighted Mean - GPA
Weighted Mean - GPA
 
Mean of a discrete random variable.ppt
Mean of a discrete random variable.pptMean of a discrete random variable.ppt
Mean of a discrete random variable.ppt
 
Variance and standard deviation of a discrete random variable
Variance and standard deviation of a discrete random variableVariance and standard deviation of a discrete random variable
Variance and standard deviation of a discrete random variable
 
Indefinite pronouns üst seviye
Indefinite pronouns üst seviyeIndefinite pronouns üst seviye
Indefinite pronouns üst seviye
 
Indefinite Pronouns
 Indefinite Pronouns Indefinite Pronouns
Indefinite Pronouns
 
Kinds of paragraphs
Kinds of paragraphsKinds of paragraphs
Kinds of paragraphs
 
Sentence Pattern
Sentence PatternSentence Pattern
Sentence Pattern
 
Indefinite pronouns powerpoint
Indefinite pronouns powerpointIndefinite pronouns powerpoint
Indefinite pronouns powerpoint
 

Similar to Module 3 example 15

Unidad 2 ejercicios frecuencia1
Unidad 2 ejercicios frecuencia1Unidad 2 ejercicios frecuencia1
Unidad 2 ejercicios frecuencia1AralysRodriguez
 
Statistical Analysis using Central Tendencies
Statistical Analysis using Central TendenciesStatistical Analysis using Central Tendencies
Statistical Analysis using Central TendenciesCelia Santhosh
 
Juliaで学ぶ Hamiltonian Monte Carlo (NUTS 入り)
Juliaで学ぶ Hamiltonian Monte Carlo (NUTS 入り)Juliaで学ぶ Hamiltonian Monte Carlo (NUTS 入り)
Juliaで学ぶ Hamiltonian Monte Carlo (NUTS 入り)Kenta Sato
 
Quantitative techniques for MBA (QDM)
Quantitative techniques for MBA (QDM)Quantitative techniques for MBA (QDM)
Quantitative techniques for MBA (QDM)npazare
 
Business Statistics - Cumulative frequency
Business Statistics - Cumulative frequencyBusiness Statistics - Cumulative frequency
Business Statistics - Cumulative frequencyDeepukumar Rao
 
Solutions_Manual_to_accompany_Applied_Nu.pdf
Solutions_Manual_to_accompany_Applied_Nu.pdfSolutions_Manual_to_accompany_Applied_Nu.pdf
Solutions_Manual_to_accompany_Applied_Nu.pdfWaleedHussain30
 
Statistical process control ppt @ doms
Statistical process control ppt @ doms Statistical process control ppt @ doms
Statistical process control ppt @ doms Babasab Patil
 
Statistics (Mean, Median, Mode)
Statistics (Mean, Median, Mode)Statistics (Mean, Median, Mode)
Statistics (Mean, Median, Mode)Sherzad Daudzai
 
SUEC 高中 Adv Maths (Statistic).pptx
SUEC 高中 Adv Maths (Statistic).pptxSUEC 高中 Adv Maths (Statistic).pptx
SUEC 高中 Adv Maths (Statistic).pptxtungwc
 
Modeling Subsurface Heterogeneity by Coupled Markov Chains: Directional Depen...
Modeling Subsurface Heterogeneity by Coupled Markov Chains: Directional Depen...Modeling Subsurface Heterogeneity by Coupled Markov Chains: Directional Depen...
Modeling Subsurface Heterogeneity by Coupled Markov Chains: Directional Depen...Amro Elfeki
 
CLASS 10 MEAN MEDIAN MODE
CLASS 10 MEAN MEDIAN MODECLASS 10 MEAN MEDIAN MODE
CLASS 10 MEAN MEDIAN MODEAKBAR1961
 
Business statistics solved numericals
Business statistics solved numericalsBusiness statistics solved numericals
Business statistics solved numericalsAnurag Srivastava
 
An overview of statistics management with excel
An overview of statistics management with excelAn overview of statistics management with excel
An overview of statistics management with excelKRISHANACHOUDHARY1
 

Similar to Module 3 example 15 (20)

Unidad 2 ejercicios frecuencia1
Unidad 2 ejercicios frecuencia1Unidad 2 ejercicios frecuencia1
Unidad 2 ejercicios frecuencia1
 
Statistical Analysis using Central Tendencies
Statistical Analysis using Central TendenciesStatistical Analysis using Central Tendencies
Statistical Analysis using Central Tendencies
 
Arithmetic mean
Arithmetic meanArithmetic mean
Arithmetic mean
 
Juliaで学ぶ Hamiltonian Monte Carlo (NUTS 入り)
Juliaで学ぶ Hamiltonian Monte Carlo (NUTS 入り)Juliaで学ぶ Hamiltonian Monte Carlo (NUTS 入り)
Juliaで学ぶ Hamiltonian Monte Carlo (NUTS 入り)
 
Quantitative techniques for MBA (QDM)
Quantitative techniques for MBA (QDM)Quantitative techniques for MBA (QDM)
Quantitative techniques for MBA (QDM)
 
Dispersion uwsb
Dispersion   uwsbDispersion   uwsb
Dispersion uwsb
 
Measures of Dispersion.pptx
Measures of Dispersion.pptxMeasures of Dispersion.pptx
Measures of Dispersion.pptx
 
Business Statistics - Cumulative frequency
Business Statistics - Cumulative frequencyBusiness Statistics - Cumulative frequency
Business Statistics - Cumulative frequency
 
Solutions_Manual_to_accompany_Applied_Nu.pdf
Solutions_Manual_to_accompany_Applied_Nu.pdfSolutions_Manual_to_accompany_Applied_Nu.pdf
Solutions_Manual_to_accompany_Applied_Nu.pdf
 
Statistical process control ppt @ doms
Statistical process control ppt @ doms Statistical process control ppt @ doms
Statistical process control ppt @ doms
 
Statistics (Mean, Median, Mode)
Statistics (Mean, Median, Mode)Statistics (Mean, Median, Mode)
Statistics (Mean, Median, Mode)
 
SUEC 高中 Adv Maths (Statistic).pptx
SUEC 高中 Adv Maths (Statistic).pptxSUEC 高中 Adv Maths (Statistic).pptx
SUEC 高中 Adv Maths (Statistic).pptx
 
Describing Data: Numerical Measures
Describing Data: Numerical MeasuresDescribing Data: Numerical Measures
Describing Data: Numerical Measures
 
Modeling Subsurface Heterogeneity by Coupled Markov Chains: Directional Depen...
Modeling Subsurface Heterogeneity by Coupled Markov Chains: Directional Depen...Modeling Subsurface Heterogeneity by Coupled Markov Chains: Directional Depen...
Modeling Subsurface Heterogeneity by Coupled Markov Chains: Directional Depen...
 
S3 pn
S3 pnS3 pn
S3 pn
 
CLASS 10 MEAN MEDIAN MODE
CLASS 10 MEAN MEDIAN MODECLASS 10 MEAN MEDIAN MODE
CLASS 10 MEAN MEDIAN MODE
 
project designa.docx
project designa.docxproject designa.docx
project designa.docx
 
Business statistics solved numericals
Business statistics solved numericalsBusiness statistics solved numericals
Business statistics solved numericals
 
An overview of statistics management with excel
An overview of statistics management with excelAn overview of statistics management with excel
An overview of statistics management with excel
 
HIDRAULICA DE CANALES
HIDRAULICA DE CANALESHIDRAULICA DE CANALES
HIDRAULICA DE CANALES
 

Recently uploaded

Google Gemini An AI Revolution in Education.pptx
Google Gemini An AI Revolution in Education.pptxGoogle Gemini An AI Revolution in Education.pptx
Google Gemini An AI Revolution in Education.pptxDr. Sarita Anand
 
How to Create and Manage Wizard in Odoo 17
How to Create and Manage Wizard in Odoo 17How to Create and Manage Wizard in Odoo 17
How to Create and Manage Wizard in Odoo 17Celine George
 
Food safety_Challenges food safety laboratories_.pdf
Food safety_Challenges food safety laboratories_.pdfFood safety_Challenges food safety laboratories_.pdf
Food safety_Challenges food safety laboratories_.pdfSherif Taha
 
Accessible Digital Futures project (20/03/2024)
Accessible Digital Futures project (20/03/2024)Accessible Digital Futures project (20/03/2024)
Accessible Digital Futures project (20/03/2024)Jisc
 
This PowerPoint helps students to consider the concept of infinity.
This PowerPoint helps students to consider the concept of infinity.This PowerPoint helps students to consider the concept of infinity.
This PowerPoint helps students to consider the concept of infinity.christianmathematics
 
Jamworks pilot and AI at Jisc (20/03/2024)
Jamworks pilot and AI at Jisc (20/03/2024)Jamworks pilot and AI at Jisc (20/03/2024)
Jamworks pilot and AI at Jisc (20/03/2024)Jisc
 
General Principles of Intellectual Property: Concepts of Intellectual Proper...
General Principles of Intellectual Property: Concepts of Intellectual  Proper...General Principles of Intellectual Property: Concepts of Intellectual  Proper...
General Principles of Intellectual Property: Concepts of Intellectual Proper...Poonam Aher Patil
 
How to Add New Custom Addons Path in Odoo 17
How to Add New Custom Addons Path in Odoo 17How to Add New Custom Addons Path in Odoo 17
How to Add New Custom Addons Path in Odoo 17Celine George
 
HMCS Vancouver Pre-Deployment Brief - May 2024 (Web Version).pptx
HMCS Vancouver Pre-Deployment Brief - May 2024 (Web Version).pptxHMCS Vancouver Pre-Deployment Brief - May 2024 (Web Version).pptx
HMCS Vancouver Pre-Deployment Brief - May 2024 (Web Version).pptxmarlenawright1
 
Sociology 101 Demonstration of Learning Exhibit
Sociology 101 Demonstration of Learning ExhibitSociology 101 Demonstration of Learning Exhibit
Sociology 101 Demonstration of Learning Exhibitjbellavia9
 
Jual Obat Aborsi Hongkong ( Asli No.1 ) 085657271886 Obat Penggugur Kandungan...
Jual Obat Aborsi Hongkong ( Asli No.1 ) 085657271886 Obat Penggugur Kandungan...Jual Obat Aborsi Hongkong ( Asli No.1 ) 085657271886 Obat Penggugur Kandungan...
Jual Obat Aborsi Hongkong ( Asli No.1 ) 085657271886 Obat Penggugur Kandungan...ZurliaSoop
 
ICT role in 21st century education and it's challenges.
ICT role in 21st century education and it's challenges.ICT role in 21st century education and it's challenges.
ICT role in 21st century education and it's challenges.MaryamAhmad92
 
ICT Role in 21st Century Education & its Challenges.pptx
ICT Role in 21st Century Education & its Challenges.pptxICT Role in 21st Century Education & its Challenges.pptx
ICT Role in 21st Century Education & its Challenges.pptxAreebaZafar22
 
Holdier Curriculum Vitae (April 2024).pdf
Holdier Curriculum Vitae (April 2024).pdfHoldier Curriculum Vitae (April 2024).pdf
Holdier Curriculum Vitae (April 2024).pdfagholdier
 
Towards a code of practice for AI in AT.pptx
Towards a code of practice for AI in AT.pptxTowards a code of practice for AI in AT.pptx
Towards a code of practice for AI in AT.pptxJisc
 
REMIFENTANIL: An Ultra short acting opioid.pptx
REMIFENTANIL: An Ultra short acting opioid.pptxREMIFENTANIL: An Ultra short acting opioid.pptx
REMIFENTANIL: An Ultra short acting opioid.pptxDr. Ravikiran H M Gowda
 
On National Teacher Day, meet the 2024-25 Kenan Fellows
On National Teacher Day, meet the 2024-25 Kenan FellowsOn National Teacher Day, meet the 2024-25 Kenan Fellows
On National Teacher Day, meet the 2024-25 Kenan FellowsMebane Rash
 
80 ĐỀ THI THỬ TUYỂN SINH TIẾNG ANH VÀO 10 SỞ GD – ĐT THÀNH PHỐ HỒ CHÍ MINH NĂ...
80 ĐỀ THI THỬ TUYỂN SINH TIẾNG ANH VÀO 10 SỞ GD – ĐT THÀNH PHỐ HỒ CHÍ MINH NĂ...80 ĐỀ THI THỬ TUYỂN SINH TIẾNG ANH VÀO 10 SỞ GD – ĐT THÀNH PHỐ HỒ CHÍ MINH NĂ...
80 ĐỀ THI THỬ TUYỂN SINH TIẾNG ANH VÀO 10 SỞ GD – ĐT THÀNH PHỐ HỒ CHÍ MINH NĂ...Nguyen Thanh Tu Collection
 
Exploring_the_Narrative_Style_of_Amitav_Ghoshs_Gun_Island.pptx
Exploring_the_Narrative_Style_of_Amitav_Ghoshs_Gun_Island.pptxExploring_the_Narrative_Style_of_Amitav_Ghoshs_Gun_Island.pptx
Exploring_the_Narrative_Style_of_Amitav_Ghoshs_Gun_Island.pptxPooja Bhuva
 
The basics of sentences session 3pptx.pptx
The basics of sentences session 3pptx.pptxThe basics of sentences session 3pptx.pptx
The basics of sentences session 3pptx.pptxheathfieldcps1
 

Recently uploaded (20)

Google Gemini An AI Revolution in Education.pptx
Google Gemini An AI Revolution in Education.pptxGoogle Gemini An AI Revolution in Education.pptx
Google Gemini An AI Revolution in Education.pptx
 
How to Create and Manage Wizard in Odoo 17
How to Create and Manage Wizard in Odoo 17How to Create and Manage Wizard in Odoo 17
How to Create and Manage Wizard in Odoo 17
 
Food safety_Challenges food safety laboratories_.pdf
Food safety_Challenges food safety laboratories_.pdfFood safety_Challenges food safety laboratories_.pdf
Food safety_Challenges food safety laboratories_.pdf
 
Accessible Digital Futures project (20/03/2024)
Accessible Digital Futures project (20/03/2024)Accessible Digital Futures project (20/03/2024)
Accessible Digital Futures project (20/03/2024)
 
This PowerPoint helps students to consider the concept of infinity.
This PowerPoint helps students to consider the concept of infinity.This PowerPoint helps students to consider the concept of infinity.
This PowerPoint helps students to consider the concept of infinity.
 
Jamworks pilot and AI at Jisc (20/03/2024)
Jamworks pilot and AI at Jisc (20/03/2024)Jamworks pilot and AI at Jisc (20/03/2024)
Jamworks pilot and AI at Jisc (20/03/2024)
 
General Principles of Intellectual Property: Concepts of Intellectual Proper...
General Principles of Intellectual Property: Concepts of Intellectual  Proper...General Principles of Intellectual Property: Concepts of Intellectual  Proper...
General Principles of Intellectual Property: Concepts of Intellectual Proper...
 
How to Add New Custom Addons Path in Odoo 17
How to Add New Custom Addons Path in Odoo 17How to Add New Custom Addons Path in Odoo 17
How to Add New Custom Addons Path in Odoo 17
 
HMCS Vancouver Pre-Deployment Brief - May 2024 (Web Version).pptx
HMCS Vancouver Pre-Deployment Brief - May 2024 (Web Version).pptxHMCS Vancouver Pre-Deployment Brief - May 2024 (Web Version).pptx
HMCS Vancouver Pre-Deployment Brief - May 2024 (Web Version).pptx
 
Sociology 101 Demonstration of Learning Exhibit
Sociology 101 Demonstration of Learning ExhibitSociology 101 Demonstration of Learning Exhibit
Sociology 101 Demonstration of Learning Exhibit
 
Jual Obat Aborsi Hongkong ( Asli No.1 ) 085657271886 Obat Penggugur Kandungan...
Jual Obat Aborsi Hongkong ( Asli No.1 ) 085657271886 Obat Penggugur Kandungan...Jual Obat Aborsi Hongkong ( Asli No.1 ) 085657271886 Obat Penggugur Kandungan...
Jual Obat Aborsi Hongkong ( Asli No.1 ) 085657271886 Obat Penggugur Kandungan...
 
ICT role in 21st century education and it's challenges.
ICT role in 21st century education and it's challenges.ICT role in 21st century education and it's challenges.
ICT role in 21st century education and it's challenges.
 
ICT Role in 21st Century Education & its Challenges.pptx
ICT Role in 21st Century Education & its Challenges.pptxICT Role in 21st Century Education & its Challenges.pptx
ICT Role in 21st Century Education & its Challenges.pptx
 
Holdier Curriculum Vitae (April 2024).pdf
Holdier Curriculum Vitae (April 2024).pdfHoldier Curriculum Vitae (April 2024).pdf
Holdier Curriculum Vitae (April 2024).pdf
 
Towards a code of practice for AI in AT.pptx
Towards a code of practice for AI in AT.pptxTowards a code of practice for AI in AT.pptx
Towards a code of practice for AI in AT.pptx
 
REMIFENTANIL: An Ultra short acting opioid.pptx
REMIFENTANIL: An Ultra short acting opioid.pptxREMIFENTANIL: An Ultra short acting opioid.pptx
REMIFENTANIL: An Ultra short acting opioid.pptx
 
On National Teacher Day, meet the 2024-25 Kenan Fellows
On National Teacher Day, meet the 2024-25 Kenan FellowsOn National Teacher Day, meet the 2024-25 Kenan Fellows
On National Teacher Day, meet the 2024-25 Kenan Fellows
 
80 ĐỀ THI THỬ TUYỂN SINH TIẾNG ANH VÀO 10 SỞ GD – ĐT THÀNH PHỐ HỒ CHÍ MINH NĂ...
80 ĐỀ THI THỬ TUYỂN SINH TIẾNG ANH VÀO 10 SỞ GD – ĐT THÀNH PHỐ HỒ CHÍ MINH NĂ...80 ĐỀ THI THỬ TUYỂN SINH TIẾNG ANH VÀO 10 SỞ GD – ĐT THÀNH PHỐ HỒ CHÍ MINH NĂ...
80 ĐỀ THI THỬ TUYỂN SINH TIẾNG ANH VÀO 10 SỞ GD – ĐT THÀNH PHỐ HỒ CHÍ MINH NĂ...
 
Exploring_the_Narrative_Style_of_Amitav_Ghoshs_Gun_Island.pptx
Exploring_the_Narrative_Style_of_Amitav_Ghoshs_Gun_Island.pptxExploring_the_Narrative_Style_of_Amitav_Ghoshs_Gun_Island.pptx
Exploring_the_Narrative_Style_of_Amitav_Ghoshs_Gun_Island.pptx
 
The basics of sentences session 3pptx.pptx
The basics of sentences session 3pptx.pptxThe basics of sentences session 3pptx.pptx
The basics of sentences session 3pptx.pptx
 

Module 3 example 15

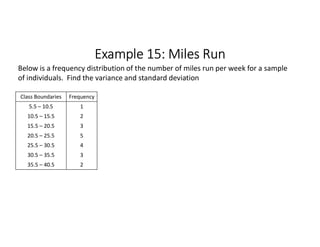
  • 1. Example 15: Miles Run Class Boundaries Frequency 5.5 – 10.5 1 10.5 – 15.5 2 15.5 – 20.5 3 20.5 – 25.5 5 25.5 – 30.5 4 30.5 – 35.5 3 35.5 – 40.5 2 Below is a frequency distribution of the number of miles run per week for a sample of individuals. Find the variance and standard deviation
  • 2. Example 15: Miles Run Class Boundaries Frequency 5.5 – 10.5 1 10.5 – 15.5 2 15.5 – 20.5 3 20.5 – 25.5 5 25.5 – 30.5 4 30.5 – 35.5 3 35.5 – 40.5 2 Below is a frequency distribution of the number of miles run per week for a sample of individuals. Find the variance and standard deviation : = ∑( · )    − ∑( · )    ( − 1) = =    
  • 3. Example 15: Miles Run Class Boundaries Frequency 5.5 – 10.5 1 10.5 – 15.5 2 15.5 – 20.5 3 20.5 – 25.5 5 25.5 – 30.5 4 30.5 – 35.5 3 35.5 – 40.5 2 = ∑    = 20 Below is a frequency distribution of the number of miles run per week for a sample of individuals. Find the variance and standard deviation : = ∑( · )    − ∑( · )    ( − 1) = =    
  • 4. Example 15: Miles Run Class Boundaries Frequency 5.5 – 10.5 1 10.5 – 15.5 2 15.5 – 20.5 3 20.5 – 25.5 5 25.5 – 30.5 4 30.5 – 35.5 3 35.5 – 40.5 2 = ∑    = 20 Below is a frequency distribution of the number of miles run per week for a sample of individuals. Find the variance and standard deviation : = ∑( · )    − ∑( · )    ( − 1) =
  • 5. Example 15: Miles Run Class Boundaries Frequency x, Midpoint 5.5 – 10.5 1 10.5 – 15.5 2 15.5 – 20.5 3 20.5 – 25.5 5 25.5 – 30.5 4 30.5 – 35.5 3 35.5 – 40.5 2 = ∑    = 20 Below is a frequency distribution of the number of miles run per week for a sample of individuals. Find the variance and standard deviation : = ∑( · )    − ∑( · )    ( − 1) =
  • 6. Example 15: Miles Run Class Boundaries Frequency x, Midpoint 5.5 – 10.5 1 (5.5+10.5)/2 = 8 10.5 – 15.5 2 15.5 – 20.5 3 20.5 – 25.5 5 25.5 – 30.5 4 30.5 – 35.5 3 35.5 – 40.5 2 = ∑    = 20 Below is a frequency distribution of the number of miles run per week for a sample of individuals. Find the variance and standard deviation : = ∑( · )    − ∑( · )    ( − 1) =
  • 7. Example 15: Miles Run Class Boundaries Frequency x, Midpoint 5.5 – 10.5 1 (5.5+10.5)/2 = 8 10.5 – 15.5 2 (10.5+15.5)/2 = 13 15.5 – 20.5 3 20.5 – 25.5 5 25.5 – 30.5 4 30.5 – 35.5 3 35.5 – 40.5 2 = ∑    = 20 Below is a frequency distribution of the number of miles run per week for a sample of individuals. Find the variance and standard deviation : = ∑( · )    − ∑( · )    ( − 1) =
  • 8. Example 15: Miles Run Class Boundaries Frequency x, Midpoint 5.5 – 10.5 1 (5.5+10.5)/2 = 8 10.5 – 15.5 2 (10.5+15.5)/2 = 13 15.5 – 20.5 3 (15.5+20.5)/2 = 18 20.5 – 25.5 5 25.5 – 30.5 4 30.5 – 35.5 3 35.5 – 40.5 2 = ∑    = 20 Below is a frequency distribution of the number of miles run per week for a sample of individuals. Find the variance and standard deviation : = ∑( · )    − ∑( · )    ( − 1) =
  • 9. Example 15: Miles Run Class Boundaries Frequency x, Midpoint 5.5 – 10.5 1 (5.5+10.5)/2 = 8 10.5 – 15.5 2 (10.5+15.5)/2 = 13 15.5 – 20.5 3 (15.5+20.5)/2 = 18 20.5 – 25.5 5 (20.5+25.5)/2 = 23 25.5 – 30.5 4 30.5 – 35.5 3 35.5 – 40.5 2 = ∑    = 20 Below is a frequency distribution of the number of miles run per week for a sample of individuals. Find the variance and standard deviation : = ∑( · )    − ∑( · )    ( − 1) =
  • 10. Example 15: Miles Run Class Boundaries Frequency x, Midpoint 5.5 – 10.5 1 (5.5+10.5)/2 = 8 10.5 – 15.5 2 (10.5+15.5)/2 = 13 15.5 – 20.5 3 (15.5+20.5)/2 = 18 20.5 – 25.5 5 (20.5+25.5)/2 = 23 25.5 – 30.5 4 (25.5+30.5)/2 = 28 30.5 – 35.5 3 35.5 – 40.5 2 = ∑    = 20 Below is a frequency distribution of the number of miles run per week for a sample of individuals. Find the variance and standard deviation : = ∑( · )    − ∑( · )    ( − 1) =
  • 11. Example 15: Miles Run Class Boundaries Frequency x, Midpoint 5.5 – 10.5 1 (5.5+10.5)/2 = 8 10.5 – 15.5 2 (10.5+15.5)/2 = 13 15.5 – 20.5 3 (15.5+20.5)/2 = 18 20.5 – 25.5 5 (20.5+25.5)/2 = 23 25.5 – 30.5 4 (25.5+30.5)/2 = 28 30.5 – 35.5 3 (30.5+35.5)/2 = 33 35.5 – 40.5 2 = ∑    = 20 Below is a frequency distribution of the number of miles run per week for a sample of individuals. Find the variance and standard deviation : = ∑( · )    − ∑( · )    ( − 1) =
  • 12. Example 15: Miles Run Class Boundaries Frequency x, Midpoint 5.5 – 10.5 1 (5.5+10.5)/2 = 8 10.5 – 15.5 2 (10.5+15.5)/2 = 13 15.5 – 20.5 3 (15.5+20.5)/2 = 18 20.5 – 25.5 5 (20.5+25.5)/2 = 23 25.5 – 30.5 4 (25.5+30.5)/2 = 28 30.5 – 35.5 3 (30.5+35.5)/2 = 33 35.5 – 40.5 2 (35.5+40.5)/2 = 38 = ∑    = 20 Below is a frequency distribution of the number of miles run per week for a sample of individuals. Find the variance and standard deviation : = ∑( · )    − ∑( · )    ( − 1) =
  • 13. Example 15: Miles Run Class Boundaries Frequency x, Midpoint 5.5 – 10.5 1 (5.5+10.5)/2 = 8 10.5 – 15.5 2 (10.5+15.5)/2 = 13 15.5 – 20.5 3 (15.5+20.5)/2 = 18 20.5 – 25.5 5 (20.5+25.5)/2 = 23 25.5 – 30.5 4 (25.5+30.5)/2 = 28 30.5 – 35.5 3 (30.5+35.5)/2 = 33 35.5 – 40.5 2 (35.5+40.5)/2 = 38 = ∑    = 20 Below is a frequency distribution of the number of miles run per week for a sample of individuals. Find the variance and standard deviation : = ∑( · )    − ∑( · )    ( − 1)
  • 14. Example 15: Miles Run Class Boundaries Frequency x, Midpoint f∙x 5.5 – 10.5 1 (5.5+10.5)/2 = 8 10.5 – 15.5 2 (10.5+15.5)/2 = 13 15.5 – 20.5 3 (15.5+20.5)/2 = 18 20.5 – 25.5 5 (20.5+25.5)/2 = 23 25.5 – 30.5 4 (25.5+30.5)/2 = 28 30.5 – 35.5 3 (30.5+35.5)/2 = 33 35.5 – 40.5 2 (35.5+40.5)/2 = 38 = ∑    = 20 Below is a frequency distribution of the number of miles run per week for a sample of individuals. Find the variance and standard deviation : = ∑( · )    − ∑( · )    ( − 1)
  • 15. Example 15: Miles Run Class Boundaries Frequency x, Midpoint f∙x 5.5 – 10.5 1 (5.5+10.5)/2 = 8 1∙8 = 8 10.5 – 15.5 2 (10.5+15.5)/2 = 13 15.5 – 20.5 3 (15.5+20.5)/2 = 18 20.5 – 25.5 5 (20.5+25.5)/2 = 23 25.5 – 30.5 4 (25.5+30.5)/2 = 28 30.5 – 35.5 3 (30.5+35.5)/2 = 33 35.5 – 40.5 2 (35.5+40.5)/2 = 38 = ∑    = 20 Below is a frequency distribution of the number of miles run per week for a sample of individuals. Find the variance and standard deviation : = ∑( · )    − ∑( · )    ( − 1)
  • 16. Example 15: Miles Run Class Boundaries Frequency x, Midpoint f∙x 5.5 – 10.5 1 (5.5+10.5)/2 = 8 1∙8 = 8 10.5 – 15.5 2 (10.5+15.5)/2 = 13 2∙13 = 26 15.5 – 20.5 3 (15.5+20.5)/2 = 18 20.5 – 25.5 5 (20.5+25.5)/2 = 23 25.5 – 30.5 4 (25.5+30.5)/2 = 28 30.5 – 35.5 3 (30.5+35.5)/2 = 33 35.5 – 40.5 2 (35.5+40.5)/2 = 38 = ∑    = 20 Below is a frequency distribution of the number of miles run per week for a sample of individuals. Find the variance and standard deviation : = ∑( · )    − ∑( · )    ( − 1)
  • 17. Example 15: Miles Run Class Boundaries Frequency x, Midpoint f∙x 5.5 – 10.5 1 (5.5+10.5)/2 = 8 1∙8 = 8 10.5 – 15.5 2 (10.5+15.5)/2 = 13 2∙13 = 26 15.5 – 20.5 3 (15.5+20.5)/2 = 18 3∙18 = 54 20.5 – 25.5 5 (20.5+25.5)/2 = 23 25.5 – 30.5 4 (25.5+30.5)/2 = 28 30.5 – 35.5 3 (30.5+35.5)/2 = 33 35.5 – 40.5 2 (35.5+40.5)/2 = 38 = ∑    = 20 Below is a frequency distribution of the number of miles run per week for a sample of individuals. Find the variance and standard deviation : = ∑( · )    − ∑( · )    ( − 1)
  • 18. Example 15: Miles Run Class Boundaries Frequency x, Midpoint f∙x 5.5 – 10.5 1 (5.5+10.5)/2 = 8 1∙8 = 8 10.5 – 15.5 2 (10.5+15.5)/2 = 13 2∙13 = 26 15.5 – 20.5 3 (15.5+20.5)/2 = 18 3∙18 = 54 20.5 – 25.5 5 (20.5+25.5)/2 = 23 5∙23 = 115 25.5 – 30.5 4 (25.5+30.5)/2 = 28 30.5 – 35.5 3 (30.5+35.5)/2 = 33 35.5 – 40.5 2 (35.5+40.5)/2 = 38 = ∑    = 20 Below is a frequency distribution of the number of miles run per week for a sample of individuals. Find the variance and standard deviation : = ∑( · )    − ∑( · )    ( − 1)
  • 19. Example 15: Miles Run Class Boundaries Frequency x, Midpoint f∙x 5.5 – 10.5 1 (5.5+10.5)/2 = 8 1∙8 = 8 10.5 – 15.5 2 (10.5+15.5)/2 = 13 2∙13 = 26 15.5 – 20.5 3 (15.5+20.5)/2 = 18 3∙18 = 54 20.5 – 25.5 5 (20.5+25.5)/2 = 23 5∙23 = 115 25.5 – 30.5 4 (25.5+30.5)/2 = 28 4∙28 = 112 30.5 – 35.5 3 (30.5+35.5)/2 = 33 35.5 – 40.5 2 (35.5+40.5)/2 = 38 = ∑    = 20 Below is a frequency distribution of the number of miles run per week for a sample of individuals. Find the variance and standard deviation : = ∑( · )    − ∑( · )    ( − 1)
  • 20. Example 15: Miles Run Class Boundaries Frequency x, Midpoint f∙x 5.5 – 10.5 1 (5.5+10.5)/2 = 8 1∙8 = 8 10.5 – 15.5 2 (10.5+15.5)/2 = 13 2∙13 = 26 15.5 – 20.5 3 (15.5+20.5)/2 = 18 3∙18 = 54 20.5 – 25.5 5 (20.5+25.5)/2 = 23 5∙23 = 115 25.5 – 30.5 4 (25.5+30.5)/2 = 28 4∙28 = 112 30.5 – 35.5 3 (30.5+35.5)/2 = 33 3∙33 = 99 35.5 – 40.5 2 (35.5+40.5)/2 = 38 2∙38 = 76 = ∑    = 20 Below is a frequency distribution of the number of miles run per week for a sample of individuals. Find the variance and standard deviation : = ∑( · )    − ∑( · )    ( − 1)
  • 21. Example 15: Miles Run Class Boundaries Frequency x, Midpoint f∙x 5.5 – 10.5 1 (5.5+10.5)/2 = 8 1∙8 = 8 10.5 – 15.5 2 (10.5+15.5)/2 = 13 2∙13 = 26 15.5 – 20.5 3 (15.5+20.5)/2 = 18 3∙18 = 54 20.5 – 25.5 5 (20.5+25.5)/2 = 23 5∙23 = 115 25.5 – 30.5 4 (25.5+30.5)/2 = 28 4∙28 = 112 30.5 – 35.5 3 (30.5+35.5)/2 = 33 3∙33 = 99 35.5 – 40.5 2 (35.5+40.5)/2 = 38 2∙38 = 76 = ∑    = 20 Below is a frequency distribution of the number of miles run per week for a sample of individuals. Find the variance and standard deviation : = ∑( · )    − ∑( · )    ( − 1) ( · )
  • 22. Example 15: Miles Run Class Boundaries Frequency x, Midpoint f∙x 5.5 – 10.5 1 (5.5+10.5)/2 = 8 1∙8 = 8 10.5 – 15.5 2 (10.5+15.5)/2 = 13 2∙13 = 26 15.5 – 20.5 3 (15.5+20.5)/2 = 18 3∙18 = 54 20.5 – 25.5 5 (20.5+25.5)/2 = 23 5∙23 = 115 25.5 – 30.5 4 (25.5+30.5)/2 = 28 4∙28 = 112 30.5 – 35.5 3 (30.5+35.5)/2 = 33 3∙33 = 99 35.5 – 40.5 2 (35.5+40.5)/2 = 38 2∙38 = 76 = ∑    = 20 ∑( · )    = 490 Below is a frequency distribution of the number of miles run per week for a sample of individuals. Find the variance and standard deviation : = ∑( · )    − ∑( · )    ( − 1) ( · )
  • 23. Example 15: Miles Run Class Boundaries Frequency x, Midpoint f∙x 5.5 – 10.5 1 (5.5+10.5)/2 = 8 1∙8 = 8 10.5 – 15.5 2 (10.5+15.5)/2 = 13 2∙13 = 26 15.5 – 20.5 3 (15.5+20.5)/2 = 18 3∙18 = 54 20.5 – 25.5 5 (20.5+25.5)/2 = 23 5∙23 = 115 25.5 – 30.5 4 (25.5+30.5)/2 = 28 4∙28 = 112 30.5 – 35.5 3 (30.5+35.5)/2 = 33 3∙33 = 99 35.5 – 40.5 2 (35.5+40.5)/2 = 38 2∙38 = 76 = ∑    = 20 ∑( · )    = 490 Below is a frequency distribution of the number of miles run per week for a sample of individuals. Find the variance and standard deviation : = ∑( · )    − ∑( · )    ( − 1) ,
  • 24. Example 15: Miles Run Class Boundaries Frequency x, Midpoint f∙x x2 5.5 – 10.5 1 (5.5+10.5)/2 = 8 1∙8 = 8 10.5 – 15.5 2 (10.5+15.5)/2 = 13 2∙13 = 26 15.5 – 20.5 3 (15.5+20.5)/2 = 18 3∙18 = 54 20.5 – 25.5 5 (20.5+25.5)/2 = 23 5∙23 = 115 25.5 – 30.5 4 (25.5+30.5)/2 = 28 4∙28 = 112 30.5 – 35.5 3 (30.5+35.5)/2 = 33 3∙33 = 99 35.5 – 40.5 2 (35.5+40.5)/2 = 38 2∙38 = 76 = ∑    = 20 ∑( · )    = 490 Below is a frequency distribution of the number of miles run per week for a sample of individuals. Find the variance and standard deviation : = ∑( · )    − ∑( · )    ( − 1) ,
  • 25. Example 15: Miles Run Class Boundaries Frequency x, Midpoint f∙x x2 5.5 – 10.5 1 (5.5+10.5)/2 = 8 1∙8 = 8 82 = 64 10.5 – 15.5 2 (10.5+15.5)/2 = 13 2∙13 = 26 15.5 – 20.5 3 (15.5+20.5)/2 = 18 3∙18 = 54 20.5 – 25.5 5 (20.5+25.5)/2 = 23 5∙23 = 115 25.5 – 30.5 4 (25.5+30.5)/2 = 28 4∙28 = 112 30.5 – 35.5 3 (30.5+35.5)/2 = 33 3∙33 = 99 35.5 – 40.5 2 (35.5+40.5)/2 = 38 2∙38 = 76 = ∑    = 20 ∑( · )    = 490 Below is a frequency distribution of the number of miles run per week for a sample of individuals. Find the variance and standard deviation : = ∑( · )    − ∑( · )    ( − 1) ,
  • 26. Example 15: Miles Run Class Boundaries Frequency x, Midpoint f∙x x2 5.5 – 10.5 1 (5.5+10.5)/2 = 8 1∙8 = 8 82 = 64 10.5 – 15.5 2 (10.5+15.5)/2 = 13 2∙13 = 26 132 = 169 15.5 – 20.5 3 (15.5+20.5)/2 = 18 3∙18 = 54 20.5 – 25.5 5 (20.5+25.5)/2 = 23 5∙23 = 115 25.5 – 30.5 4 (25.5+30.5)/2 = 28 4∙28 = 112 30.5 – 35.5 3 (30.5+35.5)/2 = 33 3∙33 = 99 35.5 – 40.5 2 (35.5+40.5)/2 = 38 2∙38 = 76 = ∑    = 20 ∑( · )    = 490 Below is a frequency distribution of the number of miles run per week for a sample of individuals. Find the variance and standard deviation : = ∑( · )    − ∑( · )    ( − 1) ,
  • 27. Example 15: Miles Run Class Boundaries Frequency x, Midpoint f∙x x2 5.5 – 10.5 1 (5.5+10.5)/2 = 8 1∙8 = 8 82 = 64 10.5 – 15.5 2 (10.5+15.5)/2 = 13 2∙13 = 26 132 = 169 15.5 – 20.5 3 (15.5+20.5)/2 = 18 3∙18 = 54 182 = 324 20.5 – 25.5 5 (20.5+25.5)/2 = 23 5∙23 = 115 25.5 – 30.5 4 (25.5+30.5)/2 = 28 4∙28 = 112 30.5 – 35.5 3 (30.5+35.5)/2 = 33 3∙33 = 99 35.5 – 40.5 2 (35.5+40.5)/2 = 38 2∙38 = 76 = ∑    = 20 ∑( · )    = 490 Below is a frequency distribution of the number of miles run per week for a sample of individuals. Find the variance and standard deviation : = ∑( · )    − ∑( · )    ( − 1) ,
  • 28. Example 15: Miles Run Class Boundaries Frequency x, Midpoint f∙x x2 5.5 – 10.5 1 (5.5+10.5)/2 = 8 1∙8 = 8 82 = 64 10.5 – 15.5 2 (10.5+15.5)/2 = 13 2∙13 = 26 132 = 169 15.5 – 20.5 3 (15.5+20.5)/2 = 18 3∙18 = 54 182 = 324 20.5 – 25.5 5 (20.5+25.5)/2 = 23 5∙23 = 115 232 = 529 25.5 – 30.5 4 (25.5+30.5)/2 = 28 4∙28 = 112 282 = 784 30.5 – 35.5 3 (30.5+35.5)/2 = 33 3∙33 = 99 35.5 – 40.5 2 (35.5+40.5)/2 = 38 2∙38 = 76 = ∑    = 20 ∑( · )    = 490 Below is a frequency distribution of the number of miles run per week for a sample of individuals. Find the variance and standard deviation : = ∑( · )    − ∑( · )    ( − 1) ,
  • 29. Example 15: Miles Run Class Boundaries Frequency x, Midpoint f∙x x2 5.5 – 10.5 1 (5.5+10.5)/2 = 8 1∙8 = 8 82 = 64 10.5 – 15.5 2 (10.5+15.5)/2 = 13 2∙13 = 26 132 = 169 15.5 – 20.5 3 (15.5+20.5)/2 = 18 3∙18 = 54 182 = 324 20.5 – 25.5 5 (20.5+25.5)/2 = 23 5∙23 = 115 232 = 529 25.5 – 30.5 4 (25.5+30.5)/2 = 28 4∙28 = 112 282 = 784 30.5 – 35.5 3 (30.5+35.5)/2 = 33 3∙33 = 99 332 = 1089 35.5 – 40.5 2 (35.5+40.5)/2 = 38 2∙38 = 76 = ∑    = 20 ∑( · )    = 490 Below is a frequency distribution of the number of miles run per week for a sample of individuals. Find the variance and standard deviation : = ∑( · )    − ∑( · )    ( − 1) ,
  • 30. Example 15: Miles Run Class Boundaries Frequency x, Midpoint f∙x x2 5.5 – 10.5 1 (5.5+10.5)/2 = 8 1∙8 = 8 82 = 64 10.5 – 15.5 2 (10.5+15.5)/2 = 13 2∙13 = 26 132 = 169 15.5 – 20.5 3 (15.5+20.5)/2 = 18 3∙18 = 54 182 = 324 20.5 – 25.5 5 (20.5+25.5)/2 = 23 5∙23 = 115 232 = 529 25.5 – 30.5 4 (25.5+30.5)/2 = 28 4∙28 = 112 282 = 784 30.5 – 35.5 3 (30.5+35.5)/2 = 33 3∙33 = 99 332 = 1089 35.5 – 40.5 2 (35.5+40.5)/2 = 38 2∙38 = 76 382 = 1444 = ∑    = 20 ∑( · )    = 490 Below is a frequency distribution of the number of miles run per week for a sample of individuals. Find the variance and standard deviation : = ∑( · )    − ∑( · )    ( − 1) ,
  • 31. Example 15: Miles Run Class Boundaries Frequency x, Midpoint f∙x x2 5.5 – 10.5 1 (5.5+10.5)/2 = 8 1∙8 = 8 82 = 64 10.5 – 15.5 2 (10.5+15.5)/2 = 13 2∙13 = 26 132 = 169 15.5 – 20.5 3 (15.5+20.5)/2 = 18 3∙18 = 54 182 = 324 20.5 – 25.5 5 (20.5+25.5)/2 = 23 5∙23 = 115 232 = 529 25.5 – 30.5 4 (25.5+30.5)/2 = 28 4∙28 = 112 282 = 784 30.5 – 35.5 3 (30.5+35.5)/2 = 33 3∙33 = 99 332 = 1089 35.5 – 40.5 2 (35.5+40.5)/2 = 38 2∙38 = 76 382 = 1444 = ∑    = 20 ∑( · )    = 490 Below is a frequency distribution of the number of miles run per week for a sample of individuals. Find the variance and standard deviation : = ∑( · )    − ∑( · )    ( − 1) , ( · )
  • 32. Example 15: Miles Run Class Boundaries Frequency x, Midpoint f∙x x2 f∙x2 5.5 – 10.5 1 (5.5+10.5)/2 = 8 1∙8 = 8 82 = 64 10.5 – 15.5 2 (10.5+15.5)/2 = 13 2∙13 = 26 132 = 169 15.5 – 20.5 3 (15.5+20.5)/2 = 18 3∙18 = 54 182 = 324 20.5 – 25.5 5 (20.5+25.5)/2 = 23 5∙23 = 115 232 = 529 25.5 – 30.5 4 (25.5+30.5)/2 = 28 4∙28 = 112 282 = 784 30.5 – 35.5 3 (30.5+35.5)/2 = 33 3∙33 = 99 332 = 1089 35.5 – 40.5 2 (35.5+40.5)/2 = 38 2∙38 = 76 382 = 1444 = ∑    = 20 ∑( · )    = 490 Below is a frequency distribution of the number of miles run per week for a sample of individuals. Find the variance and standard deviation : = ∑( · )    − ∑( · )    ( − 1) , ( · )
  • 33. Example 15: Miles Run Class Boundaries Frequency x, Midpoint f∙x x2 f∙x2 5.5 – 10.5 1 (5.5+10.5)/2 = 8 1∙8 = 8 82 = 64 1∙64 = 64 10.5 – 15.5 2 (10.5+15.5)/2 = 13 2∙13 = 26 132 = 169 15.5 – 20.5 3 (15.5+20.5)/2 = 18 3∙18 = 54 182 = 324 20.5 – 25.5 5 (20.5+25.5)/2 = 23 5∙23 = 115 232 = 529 25.5 – 30.5 4 (25.5+30.5)/2 = 28 4∙28 = 112 282 = 784 30.5 – 35.5 3 (30.5+35.5)/2 = 33 3∙33 = 99 332 = 1089 35.5 – 40.5 2 (35.5+40.5)/2 = 38 2∙38 = 76 382 = 1444 = ∑    = 20 ∑( · )    = 490 Below is a frequency distribution of the number of miles run per week for a sample of individuals. Find the variance and standard deviation : = ∑( · )    − ∑( · )    ( − 1) , ( · )
  • 34. Example 15: Miles Run Class Boundaries Frequency x, Midpoint f∙x x2 f∙x2 5.5 – 10.5 1 (5.5+10.5)/2 = 8 1∙8 = 8 82 = 64 1∙64 = 64 10.5 – 15.5 2 (10.5+15.5)/2 = 13 2∙13 = 26 132 = 169 2∙169 = 338 15.5 – 20.5 3 (15.5+20.5)/2 = 18 3∙18 = 54 182 = 324 20.5 – 25.5 5 (20.5+25.5)/2 = 23 5∙23 = 115 232 = 529 25.5 – 30.5 4 (25.5+30.5)/2 = 28 4∙28 = 112 282 = 784 30.5 – 35.5 3 (30.5+35.5)/2 = 33 3∙33 = 99 332 = 1089 35.5 – 40.5 2 (35.5+40.5)/2 = 38 2∙38 = 76 382 = 1444 = ∑    = 20 ∑( · )    = 490 Below is a frequency distribution of the number of miles run per week for a sample of individuals. Find the variance and standard deviation : = ∑( · )    − ∑( · )    ( − 1) , ( · )
  • 35. Example 15: Miles Run Class Boundaries Frequency x, Midpoint f∙x x2 f∙x2 5.5 – 10.5 1 (5.5+10.5)/2 = 8 1∙8 = 8 82 = 64 1∙64 = 64 10.5 – 15.5 2 (10.5+15.5)/2 = 13 2∙13 = 26 132 = 169 2∙169 = 338 15.5 – 20.5 3 (15.5+20.5)/2 = 18 3∙18 = 54 182 = 324 3∙324 = 972 20.5 – 25.5 5 (20.5+25.5)/2 = 23 5∙23 = 115 232 = 529 25.5 – 30.5 4 (25.5+30.5)/2 = 28 4∙28 = 112 282 = 784 30.5 – 35.5 3 (30.5+35.5)/2 = 33 3∙33 = 99 332 = 1089 35.5 – 40.5 2 (35.5+40.5)/2 = 38 2∙38 = 76 382 = 1444 = ∑    = 20 ∑( · )    = 490 Below is a frequency distribution of the number of miles run per week for a sample of individuals. Find the variance and standard deviation : = ∑( · )    − ∑( · )    ( − 1) , ( · )
  • 36. Example 15: Miles Run Class Boundaries Frequency x, Midpoint f∙x x2 f∙x2 5.5 – 10.5 1 (5.5+10.5)/2 = 8 1∙8 = 8 82 = 64 1∙64 = 64 10.5 – 15.5 2 (10.5+15.5)/2 = 13 2∙13 = 26 132 = 169 2∙169 = 338 15.5 – 20.5 3 (15.5+20.5)/2 = 18 3∙18 = 54 182 = 324 3∙324 = 972 20.5 – 25.5 5 (20.5+25.5)/2 = 23 5∙23 = 115 232 = 529 5∙529 = 2645 25.5 – 30.5 4 (25.5+30.5)/2 = 28 4∙28 = 112 282 = 784 30.5 – 35.5 3 (30.5+35.5)/2 = 33 3∙33 = 99 332 = 1089 35.5 – 40.5 2 (35.5+40.5)/2 = 38 2∙38 = 76 382 = 1444 = ∑    = 20 ∑( · )    = 490 Below is a frequency distribution of the number of miles run per week for a sample of individuals. Find the variance and standard deviation : = ∑( · )    − ∑( · )    ( − 1) , ( · )
  • 37. Example 15: Miles Run Class Boundaries Frequency x, Midpoint f∙x x2 f∙x2 5.5 – 10.5 1 (5.5+10.5)/2 = 8 1∙8 = 8 82 = 64 1∙64 = 64 10.5 – 15.5 2 (10.5+15.5)/2 = 13 2∙13 = 26 132 = 169 2∙169 = 338 15.5 – 20.5 3 (15.5+20.5)/2 = 18 3∙18 = 54 182 = 324 3∙324 = 972 20.5 – 25.5 5 (20.5+25.5)/2 = 23 5∙23 = 115 232 = 529 5∙529 = 2645 25.5 – 30.5 4 (25.5+30.5)/2 = 28 4∙28 = 112 282 = 784 4∙784 = 3136 30.5 – 35.5 3 (30.5+35.5)/2 = 33 3∙33 = 99 332 = 1089 35.5 – 40.5 2 (35.5+40.5)/2 = 38 2∙38 = 76 382 = 1444 = ∑    = 20 ∑( · )    = 490 Below is a frequency distribution of the number of miles run per week for a sample of individuals. Find the variance and standard deviation : = ∑( · )    − ∑( · )    ( − 1) , ( · )
  • 38. Example 15: Miles Run Class Boundaries Frequency x, Midpoint f∙x x2 f∙x2 5.5 – 10.5 1 (5.5+10.5)/2 = 8 1∙8 = 8 82 = 64 1∙64 = 64 10.5 – 15.5 2 (10.5+15.5)/2 = 13 2∙13 = 26 132 = 169 2∙169 = 338 15.5 – 20.5 3 (15.5+20.5)/2 = 18 3∙18 = 54 182 = 324 3∙324 = 972 20.5 – 25.5 5 (20.5+25.5)/2 = 23 5∙23 = 115 232 = 529 5∙529 = 2645 25.5 – 30.5 4 (25.5+30.5)/2 = 28 4∙28 = 112 282 = 784 4∙784 = 3136 30.5 – 35.5 3 (30.5+35.5)/2 = 33 3∙33 = 99 332 = 1089 3∙1089 = 3267 35.5 – 40.5 2 (35.5+40.5)/2 = 38 2∙38 = 76 382 = 1444 = ∑    = 20 ∑( · )    = 490 Below is a frequency distribution of the number of miles run per week for a sample of individuals. Find the variance and standard deviation : = ∑( · )    − ∑( · )    ( − 1) , ( · )
  • 39. Example 15: Miles Run Class Boundaries Frequency x, Midpoint f∙x x2 f∙x2 5.5 – 10.5 1 (5.5+10.5)/2 = 8 1∙8 = 8 82 = 64 1∙64 = 64 10.5 – 15.5 2 (10.5+15.5)/2 = 13 2∙13 = 26 132 = 169 2∙169 = 338 15.5 – 20.5 3 (15.5+20.5)/2 = 18 3∙18 = 54 182 = 324 3∙324 = 972 20.5 – 25.5 5 (20.5+25.5)/2 = 23 5∙23 = 115 232 = 529 5∙529 = 2645 25.5 – 30.5 4 (25.5+30.5)/2 = 28 4∙28 = 112 282 = 784 4∙784 = 3136 30.5 – 35.5 3 (30.5+35.5)/2 = 33 3∙33 = 99 332 = 1089 3∙1089 = 3267 35.5 – 40.5 2 (35.5+40.5)/2 = 38 2∙38 = 76 382 = 1444 2∙1444 = 2888 = ∑    = 20 ∑( · )    = 490 Below is a frequency distribution of the number of miles run per week for a sample of individuals. Find the variance and standard deviation : = ∑( · )    − ∑( · )    ( − 1) , ( · )
  • 40. Example 15: Miles Run Class Boundaries Frequency x, Midpoint f∙x x2 f∙x2 5.5 – 10.5 1 (5.5+10.5)/2 = 8 1∙8 = 8 82 = 64 1∙64 = 64 10.5 – 15.5 2 (10.5+15.5)/2 = 13 2∙13 = 26 132 = 169 2∙169 = 338 15.5 – 20.5 3 (15.5+20.5)/2 = 18 3∙18 = 54 182 = 324 3∙324 = 972 20.5 – 25.5 5 (20.5+25.5)/2 = 23 5∙23 = 115 232 = 529 5∙529 = 2645 25.5 – 30.5 4 (25.5+30.5)/2 = 28 4∙28 = 112 282 = 784 4∙784 = 3136 30.5 – 35.5 3 (30.5+35.5)/2 = 33 3∙33 = 99 332 = 1089 3∙1089 = 3267 35.5 – 40.5 2 (35.5+40.5)/2 = 38 2∙38 = 76 382 = 1444 2∙1444 = 2888 = ∑    = 20 ∑( · )    = 490 Below is a frequency distribution of the number of miles run per week for a sample of individuals. Find the variance and standard deviation : = ∑( · )    − ∑( · )    ( − 1) ( · )
  • 41. Example 15: Miles Run Class Boundaries Frequency x, Midpoint f∙x x2 f∙x2 5.5 – 10.5 1 (5.5+10.5)/2 = 8 1∙8 = 8 82 = 64 1∙64 = 64 10.5 – 15.5 2 (10.5+15.5)/2 = 13 2∙13 = 26 132 = 169 2∙169 = 338 15.5 – 20.5 3 (15.5+20.5)/2 = 18 3∙18 = 54 182 = 324 3∙324 = 972 20.5 – 25.5 5 (20.5+25.5)/2 = 23 5∙23 = 115 232 = 529 5∙529 = 2645 25.5 – 30.5 4 (25.5+30.5)/2 = 28 4∙28 = 112 282 = 784 4∙784 = 3136 30.5 – 35.5 3 (30.5+35.5)/2 = 33 3∙33 = 99 332 = 1089 3∙1089 = 3267 35.5 – 40.5 2 (35.5+40.5)/2 = 38 2∙38 = 76 382 = 1444 2∙1444 = 2888 = ∑    = 20 ∑( · )    = 490 ∑( · 2)    = 13310 Below is a frequency distribution of the number of miles run per week for a sample of individuals. Find the variance and standard deviation : = ∑( · )    − ∑( · )    ( − 1) ( · )
  • 42. Example 15: Miles Run Class Boundaries Frequency x, Midpoint f∙x x2 f∙x2 5.5 – 10.5 1 (5.5+10.5)/2 = 8 1∙8 = 8 82 = 64 1∙64 = 64 10.5 – 15.5 2 (10.5+15.5)/2 = 13 2∙13 = 26 132 = 169 2∙169 = 338 15.5 – 20.5 3 (15.5+20.5)/2 = 18 3∙18 = 54 182 = 324 3∙324 = 972 20.5 – 25.5 5 (20.5+25.5)/2 = 23 5∙23 = 115 232 = 529 5∙529 = 2645 25.5 – 30.5 4 (25.5+30.5)/2 = 28 4∙28 = 112 282 = 784 4∙784 = 3136 30.5 – 35.5 3 (30.5+35.5)/2 = 33 3∙33 = 99 332 = 1089 3∙1089 = 3267 35.5 – 40.5 2 (35.5+40.5)/2 = 38 2∙38 = 76 382 = 1444 2∙1444 = 2888 = ∑    = 20 ∑( · )    = 490 ∑( · 2)    = 13310 Below is a frequency distribution of the number of miles run per week for a sample of individuals. Find the variance and standard deviation : = ∑( · )    − ∑( · )    ( − 1) = 20 13310 − (490) 20(19) = 266200 − 240100 380 = 26100 380 ≈ 68.7
  • 43. Example 15: Miles Run Class Boundaries Frequency x, Midpoint f∙x x2 f∙x2 5.5 – 10.5 1 (5.5+10.5)/2 = 8 1∙8 = 8 82 = 64 1∙64 = 64 10.5 – 15.5 2 (10.5+15.5)/2 = 13 2∙13 = 26 132 = 169 2∙169 = 338 15.5 – 20.5 3 (15.5+20.5)/2 = 18 3∙18 = 54 182 = 324 3∙324 = 972 20.5 – 25.5 5 (20.5+25.5)/2 = 23 5∙23 = 115 232 = 529 5∙529 = 2645 25.5 – 30.5 4 (25.5+30.5)/2 = 28 4∙28 = 112 282 = 784 4∙784 = 3136 30.5 – 35.5 3 (30.5+35.5)/2 = 33 3∙33 = 99 332 = 1089 3∙1089 = 3267 35.5 – 40.5 2 (35.5+40.5)/2 = 38 2∙38 = 76 382 = 1444 2∙1444 = 2888 = ∑    = 20 ∑( · )    = 490 ∑( · 2)    = 13310 Below is a frequency distribution of the number of miles run per week for a sample of individuals. Find the variance and standard deviation : = 26100 380 ≈ 68.7
  • 44. Example 15: Miles Run Class Boundaries Frequency x, Midpoint f∙x x2 f∙x2 5.5 – 10.5 1 (5.5+10.5)/2 = 8 1∙8 = 8 82 = 64 1∙64 = 64 10.5 – 15.5 2 (10.5+15.5)/2 = 13 2∙13 = 26 132 = 169 2∙169 = 338 15.5 – 20.5 3 (15.5+20.5)/2 = 18 3∙18 = 54 182 = 324 3∙324 = 972 20.5 – 25.5 5 (20.5+25.5)/2 = 23 5∙23 = 115 232 = 529 5∙529 = 2645 25.5 – 30.5 4 (25.5+30.5)/2 = 28 4∙28 = 112 282 = 784 4∙784 = 3136 30.5 – 35.5 3 (30.5+35.5)/2 = 33 3∙33 = 99 332 = 1089 3∙1089 = 3267 35.5 – 40.5 2 (35.5+40.5)/2 = 38 2∙38 = 76 382 = 1444 2∙1444 = 2888 = ∑    = 20 ∑( · )    = 490 ∑( · 2)    = 13310 Below is a frequency distribution of the number of miles run per week for a sample of individuals. Find the variance and standard deviation : = 26100 380 ≈ 68.7 : =   = 26100 380   ≈ 8.3