Market Watch JULY 2013
•
0 j'aime•371 vues

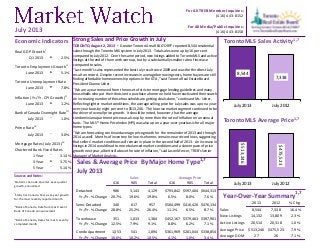
Total sales were up by 16 per cent compared to July 2012. Over the same period, new listings added to TorontoMLS and active listings at the end of the month were up, but by a substantially smaller rate of increase compared to sales. “Last month’s sales represented the best July result since 2009 and was the third best July result on record. Despite recent increases in average borrowing costs, home buyers are still finding affordable home ownership options in the GTA,”

Recommandé
Contenu connexe
Plus de Chaba Tamasi
Plus de Chaba Tamasi (18)
Dernier
Dernier (20)
Market Watch JULY 2013
- 1. Strong Sales and Price Growth in July TORONTO, August 2, 2013 – Greater Toronto Area REALTORS® reported 8,544 residential sales through the TorontoMLS system in July 2013. Total sales were up by 16 per cent compared to July 2012. Over the same period, new listings added to TorontoMLS and active listings at the end of the month were up, but by a substantially smaller rate of increase compared to sales. “Last month’s sales represented the best July result since 2009 and was the third best July result on record. Despite recent increases in average borrowing costs, home buyers are still finding affordable home ownership options in the GTA,” said Toronto Real Estate Board President Dianne Usher. “We are a year removed from the onset of stricter mortgage lending guidelines and many households who put their decision to purchase a home on hold have reactivated their search. An increasing number of these households are getting deals done,” continued Ms. Usher. Reflecting tighter market conditions, the average selling price for July sales was up on a year- over-year basis by eight per cent to $513,246. The low-rise market segment continued to be the driver of overall price growth. It should be noted, however, that the average condominium apartment price was also up by more than the rate of inflation on an annual basis. The MLS® Home Price Index (HPI) was also up on a year-over-year basis for all major home types. “We are forecasting continued average price growth for the remainder of 2013 and through 2014 as well. Months of inventory for low-rise homes remains near record lows, suggesting that sellers’ market conditions will remain in place in the second half of 2013. An increase in listings in 2014 would lead to more balanced market conditions and a slower pace of price growth next year, albeit still above the rate of inflation,” said Jason Mercer, TREB’s Senior Manager of Market Analysis. 8,544 7,338 July 2013 July 2012 $513,246 $475,523 July 2013 July 2012 For All TREB Member Inquiries: (416) 443-8152 For All Media/Public Inquiries: (416) 443-8158July 2013 Real GDP Growthi Q1 2013 t 2.5% Toronto Employment Growthii June 2013 t 5.1% Toronto Unemployment Rate June 2013 u 7.8% Inflation (Yr./Yr. CPI Growth)ii June 2013 t 1.2% Bank of Canada Overnight Rateiii July 2013 q 1.0% Prime Rate iv July 2013 q 3.0% Mortgage Rates (July 2013) iv Chartered Bank Fixed Rates 1 Year q 3.14% 3 Year t 3.75% 5 Year q 5.14% Sources and Notes: Economic Indicators i Statistics Canada, Quarter-over-quarter growth, annualized ii Statistics Canada, Year-over-year growth for the most recently reported month iii Bank of Canada, Rate from most recent Bank of Canada announcement iv Bank of Canada, Rates for most recently completed month Sales & Average Price By Major Home Type1,7 416 905 Total 416 905 Total Detached 986 3,143 4,129 $793,842 $597,404 $644,313 Yr./Yr. % Change 20.7% 19.6% 19.8% 6.5% 8.0% 7.6% Semi-Detached 340 617 957 $584,499 $416,420 $476,134 Yr./Yr. % Change 28.8% 25.2% 26.4% 11.1% 6.5% 8.7% Townhouse 351 1,033 1,384 $452,167 $379,463 $397,901 Yr./Yr. % Change 12.5% 7.9% 9.1% 8.8% 6.2% 7.1% Condo Apartment 1,353 541 1,894 $361,969 $281,044 $338,854 Yr./Yr. % Change 10.6% 10.2% 10.5% 4.1% 1.0% 3.4% July 2013 Sales Average Price 2013 2012 % Chg. Sales 8,544 7,338 16.4% New Listings 14,132 13,809 2.3% Active Listings 20,514 20,318 1.0% Average Price $513,246 $475,523 7.9% Average DOM 27 26 7.1% Year-Over-Year Summary 1,7 TorontoMLS Sales Activity1,7 TorontoMLS Average Price1,7
- 2. Price Range Detached Semi-Detached Att/Row/Twnhouse Condo Townhouse Condo Apt Link Co-op Apt Det Condo Co-ownership Apt Total $0 to $99,999 2 0 1 3 12 0 4 0 1 23 $100,000 to $199,999 44 14 1 49 238 1 2 0 0 349 $200,000 to $299,999 221 48 87 218 637 28 0 0 3 1,242 $300,000 to $399,999 546 221 191 265 579 33 1 1 5 1,842 $400,000 to $499,999 819 366 206 103 257 34 2 1 0 1,788 $500,000 to $599,999 721 172 112 29 82 45 0 1 0 1,162 $600,000 to $699,999 607 67 45 16 37 12 1 0 0 785 $700,000 to $799,999 366 32 19 10 20 3 1 0 0 451 $800,000 to $899,999 265 17 4 4 11 0 0 1 0 302 $900,000 to $999,999 145 11 2 5 4 0 0 0 0 167 $1,000,000 to $1,249,999 150 4 6 2 7 0 0 0 0 169 $1,250,000 to $1,499,999 93 3 0 1 4 0 0 0 0 101 $1,500,000 to $1,749,999 58 1 1 2 2 0 0 0 0 64 $1,750,000 to $1,999,999 34 0 0 0 0 0 0 0 0 34 $2,000,000 + 58 1 1 1 4 0 0 0 0 65 Total Sales 4,129 957 676 708 1,894 156 11 4 9 8,544 Share of Total Sales 48.3% 11.2% 7.9% 8.3% 22.2% 1.8% 0.1% 0.0% 0.1% - Average Price $644,313 $476,134 $445,692 $352,271 $338,854 $439,875 $303,645 $547,750 $278,889 $513,246 Price Range Detached Semi-Detached Att/Row/Twnhouse Condo Townhouse Condo Apt Link Co-op Apt Det Condo Co-ownership Apt Total $0 to $99,999 16 0 4 18 98 0 12 0 3 151 $100,000 to $199,999 268 62 11 307 1,497 2 25 0 6 2,178 $200,000 to $299,999 1,566 372 552 1,248 3,939 167 11 8 24 7,887 $300,000 to $399,999 3,642 1,550 1,458 1,581 3,616 206 13 14 12 12,092 $400,000 to $499,999 5,046 2,139 1,315 604 1,502 208 9 11 2 10,836 $500,000 to $599,999 4,785 974 597 168 617 243 5 8 0 7,397 $600,000 to $699,999 3,496 404 285 95 275 79 3 2 0 4,639 $700,000 to $799,999 2,383 208 91 50 137 12 3 1 0 2,885 $800,000 to $899,999 1,665 139 40 31 69 0 0 1 0 1,945 $900,000 to $999,999 950 64 20 16 54 0 1 0 0 1,105 $1,000,000 to $1,249,999 1,123 63 20 11 51 0 0 0 0 1,268 $1,250,000 to $1,499,999 715 23 6 1 29 0 1 0 0 775 $1,500,000 to $1,749,999 411 17 2 3 12 0 0 0 0 445 $1,750,000 to $1,999,999 219 7 2 0 5 0 0 0 0 233 $2,000,000 + 459 13 2 2 25 0 0 0 0 501 Total Sales 26,744 6,035 4,405 4,135 11,926 917 83 45 47 54,337 Share of Total Sales 49.2% 11.1% 8.1% 7.6% 21.9% 1.7% 0.2% 0.1% 0.1% - Average Price $655,464 $481,675 $435,006 $345,972 $341,163 $438,747 $302,412 $426,369 $258,223 $521,025 SALES BY PRICE RANGE AND HOUSE TYPE1,7 JULY 2013 SALES BY PRICE RANGE AND HOUSE TYPE1,7 YEAR-TO-DATE, 2013 Market Watch, July 2013 2 Toronto Real Estate Board
- 3. ALL HOME TYPES, JULY 2013 ALL TREB AREAS Number of Sales Dollar Volume 1 Average Price 1 Median Price 1 New Listings 2 SNLR (Trend) 8 Active Listings 3 Mos. Inv. (Trend)9 Avg. SP/LP 4 Avg. DOM 5 TREB Total 8,544 $4,385,175,836 $513,246 $440,000 14,132 52.1% 20,514 2.8 98% 27 Halton Region 693 $395,046,949 $570,053 $486,000 995 57.1% 1,503 2.6 98% 28 Burlington 120 $65,750,650 $547,922 $466,000 165 61.1% 288 2.7 97% 27 Halton Hills 112 $54,849,353 $489,726 $464,950 126 58.2% 227 2.8 97% 30 Milton 222 $104,546,790 $470,931 $445,750 323 57.5% 350 2.0 98% 23 Oakville 239 $169,900,156 $710,879 $611,500 381 54.8% 638 3.0 97% 31 Peel Region 1,864 $858,262,794 $460,441 $421,000 3,334 49.6% 4,659 2.8 97% 28 Brampton 808 $343,885,451 $425,601 $403,500 1,487 48.2% 1,987 2.8 97% 28 Caledon 68 $37,835,499 $556,404 $496,000 140 46.5% 311 4.3 98% 31 Mississauga 988 $476,541,844 $482,330 $433,750 1,707 51.1% 2,361 2.7 97% 27 City of Toronto 3,062 $1,641,786,517 $536,181 $439,000 5,350 50.1% 7,849 2.9 98% 27 York Region 1,629 $1,017,765,843 $624,780 $570,000 2,652 50.2% 3,976 2.9 98% 27 Aurora 93 $53,896,149 $579,528 $515,000 128 54.8% 211 2.9 97% 31 E. Gwillimbury 28 $13,946,125 $498,076 $452,000 48 52.8% 118 3.8 97% 27 Georgina 83 $26,351,011 $317,482 $307,000 137 64.7% 203 2.8 98% 32 King 28 $19,422,138 $693,648 $664,000 72 35.2% 188 7.9 96% 43 Markham 490 $321,351,874 $655,820 $609,995 764 50.9% 981 2.7 98% 25 Newmarket 134 $65,944,721 $492,125 $455,150 173 67.6% 185 1.7 98% 24 Richmond Hill 346 $239,349,000 $691,760 $624,900 542 46.2% 838 3.1 97% 25 Vaughan 346 $229,047,245 $661,986 $621,500 657 46.8% 1,007 3.1 97% 27 Whitchurch-Stouffville 81 $48,457,580 $598,242 $520,000 131 47.9% 245 3.7 97% 37 Durham Region 988 $358,927,956 $363,287 $339,250 1,418 64.2% 1,699 1.9 98% 24 Ajax 193 $77,205,719 $400,030 $373,500 250 63.3% 239 1.6 99% 20 Brock 11 $3,449,200 $313,564 $325,000 34 45.4% 126 7.3 94% 74 Clarington 142 $47,347,682 $333,434 $318,500 216 67.2% 273 1.9 99% 21 Oshawa 239 $67,283,280 $281,520 $265,000 357 67.8% 321 1.6 98% 21 Pickering 127 $55,023,100 $433,253 $397,000 192 62.2% 213 1.9 98% 25 Scugog 38 $13,235,500 $348,303 $320,050 54 55.8% 111 4.0 97% 50 Uxbridge 29 $15,061,400 $519,359 $478,000 50 54.2% 146 4.3 96% 35 Whitby 209 $80,322,075 $384,316 $360,000 265 65.5% 270 1.5 98% 24 Dufferin County 62 $22,852,940 $368,596 $338,500 67 63.9% 154 2.7 98% 44 Orangeville 62 $22,852,940 $368,596 $338,500 67 63.9% 154 2.7 98% 44 Simcoe County 246 $90,532,837 $368,020 $340,450 316 57.1% 674 3.8 97% 46 Adjala-Tosorontio 17 $6,756,600 $397,447 $375,000 26 49.3% 76 6.2 97% 58 Bradford West Gwillimbury 62 $26,708,087 $430,776 $432,500 75 54.7% 136 3.0 98% 41 Essa 27 $8,560,500 $317,056 $271,000 39 59.6% 95 3.9 97% 51 Innisfil 71 $26,002,050 $366,226 $318,000 96 55.7% 205 4.3 97% 49 New Tecumseth 69 $22,505,600 $326,168 $305,000 80 62.9% 162 3.4 97% 42 SUMMARY OF EXISTING HOME TRANSACTIONS ! TURN PAGE FOR CITY OF TORONTO TABLES OR CLICK HERE: Market Watch, July 2013 3 Toronto Real Estate Board
- 4. Market Watch, July 2013 July 2010Page 3 4 Toronto Real Estate Board ALL HOME TYPES, JULY 2013 CITY OF TORONTO MUNICIPAL BREAKDOWN Number of Sales Dollar Volume 1 Average Price 1 Median Price 1 New Listings 2 SNLR (Trend) 8 Active Listings 3 Mos. Inv. (Trend)9 Avg. SP/LP 4 Avg. DOM 5 TREB Total 8,544 $4,385,175,836 $513,246 $440,000 14,132 52.1% 20,514 2.8 98% 27 City of Toronto Total 3,062 $1,641,786,517 $536,181 $439,000 5,350 50.1% 7,849 2.9 98% 27 Toronto West 773 $381,914,517 $494,068 $449,900 1,249 52.6% 1,929 2.8 99% 27 Toronto W01 41 $27,033,600 $659,356 $525,000 73 55.8% 96 2.5 100% 20 Toronto W02 68 $42,253,439 $621,374 $618,050 88 67.0% 96 1.4 103% 17 Toronto W03 81 $37,112,319 $458,177 $450,000 105 61.3% 88 1.9 100% 21 Toronto W04 89 $37,296,875 $419,066 $410,000 121 56.5% 167 2.7 98% 32 Toronto W05 104 $39,455,899 $379,384 $399,500 164 54.8% 303 3.1 97% 28 Toronto W06 121 $57,362,131 $474,067 $458,500 225 37.6% 432 4.7 98% 34 Toronto W07 23 $16,674,500 $724,978 $670,000 43 64.9% 51 1.4 100% 20 Toronto W08 129 $81,013,928 $628,015 $579,900 218 51.9% 353 2.9 98% 27 Toronto W09 37 $16,735,025 $452,298 $510,500 60 56.2% 104 2.8 96% 35 Toronto W10 80 $26,976,801 $337,210 $396,250 152 51.0% 239 3.0 98% 26 Toronto Central 1,359 $844,590,902 $621,480 $425,000 2,645 45.1% 4,287 3.5 98% 29 Toronto C01 351 $155,629,442 $443,389 $395,000 809 40.2% 1,376 4.2 98% 30 Toronto C02 68 $70,881,614 $1,042,377 $700,500 137 41.5% 262 4.4 96% 30 Toronto C03 50 $55,902,839 $1,118,057 $763,500 69 54.2% 97 2.5 98% 27 Toronto C04 67 $71,103,805 $1,061,251 $883,500 117 49.9% 190 2.8 98% 27 Toronto C06 27 $15,945,518 $590,575 $610,000 62 44.2% 105 3.6 97% 37 Toronto C07 112 $61,851,288 $552,244 $403,500 216 43.4% 328 3.7 98% 29 Toronto C08 145 $61,721,314 $425,664 $369,900 265 47.9% 433 3.1 98% 30 Toronto C09 25 $22,991,700 $919,668 $729,000 38 52.8% 70 3.1 98% 22 Toronto C10 59 $34,490,300 $584,581 $488,000 76 55.6% 102 2.2 99% 21 Toronto C11 40 $21,727,900 $543,198 $302,000 53 58.9% 65 2.3 98% 24 Toronto C12 37 $60,466,216 $1,634,222 $1,380,000 73 36.7% 174 5.6 96% 32 Toronto C13 83 $56,870,165 $685,183 $461,000 108 59.3% 127 2.2 100% 25 Toronto C14 161 $85,277,525 $529,674 $386,000 373 41.2% 610 3.8 97% 36 Toronto C15 134 $69,731,276 $520,383 $438,000 249 47.3% 348 3.2 98% 29 Toronto East 930 $415,281,098 $446,539 $443,000 1,456 57.4% 1,633 2.1 99% 23 Toronto E01 81 $45,601,298 $562,979 $552,000 119 56.7% 119 1.7 102% 19 Toronto E02 75 $51,165,184 $682,202 $595,000 89 59.3% 91 1.5 100% 15 Toronto E03 83 $42,618,414 $513,475 $540,000 139 60.8% 113 1.5 101% 17 Toronto E04 122 $46,256,146 $379,149 $416,950 166 57.5% 206 2.3 99% 25 Toronto E05 96 $39,530,888 $411,780 $368,000 131 61.7% 142 1.9 99% 25 Toronto E06 36 $19,346,913 $537,414 $458,000 63 55.7% 65 1.8 97% 18 Toronto E07 104 $43,894,188 $422,060 $419,000 163 53.1% 201 2.7 100% 19 Toronto E08 67 $27,471,301 $410,019 $422,900 118 52.3% 135 2.7 99% 20 Toronto E09 115 $38,892,076 $338,192 $315,888 220 57.5% 252 2.4 98% 27 Toronto E10 72 $33,781,703 $469,190 $461,500 105 53.8% 142 2.6 98% 31 Toronto E11 79 $26,722,987 $338,266 $329,900 143 60.2% 167 2.3 99% 29 SUMMARY OF EXISTING HOME TRANSACTIONS
- 5. ALL HOME TYPES, YEAR-TO-DATE 2013 ALL TREB AREAS Number of Sales Dollar Volume 1 Average Price 1 Median Price 1 New Listings 2 Avg. SP/LP 4 Avg. DOM 5 TREB Total 54,337 $28,310,914,089 $521,025 $440,000 103,116 98% 26 Halton Region 4,245 $2,483,809,076 $585,114 $489,000 7,232 98% 28 Burlington 700 $364,648,355 $520,926 $450,000 1,150 98% 29 Halton Hills 604 $282,549,193 $467,797 $434,750 1,025 98% 30 Milton 1,334 $623,838,232 $467,645 $439,450 2,176 98% 22 Oakville 1,607 $1,212,773,296 $754,682 $632,000 2,881 97% 31 Peel Region 11,688 $5,385,786,738 $460,796 $418,995 23,322 98% 26 Brampton 4,970 $2,098,692,427 $422,272 $398,000 10,157 98% 26 Caledon 528 $307,524,418 $582,433 $524,500 1,143 97% 33 Mississauga 6,190 $2,979,569,893 $481,352 $430,000 12,022 98% 25 City of Toronto 20,033 $11,308,328,133 $564,485 $447,000 39,388 99% 25 York Region 10,073 $6,181,809,489 $613,701 $558,000 19,751 98% 25 Aurora 555 $318,425,908 $573,740 $520,000 997 98% 24 E. Gwillimbury 205 $105,381,034 $514,054 $455,000 376 97% 32 Georgina 517 $166,057,395 $321,194 $313,000 807 98% 31 King 166 $140,784,302 $848,098 $749,500 480 95% 44 Markham 2,815 $1,771,004,724 $629,131 $575,000 5,357 98% 24 Newmarket 895 $439,402,706 $490,953 $462,000 1,327 99% 21 Richmond Hill 2,024 $1,390,340,902 $686,927 $622,000 4,308 98% 25 Vaughan 2,409 $1,566,501,352 $650,270 $599,000 5,102 98% 25 Whitchurch-Stouffville 487 $283,911,166 $582,980 $508,000 997 97% 33 Durham Region 6,511 $2,311,506,300 $355,016 $330,000 10,367 98% 22 Ajax 1,145 $446,646,895 $390,085 $365,000 1,820 99% 19 Brock 108 $29,328,805 $271,563 $228,250 267 95% 67 Clarington 1,029 $321,124,309 $312,074 $292,000 1,611 99% 21 Oshawa 1,648 $466,057,245 $282,802 $268,000 2,450 98% 21 Pickering 800 $336,611,426 $420,764 $388,500 1,360 99% 22 Scugog 199 $76,854,000 $386,201 $360,000 363 98% 44 Uxbridge 207 $101,852,413 $492,041 $447,900 403 97% 38 Whitby 1,375 $533,031,207 $387,659 $365,000 2,093 99% 18 Dufferin County 409 $143,563,028 $351,010 $333,000 667 98% 37 Orangeville 409 $143,563,028 $351,010 $333,000 667 98% 37 Simcoe County 1,378 $496,111,325 $360,023 $334,722 2,389 98% 42 Adjala-Tosorontio 96 $40,977,688 $426,851 $404,000 202 97% 57 Bradford West Gwillimbury 389 $162,794,697 $418,495 $392,000 670 98% 32 Essa 193 $57,628,090 $298,591 $265,000 313 98% 45 Innisfil 330 $114,174,256 $345,983 $316,000 625 97% 47 New Tecumseth 370 $120,536,594 $325,775 $305,000 579 98% 43 ! TURN PAGE FOR CITY OF TORONTO TABLES OR CLICK HERE: SUMMARY OF EXISTING HOME TRANSACTIONS Market Watch, July 2013 July 2010Page 3 5 Toronto Real Estate Board
- 6. Market Watch, July 2013 July 2010Page 3 6 Toronto Real Estate Board ALL HOME TYPES, YEAR-TO-DATE 2013 CITY OF TORONTO MUNICIPAL BREAKDOWN Number of Sales Dollar Volume 1 Average Price 1 Median Price 1 New Listings 2 Avg. SP/LP 4 Avg. DOM 5 TREB Total 54,337 $28,310,914,089 $521,025 $440,000 103,116 98% 26 City of Toronto Total 20,033 $11,308,328,133 $564,485 $447,000 39,388 99% 25 Toronto West 5,098 $2,526,064,146 $495,501 $435,000 9,652 100% 26 Toronto W01 299 $198,822,647 $664,959 $635,000 552 102% 22 Toronto W02 559 $343,147,746 $613,860 $580,800 809 103% 17 Toronto W03 451 $196,705,332 $436,154 $430,000 698 101% 21 Toronto W04 467 $185,712,345 $397,671 $398,000 832 98% 28 Toronto W05 626 $228,442,194 $364,924 $385,000 1,190 97% 30 Toronto W06 716 $330,902,435 $462,154 $425,000 1,900 99% 33 Toronto W07 204 $155,502,508 $762,267 $692,000 326 101% 18 Toronto W08 961 $598,676,101 $622,972 $523,000 1,838 99% 26 Toronto W09 295 $125,075,114 $423,983 $434,000 500 98% 29 Toronto W10 520 $163,077,724 $313,611 $356,000 1,007 98% 29 Toronto Central 9,034 $6,070,936,690 $672,010 $465,800 19,700 98% 27 Toronto C01 2,322 $1,073,241,187 $462,206 $395,000 5,754 99% 29 Toronto C02 429 $453,314,800 $1,056,678 $820,000 1,043 98% 26 Toronto C03 330 $348,367,834 $1,055,660 $751,000 587 99% 22 Toronto C04 630 $706,906,145 $1,122,073 $1,040,000 1,221 99% 22 Toronto C06 206 $123,691,919 $600,446 $612,500 488 98% 30 Toronto C07 656 $389,169,700 $593,246 $428,500 1,479 99% 31 Toronto C08 938 $427,733,264 $456,006 $391,500 1,916 99% 28 Toronto C09 180 $214,561,178 $1,192,007 $859,000 337 99% 26 Toronto C10 406 $261,641,064 $644,436 $546,950 717 101% 20 Toronto C11 318 $222,015,316 $698,161 $425,000 484 99% 27 Toronto C12 243 $437,423,606 $1,800,097 $1,555,000 632 96% 28 Toronto C13 514 $337,042,845 $655,725 $490,000 840 100% 24 Toronto C14 1,039 $624,283,210 $600,850 $425,000 2,472 97% 31 Toronto C15 823 $451,544,622 $548,657 $439,900 1,730 98% 26 Toronto East 5,901 $2,711,327,297 $459,469 $440,000 10,036 100% 21 Toronto E01 589 $348,573,144 $591,805 $565,000 1,030 103% 16 Toronto E02 501 $341,847,322 $682,330 $615,000 826 101% 12 Toronto E03 626 $348,870,291 $557,301 $535,000 1,024 102% 17 Toronto E04 683 $251,373,203 $368,043 $405,000 1,169 99% 24 Toronto E05 619 $259,795,083 $419,701 $361,800 931 99% 22 Toronto E06 258 $142,033,709 $550,518 $480,000 458 99% 16 Toronto E07 576 $237,427,450 $412,200 $416,000 1,011 100% 25 Toronto E08 379 $158,831,063 $419,079 $420,000 703 99% 24 Toronto E09 722 $245,954,872 $340,658 $329,000 1,275 99% 25 Toronto E10 406 $188,266,951 $463,712 $453,500 735 99% 24 Toronto E11 542 $188,354,209 $347,517 $329,700 874 98% 26 SUMMARY OF EXISTING HOME TRANSACTIONS
- 7. Market Watch, July 2013 Industrial Leasing July 2010Page 3 7 Toronto Real Estate Board ALL TREB AREAS Sales 1 Dollar Volume 1 Average Price 1 Median Price 1 New Listings 2 Active Listings 3 Avg. SP/LP 4 Avg. DOM 5 TREB Total 4,129 $2,660,368,846 $644,313 $559,000 6,788 10,008 98% 27- - - - - - - - Halton Region 411 $280,195,018 $681,740 $585,000 635 1,053 97% 30 Burlington 72 $48,911,950 $679,333 $586,000 96 183 96% 30 Halton Hills 90 $47,719,653 $530,218 $488,000 103 201 97% 30 Milton 107 $60,878,959 $568,962 $534,500 187 239 98% 27 Oakville 142 $122,684,456 $863,975 $742,750 249 430 97% 32- - - - - - - - Peel Region 844 $506,889,393 $600,580 $544,500 1,600 2,357 97% 28 Brampton 462 $230,944,045 $499,879 $475,050 876 1,213 97% 29 Caledon 50 $30,788,100 $615,762 $581,000 115 281 98% 34 Mississauga 332 $245,157,248 $738,425 $635,000 609 863 97% 25- - - - - - - - City of Toronto 986 $782,728,657 $793,842 $620,000 1,599 2,031 98% 22 - - - - - - - - York Region 967 $721,612,853 $746,239 $693,888 1,589 2,496 97% 27 Aurora 54 $36,646,450 $678,638 $621,000 77 127 97% 33 E. Gwillimbury 26 $13,311,475 $511,980 $459,500 45 113 97% 29 Georgina 76 $24,343,611 $320,311 $308,500 126 190 98% 31 King 21 $15,945,638 $759,316 $678,000 67 164 96% 40 Markham 256 $214,348,188 $837,298 $753,500 367 452 98% 25 Newmarket 81 $45,538,821 $562,208 $530,000 125 148 98% 24 Richmond Hill 198 $171,368,140 $865,496 $776,250 318 526 97% 23 Vaughan 202 $163,060,750 $807,231 $724,000 368 566 97% 28 Whitchurch-Stouffville 53 $37,049,780 $699,052 $600,000 96 210 96% 44- - - - - - - - Durham Region 680 $274,096,248 $403,083 $379,500 1,050 1,372 98% 25 Ajax 129 $57,173,789 $443,208 $427,500 173 175 99% 18 Brock 11 $3,449,200 $313,564 $325,000 33 120 94% 74 Clarington 100 $37,072,922 $370,729 $341,000 165 225 99% 23 Oshawa 165 $51,602,038 $312,740 $295,000 261 245 98% 21 Pickering 73 $37,498,450 $513,677 $460,000 128 154 98% 24 Scugog 36 $12,763,000 $354,528 $328,800 53 111 97% 52 Uxbridge 22 $12,964,000 $589,273 $560,000 43 132 96% 34 Whitby 144 $61,572,849 $427,589 $396,750 194 210 98% 25- - - - - - - - Dufferin County 44 $17,604,040 $400,092 $381,500 49 117 98% 43 Orangeville 44 $17,604,040 $400,092 $381,500 49 117 98% 43- - - - - - - - Simcoe County 197 $77,242,637 $392,095 $365,000 266 582 97% 48 Adjala-Tosorontio 17 $6,756,600 $397,447 $375,000 26 76 97% 58 Bradford West Gwillimbury 45 $21,356,087 $474,580 $490,000 60 118 98% 42 Essa 21 $7,048,500 $335,643 $303,000 34 86 97% 56 Innisfil 65 $24,454,150 $376,218 $320,000 88 199 97% 50 New Tecumseth 49 $17,627,300 $359,741 $346,500 58 103 97% 45 SUMMARY OF EXISTING HOME TRANSACTIONS DETACHED HOUSES, JULY 2013 ! TURN PAGE FOR CITY OF TORONTO TABLES OR CLICK HERE:
- 8. Market Watch, July 2013 Industrial Leasing July 2010Page 3 8 Toronto Real Estate Board CITY OF TORONTO MUNICIPAL BREAKDOWN Sales1 Dollar Volume1 Average Price1 Median Price1 New Listings2 Active Listings3 Avg. SP/LP4 Avg. DOM5 TREB Total 4,129 $2,660,368,846 $644,313 $559,000 6,788 10,008 98% 27 City of Toronto Total 986 $782,728,657 $793,842 $620,000 1,599 2,031 98% 22 Toronto West 326 $213,909,512 $656,164 $590,000 450 569 99% 24 Toronto W01 12 $13,534,100 $1,127,842 $1,055,000 16 22 100% 11 Toronto W02 24 $19,302,291 $804,262 $770,000 30 31 102% 19 Toronto W03 38 $18,179,700 $478,413 $450,000 51 45 101% 23 Toronto W04 39 $21,042,675 $539,556 $525,000 51 67 98% 24 Toronto W05 24 $13,895,200 $578,967 $552,500 43 75 97% 38 Toronto W06 40 $22,408,282 $560,207 $558,450 51 53 100% 24 Toronto W07 15 $11,643,000 $776,200 $710,000 30 30 101% 10 Toronto W08 72 $61,896,538 $859,674 $716,250 84 134 98% 25 Toronto W09 20 $13,024,125 $651,206 $600,000 27 36 97% 33 Toronto W10 42 $18,983,601 $451,991 $431,000 67 76 98% 25 Toronto Central 258 $339,960,198 $1,317,675 $1,013,500 488 835 97% 26 Toronto C01 4 $2,585,000 $646,250 $662,500 7 15 106% 11 Toronto C02 12 $21,761,500 $1,813,458 $2,065,000 16 28 95% 38 Toronto C03 30 $41,681,139 $1,389,371 $810,000 44 68 97% 23 Toronto C04 41 $59,620,165 $1,454,150 $1,250,000 82 137 98% 26 Toronto C06 14 $11,579,018 $827,073 $721,500 26 42 97% 27 Toronto C07 32 $32,479,988 $1,015,000 $899,500 67 118 98% 29 Toronto C08 1 $660,000 $660,000 $660,000 1 2 94% 12 Toronto C09 7 $10,200,000 $1,457,143 $1,250,000 16 32 99% 21 Toronto C10 11 $10,964,600 $996,782 $995,000 17 18 98% 16 Toronto C11 7 $10,365,500 $1,480,786 $1,489,000 6 11 98% 32 Toronto C12 21 $48,117,500 $2,291,310 $1,900,000 48 127 96% 33 Toronto C13 32 $39,319,488 $1,228,734 $957,500 30 34 100% 20 Toronto C14 22 $29,187,300 $1,326,695 $1,203,750 86 144 95% 30 Toronto C15 24 $21,439,000 $893,292 $877,500 42 59 98% 22 Toronto East 402 $228,858,947 $569,301 $523,000 661 627 99% 18 Toronto E01 13 $8,538,144 $656,780 $591,450 25 22 101% 13 Toronto E02 26 $24,461,106 $940,812 $850,500 36 32 99% 15 Toronto E03 46 $27,658,844 $601,279 $591,500 99 76 102% 13 Toronto E04 58 $27,292,564 $470,561 $465,000 73 73 100% 17 Toronto E05 30 $18,460,800 $615,360 $616,500 43 46 99% 22 Toronto E06 31 $17,108,900 $551,900 $463,000 55 55 97% 16 Toronto E07 39 $23,268,500 $596,628 $586,000 54 44 101% 14 Toronto E08 35 $20,365,001 $581,857 $505,000 66 70 99% 15 Toronto E09 52 $23,436,300 $450,698 $448,350 85 68 99% 19 Toronto E10 45 $24,900,200 $553,338 $515,000 72 91 97% 32 Toronto E11 27 $13,368,588 $495,133 $475,000 53 50 99% 21 DETACHED HOUSES, JULY 2013 SUMMARY OF EXISTING HOME TRANSACTIONS
- 9. Industrial Leasing Toronto Real Estate Board ALL TREB AREAS Sales 1 Dollar Volume 1 Average Price 1 Median Price 1 New Listings 2 Active Listings 3 Avg. SP/LP 4 Avg. DOM 5 TREB Total 957 $455,660,677 $476,134 $448,500 1,207 1,108 100% 20- - - - - - - - Halton Region 61 $26,412,781 $432,996 $430,000 56 42 99% 17 Burlington 12 $5,084,400 $423,700 $441,000 5 2 99% 17 Halton Hills 4 $1,524,000 $381,000 $384,500 2 1 99% 21 Milton 34 $14,433,581 $424,517 $428,200 35 23 99% 16 Oakville 11 $5,370,800 $488,255 $474,000 14 16 98% 22- - - - - - - - Peel Region 341 $142,231,276 $417,101 $424,000 502 519 98% 22 Brampton 158 $59,234,644 $374,903 $371,000 272 309 98% 24 Caledon 8 $3,345,499 $418,187 $409,750 6 9 98% 25 Mississauga 175 $79,651,133 $455,149 $450,000 224 201 98% 19- - - - - - - - City of Toronto 340 $198,729,564 $584,499 $560,250 403 320 101% 17 - - - - - - - - York Region 139 $67,234,906 $483,704 $492,000 162 159 99% 24 Aurora 8 $3,206,000 $400,750 $401,000 12 7 98% 14 E. Gwillimbury - - - - - 2 - - Georgina 4 $1,264,900 $316,225 $314,500 4 4 98% 30 King 2 $1,025,000 $512,500 $512,500 - 1 92% 58 Markham 34 $17,833,838 $524,525 $501,750 40 32 99% 22 Newmarket 24 $9,428,400 $392,850 $399,750 24 21 98% 32 Richmond Hill 17 $9,466,880 $556,875 $568,000 21 27 99% 20 Vaughan 41 $21,283,988 $519,122 $515,000 55 59 99% 24 Whitchurch-Stouffville 9 $3,725,900 $413,989 $430,000 6 6 98% 24- - - - - - - - Durham Region 62 $16,788,150 $270,777 $246,250 75 52 99% 16 Ajax 14 $4,899,900 $349,993 $346,000 18 13 99% 18 Brock - - - - - - - - Clarington 1 $233,000 $233,000 $233,000 3 4 97% 13 Oshawa 32 $6,713,350 $209,792 $211,050 43 26 99% 16 Pickering 10 $3,553,400 $355,340 $348,000 5 5 98% 18 Scugog 2 $472,500 $236,250 $236,250 1 - 98% 5 Uxbridge - - - - - - - - Whitby 3 $916,000 $305,333 $290,000 5 4 99% 10- - - - - - - - Dufferin County 7 $2,006,000 $286,571 $263,000 4 7 98% 27 Orangeville 7 $2,006,000 $286,571 $263,000 4 7 98% 27- - - - - - - - Simcoe County 7 $2,258,000 $322,571 $289,000 5 9 97% 37 Adjala-Tosorontio - - - - - - - - Bradford West Gwillimbury 6 $2,022,000 $337,000 $336,500 3 6 97% 43 Essa - - - - - 1 - - Innisfil - - - - - - - - New Tecumseth 1 $236,000 $236,000 $236,000 2 2 98% 6 ! TURN PAGE FOR CITY OF TORONTO TABLES OR CLICK HERE: SUMMARY OF EXISTING HOME TRANSACTIONS SEMI-DETACHED HOUSES, JULY 2013 July 2010Page 3 Market Watch, July 2013 9
- 10. Industrial Leasing July 2010Page 3 Toronto Real Estate Board Market Watch, July 2013 CITY OF TORONTO MUNICIPAL BREAKDOWN Sales1 Dollar Volume1 Average Price1 Median Price1 New Listings2 Active Listings3 Avg. SP/LP4 Avg. DOM5 TREB Total 957 $455,660,677 $476,134 $448,500 1,207 1,108 100% 20 City of Toronto Total 340 $198,729,564 $584,499 $560,250 403 320 101% 17 Toronto West 115 $59,678,815 $518,946 $479,000 129 123 101% 20 Toronto W01 6 $4,477,000 $746,167 $706,000 4 1 106% 24 Toronto W02 23 $14,084,498 $612,369 $620,000 25 14 104% 10 Toronto W03 30 $15,075,619 $502,521 $498,000 31 21 100% 20 Toronto W04 14 $6,751,000 $482,214 $443,250 11 7 100% 30 Toronto W05 32 $14,437,699 $451,178 $431,000 45 66 97% 21 Toronto W06 3 $1,423,999 $474,666 $502,999 2 6 100% 35 Toronto W07 - - - - - 1 - - Toronto W08 1 $475,000 $475,000 $475,000 - - 101% 29 Toronto W09 3 $1,820,000 $606,667 $700,000 4 1 96% 7 Toronto W10 3 $1,134,000 $378,000 $386,000 7 6 99% 25 Toronto Central 102 $73,007,144 $715,756 $646,400 114 84 101% 15 Toronto C01 18 $12,661,894 $703,439 $700,175 24 21 101% 16 Toronto C02 13 $13,180,250 $1,013,865 $902,000 20 18 102% 9 Toronto C03 11 $8,036,800 $730,618 $780,000 11 8 105% 18 Toronto C04 1 $785,000 $785,000 $785,000 2 2 103% 5 Toronto C06 - - - - - - - - Toronto C07 8 $4,413,000 $551,625 $555,000 5 2 99% 17 Toronto C08 5 $5,178,000 $1,035,600 $950,000 3 5 98% 28 Toronto C09 1 $1,250,000 $1,250,000 $1,250,000 2 3 96% 10 Toronto C10 9 $6,311,700 $701,300 $692,000 11 7 103% 11 Toronto C11 8 $5,681,500 $710,188 $709,500 8 1 101% 10 Toronto C12 1 $570,000 $570,000 $570,000 1 - 97% 6 Toronto C13 7 $3,454,700 $493,529 $480,000 4 1 102% 11 Toronto C14 - - - - - - - - Toronto C15 20 $11,484,300 $574,215 $578,250 23 16 100% 17 Toronto East 123 $66,043,605 $536,940 $515,000 160 113 102% 16 Toronto E01 41 $24,929,764 $608,043 $581,000 47 27 104% 17 Toronto E02 30 $17,211,374 $573,712 $587,000 33 25 102% 16 Toronto E03 19 $9,716,680 $511,404 $502,000 20 13 103% 13 Toronto E04 7 $3,190,700 $455,814 $443,500 10 9 100% 15 Toronto E05 4 $1,981,500 $495,375 $484,250 8 5 103% 9 Toronto E06 1 $529,500 $529,500 $529,500 4 3 98% 48 Toronto E07 8 $3,513,688 $439,211 $439,400 10 7 101% 14 Toronto E08 2 $802,000 $401,000 $401,000 5 3 100% 5 Toronto E09 3 $1,105,500 $368,500 $373,000 4 2 102% 14 Toronto E10 3 $1,088,400 $362,800 $347,900 9 8 98% 11 Toronto E11 5 $1,974,499 $394,900 $393,500 10 11 100% 26 SUMMARY OF EXISTING HOME TRANSACTIONS SEMI-DETACHED HOUSES, JULY 2013 10
- 11. Industrial Leasing July 2010Page 3 Toronto Real Estate Board Market Watch, July 2013 ALL TREB AREAS Sales 1 Dollar Volume 1 Average Price 1 Median Price 1 New Listings 2 Active Listings 3 Avg. SP/LP 4 Avg. DOM 5 TREB Total 708 $249,407,946 $352,271 $329,650 1,015 1,293 98% 29- - - - - - - - Halton Region 56 $18,331,650 $327,351 $307,000 57 83 98% 29 Burlington 14 $4,347,700 $310,550 $311,500 14 25 98% 32 Halton Hills 8 $1,936,900 $242,113 $239,000 6 8 98% 39 Milton 12 $3,814,050 $317,838 $284,275 11 9 98% 18 Oakville 22 $8,233,000 $374,227 $338,500 26 41 97% 28- - - - - - - - Peel Region 255 $84,280,984 $330,514 $319,000 383 459 98% 30 Brampton 55 $14,273,149 $259,512 $240,000 108 138 97% 34 Caledon 1 $340,000 $340,000 $340,000 - - 97% 22 Mississauga 199 $69,667,835 $350,090 $335,000 275 321 98% 29- - - - - - - - City of Toronto 249 $99,795,420 $400,785 $360,000 336 436 98% 27 - - - - - - - - York Region 74 $30,255,900 $408,864 $369,900 141 210 98% 28 Aurora 8 $3,844,000 $480,500 $354,000 12 23 98% 33 E. Gwillimbury - - - - - - - - Georgina - - - - 1 2 - - King - - - - - - - - Markham 36 $14,128,700 $392,464 $368,000 75 100 98% 32 Newmarket 7 $2,310,100 $330,014 $335,100 6 7 98% 24 Richmond Hill 12 $5,148,600 $429,050 $421,500 27 36 98% 20 Vaughan 10 $4,575,500 $457,550 $450,250 20 42 97% 25 Whitchurch-Stouffville 1 $249,000 $249,000 $249,000 - - 98% 23- - - - - - - - Durham Region 64 $14,420,492 $225,320 $233,450 88 86 99% 27 Ajax 10 $2,643,000 $264,300 $264,500 20 17 100% 29 Brock - - - - 1 5 - - Clarington 6 $1,076,500 $179,417 $171,500 9 9 99% 21 Oshawa 20 $3,538,892 $176,945 $170,500 23 19 98% 25 Pickering 16 $4,150,300 $259,394 $246,250 23 21 99% 32 Scugog - - - - - - - - Uxbridge 2 $605,000 $302,500 $302,500 - 4 97% 37 Whitby 10 $2,406,800 $240,680 $242,450 12 11 98% 25- - - - - - - - Dufferin County 4 $948,000 $237,000 $230,500 6 12 97% 63 Orangeville 4 $948,000 $237,000 $230,500 6 12 97% 63- - - - - - - - Simcoe County 6 $1,375,500 $229,250 $230,000 4 7 98% 45 Adjala-Tosorontio - - - - - - - - Bradford West Gwillimbury 2 $460,000 $230,000 $230,000 2 2 99% 29 Essa - - - - - - - - Innisfil - - - - - - - - New Tecumseth 4 $915,500 $228,875 $232,500 2 5 98% 52 ! TURN PAGE FOR CITY OF TORONTO TABLES OR CLICK HERE: SUMMARY OF EXISTING HOME TRANSACTIONS CONDOMINIUM TOWNHOUSES, JULY 2013 11
- 12. Industrial Leasing July 2010Page 3 Toronto Real Estate Board Market Watch, July 2013 12 CITY OF TORONTO MUNICIPAL BREAKDOWN Sales1 Dollar Volume1 Average Price1 Median Price1 New Listings2 Active Listings3 Avg. SP/LP4 Avg. DOM5 TREB Total 708 $249,407,946 $352,271 $329,650 1,015 1,293 98% 29 City of Toronto Total 249 $99,795,420 $400,785 $360,000 336 436 98% 27 Toronto West 73 $23,768,500 $325,596 $298,500 83 118 98% 32 Toronto W01 4 $1,623,000 $405,750 $377,500 3 4 97% 24 Toronto W02 5 $2,093,150 $418,630 $399,900 6 5 101% 26 Toronto W03 1 $345,000 $345,000 $345,000 6 8 102% 14 Toronto W04 13 $3,813,500 $293,346 $279,000 17 18 98% 36 Toronto W05 24 $6,211,000 $258,792 $255,800 16 34 97% 29 Toronto W06 10 $5,084,250 $508,425 $454,250 9 10 98% 36 Toronto W07 2 $906,500 $453,250 $453,250 - - 98% 67 Toronto W08 5 $1,714,100 $342,820 $355,000 8 18 98% 38 Toronto W09 - - - - 4 4 - - Toronto W10 9 $1,978,000 $219,778 $246,500 14 17 98% 25 Toronto Central 90 $48,966,747 $544,075 $432,500 142 174 98% 24 Toronto C01 20 $9,821,059 $491,053 $447,000 37 42 99% 17 Toronto C02 1 $399,000 $399,000 $399,000 4 10 100% 3 Toronto C03 2 $3,049,900 $1,524,950 $1,524,950 1 1 97% 39 Toronto C04 - - - - 1 5 - - Toronto C06 - - - - - 4 - - Toronto C07 6 $2,556,000 $426,000 $394,500 9 8 99% 24 Toronto C08 5 $2,697,000 $539,400 $485,000 11 16 99% 13 Toronto C09 2 $2,729,000 $1,364,500 $1,364,500 - 1 90% 32 Toronto C10 4 $2,019,500 $504,875 $428,250 2 5 98% 22 Toronto C11 2 $600,000 $300,000 $300,000 - - 97% 52 Toronto C12 7 $5,470,700 $781,529 $659,000 7 11 100% 38 Toronto C13 3 $1,305,000 $435,000 $440,000 4 3 102% 23 Toronto C14 13 $6,950,888 $534,684 $635,000 21 23 97% 31 Toronto C15 25 $11,368,700 $454,748 $404,000 45 45 99% 23 Toronto East 86 $27,060,173 $314,653 $329,900 111 144 98% 26 Toronto E01 3 $1,148,400 $382,800 $380,000 9 12 99% 30 Toronto E02 4 $2,125,188 $531,297 $509,650 5 6 100% 8 Toronto E03 2 $591,500 $295,750 $295,750 3 4 96% 50 Toronto E04 14 $4,991,382 $356,527 $348,091 11 14 99% 23 Toronto E05 16 $5,641,700 $352,606 $348,450 17 18 99% 21 Toronto E06 - - - - - - - - Toronto E07 11 $3,983,400 $362,127 $367,000 18 18 98% 19 Toronto E08 4 $985,000 $246,250 $225,000 4 8 98% 29 Toronto E09 6 $1,253,700 $208,950 $226,500 13 16 97% 61 Toronto E10 7 $1,691,503 $241,643 $262,500 9 17 100% 16 Toronto E11 19 $4,648,400 $244,653 $218,000 22 31 97% 31 SUMMARY OF EXISTING HOME TRANSACTIONS CONDOMINIUM TOWNHOUSES, JULY 2013
- 13. Industrial Leasing July 2010Page 3 Toronto Real Estate Board Market Watch, July 2013 ALL TREB AREAS Sales 1 Dollar Volume 1 Average Price 1 Median Price 1 New Listings 2 Active Listings 3 Avg. SP/LP 4 Avg. DOM 5 TREB Total 1,894 $641,789,232 $338,854 $310,000 3,962 6,903 97% 34- - - - - - - - Halton Region 42 $15,015,300 $357,507 $306,250 91 169 98% 35 Burlington 13 $4,015,400 $308,877 $272,000 34 55 99% 21 Halton Hills 1 $232,500 $232,500 $232,500 2 2 99% 44 Milton 9 $2,583,900 $287,100 $291,500 16 19 98% 35 Oakville 19 $8,183,500 $430,711 $385,000 39 93 98% 44- - - - - - - - Peel Region 286 $70,752,529 $247,386 $235,000 626 1,064 97% 35 Brampton 52 $10,614,601 $204,127 $199,500 98 158 97% 39 Caledon 1 $445,000 $445,000 $445,000 1 2 97% 32 Mississauga 233 $59,692,928 $256,193 $250,000 527 904 97% 34- - - - - - - - City of Toronto 1,353 $489,744,232 $361,969 $330,000 2,816 4,830 97% 33 - - - - - - - - York Region 165 $54,016,495 $327,373 $309,000 369 735 97% 39 Aurora 2 $585,000 $292,500 $292,500 5 35 96% 63 E. Gwillimbury - - - - - 1 - - Georgina 1 $207,500 $207,500 $207,500 - 1 97% 79 King 1 $325,000 $325,000 $325,000 4 19 96% 64 Markham 61 $20,320,888 $333,129 $298,000 139 259 97% 37 Newmarket 2 $419,500 $209,750 $209,750 3 3 95% 86 Richmond Hill 47 $14,647,200 $311,643 $304,500 99 166 96% 41 Vaughan 49 $16,704,007 $340,898 $325,000 113 236 96% 35 Whitchurch-Stouffville 2 $807,400 $403,700 $403,700 6 15 100% 41- - - - - - - - Durham Region 42 $10,551,676 $251,230 $229,000 55 84 97% 43 Ajax 4 $918,000 $229,500 $224,000 3 7 98% 66 Brock - - - - - 1 - - Clarington 4 $831,000 $207,750 $192,500 8 18 97% 41 Oshawa 7 $1,685,000 $240,714 $212,000 15 19 97% 54 Pickering 13 $3,533,000 $271,769 $258,000 14 18 98% 32 Scugog - - - - - - - - Uxbridge 3 $823,400 $274,467 $262,500 1 5 96% 53 Whitby 11 $2,761,276 $251,025 $234,000 14 16 97% 39- - - - - - - - Dufferin County 2 $840,000 $420,000 $420,000 2 9 94% 114 Orangeville 2 $840,000 $420,000 $420,000 2 9 94% 114- - - - - - - - Simcoe County 4 $869,000 $217,250 $226,000 3 12 97% 41 Adjala-Tosorontio - - - - - - - - Bradford West Gwillimbury 2 $460,000 $230,000 $230,000 - - 98% 25 Essa - - - - - - - - Innisfil - - - - - - - - New Tecumseth 2 $409,000 $204,500 $204,500 3 12 97% 57 ! TURN PAGE FOR CITY OF TORONTO TABLES OR CLICK HERE: SUMMARY OF EXISTING HOME TRANSACTIONS CONDOMINIUM APARTMENT, JULY 2013 13
- 14. Industrial Leasing July 2010Page 3 Toronto Real Estate Board Market Watch, July 2013 14 CITY OF TORONTO MUNICIPAL BREAKDOWN Sales1 Dollar Volume1 Average Price1 Median Price1 New Listings2 Active Listings3 Avg. SP/LP4 Avg. DOM5 TREB Total 1,894 $641,789,232 $338,854 $310,000 3,962 6,903 97% 34 City of Toronto Total 1,353 $489,744,232 $361,969 $330,000 2,816 4,830 97% 33 Toronto West 228 $68,960,190 $302,457 $272,250 536 1,061 98% 33 Toronto W01 19 $7,399,500 $389,447 $365,000 50 69 99% 23 Toronto W02 14 $5,763,500 $411,679 $449,000 20 41 101% 24 Toronto W03 9 $2,288,000 $254,222 $242,000 11 8 99% 19 Toronto W04 18 $3,647,200 $202,622 $191,000 37 70 96% 46 Toronto W05 22 $4,424,500 $201,114 $181,000 52 118 97% 27 Toronto W06 56 $21,528,100 $384,430 $333,500 153 350 97% 43 Toronto W07 3 $2,036,000 $678,667 $615,000 6 11 96% 34 Toronto W08 49 $15,588,290 $318,128 $298,000 124 197 99% 31 Toronto W09 13 $1,830,900 $140,838 $135,500 24 61 95% 47 Toronto W10 25 $4,454,200 $178,168 $174,000 59 136 97% 26 Toronto Central 872 $357,983,863 $410,532 $364,900 1,838 3,091 97% 33 Toronto C01 298 $123,380,989 $414,030 $375,000 719 1,274 98% 32 Toronto C02 35 $30,239,364 $863,982 $524,600 88 191 93% 38 Toronto C03 7 $3,135,000 $447,857 $460,000 7 12 98% 57 Toronto C04 23 $9,576,640 $416,376 $330,000 27 31 98% 28 Toronto C06 13 $4,366,500 $335,885 $340,000 35 57 97% 47 Toronto C07 65 $21,757,300 $334,728 $320,000 134 196 98% 30 Toronto C08 130 $50,033,564 $384,874 $363,500 246 402 98% 31 Toronto C09 10 $6,166,500 $616,650 $512,500 16 22 99% 21 Toronto C10 34 $14,880,500 $437,662 $430,500 45 69 98% 25 Toronto C11 23 $5,080,900 $220,909 $208,000 37 52 97% 24 Toronto C12 8 $6,308,016 $788,502 $387,500 17 35 93% 26 Toronto C13 40 $12,519,977 $312,999 $294,000 67 87 98% 33 Toronto C14 122 $45,709,337 $374,667 $360,500 262 435 98% 38 Toronto C15 64 $24,829,276 $387,957 $342,500 138 228 98% 37 Toronto East 253 $62,800,179 $248,222 $230,000 442 678 98% 31 Toronto E01 20 $8,639,290 $431,965 $405,200 25 47 99% 30 Toronto E02 9 $3,833,900 $425,989 $403,000 7 22 99% 14 Toronto E03 13 $2,521,400 $193,954 $148,000 15 16 98% 26 Toronto E04 34 $6,870,700 $202,079 $192,500 64 102 97% 35 Toronto E05 39 $10,069,500 $258,192 $245,000 57 70 97% 33 Toronto E06 4 $1,708,513 $427,128 $432,000 3 5 98% 23 Toronto E07 36 $8,677,800 $241,050 $237,000 71 125 98% 26 Toronto E08 23 $4,064,400 $176,713 $172,000 34 47 97% 25 Toronto E09 54 $13,096,576 $242,529 $240,500 117 162 97% 32 Toronto E10 4 $593,700 $148,425 $158,850 9 18 96% 35 Toronto E11 17 $2,724,400 $160,259 $160,000 40 64 96% 45 SUMMARY OF EXISTING HOME TRANSACTIONS CONDOMINIUM APARTMENT, JULY 2013
- 15. Industrial Leasing July 2010Page 3 Toronto Real Estate Board Market Watch, July 2013 ALL TREB AREAS Sales 1 Dollar Volume 1 Average Price 1 Median Price 1 New Listings 2 Active Listings 3 Avg. SP/LP 4 Avg. DOM 5 TREB Total 156 $68,620,464 $439,875 $437,500 181 145 99% 21- - - - - - - - Halton Region 11 $4,476,750 $406,977 $403,000 11 11 99% 22 Burlington - - - - 2 4 - - Halton Hills 3 $1,082,000 $360,667 $352,000 2 - 98% 20 Milton 4 $1,565,750 $391,438 $390,375 3 4 98% 27 Oakville 4 $1,829,000 $457,250 $453,000 4 3 100% 19- - - - - - - - Peel Region 13 $5,840,350 $449,258 $478,500 16 18 98% 26 Brampton 5 $1,840,400 $368,080 $350,000 5 6 97% 14 Caledon - - - - 1 2 - - Mississauga 8 $3,999,950 $499,994 $504,600 10 10 98% 33- - - - - - - - City of Toronto 13 $6,188,300 $476,023 $480,000 20 15 100% 14 - - - - - - - - York Region 67 $36,605,164 $546,346 $551,000 81 64 100% 19 Aurora 4 $1,995,700 $498,925 $500,400 2 2 99% 22 E. Gwillimbury - - - - - - - - Georgina - - - - - - - - King - - - - 1 1 - - Markham 46 $25,226,664 $548,406 $545,900 59 45 100% 16 Newmarket 1 $410,000 $410,000 $410,000 1 - 96% 12 Richmond Hill 5 $2,774,000 $554,800 $562,000 7 8 98% 35 Vaughan 10 $5,778,800 $577,880 $568,900 11 8 97% 22 Whitchurch-Stouffville 1 $420,000 $420,000 $420,000 - - 98% 27- - - - - - - - Durham Region 37 $11,012,100 $297,624 $295,000 41 23 99% 15 Ajax 3 $993,000 $331,000 $305,000 2 2 103% 12 Brock - - - - - - - - Clarington 15 $4,233,200 $282,213 $270,000 18 7 99% 10 Oshawa 7 $1,785,900 $255,129 $246,000 7 6 99% 26 Pickering 2 $769,000 $384,500 $384,500 4 3 97% 39 Scugog - - - - - - - - Uxbridge 1 $342,000 $342,000 $342,000 2 1 98% 14 Whitby 9 $2,889,000 $321,000 $329,000 8 4 99% 12- - - - - - - - Dufferin County - - - - 3 4 - - Orangeville - - - - 3 4 - -- - - - - - - - Simcoe County 15 $4,497,800 $299,853 $295,000 9 10 98% 52 Adjala-Tosorontio - - - - - - - - Bradford West Gwillimbury 7 $2,410,000 $344,286 $346,000 7 6 98% 45 Essa 2 $504,000 $252,000 $252,000 - - 98% 68 Innisfil 2 $549,900 $274,950 $274,950 1 2 100% 63 New Tecumseth 4 $1,033,900 $258,475 $264,000 1 2 97% 49 SUMMARY OF EXISTING HOME TRANSACTIONS LINK, JULY 2013 ! TURN PAGE FOR CITY OF TORONTO TABLES OR CLICK HERE: 15
- 16. Industrial Leasing July 2010Page 3 Toronto Real Estate Board Market Watch, July 2013 16 CITY OF TORONTO MUNICIPAL BREAKDOWN Sales1 Dollar Volume1 Average Price1 Median Price1 New Listings2 Active Listings3 Avg. SP/LP4 Avg. DOM5 TREB Total 156 $68,620,464 $439,875 $437,500 181 145 99% 21 City of Toronto Total 13 $6,188,300 $476,023 $480,000 20 15 100% 14 Toronto West - - - - 3 2 - - Toronto W01 - - - - - - - - Toronto W02 - - - - - - - - Toronto W03 - - - - - - - - Toronto W04 - - - - - - - - Toronto W05 - - - - - - - - Toronto W06 - - - - - - - - Toronto W07 - - - - - - - - Toronto W08 - - - - - - - - Toronto W09 - - - - - - - - Toronto W10 - - - - 3 2 - - Toronto Central 1 $610,000 $610,000 $610,000 2 1 102% 4 Toronto C01 - - - - - - - - Toronto C02 - - - - - - - - Toronto C03 - - - - - - - - Toronto C04 - - - - - - - - Toronto C06 - - - - - - - - Toronto C07 - - - - 1 1 - - Toronto C08 - - - - - - - - Toronto C09 - - - - - - - - Toronto C10 - - - - - - - - Toronto C11 - - - - - - - - Toronto C12 - - - - - - - - Toronto C13 - - - - - - - - Toronto C14 - - - - - - - - Toronto C15 1 $610,000 $610,000 $610,000 1 - 102% 4 Toronto East 12 $5,578,300 $464,858 $475,000 15 12 99% 14 Toronto E01 - - - - - - - - Toronto E02 - - - - - - - - Toronto E03 - - - - - - - - Toronto E04 - - - - - - - - Toronto E05 3 $1,598,500 $532,833 $530,500 2 1 101% 19 Toronto E06 - - - - - - - - Toronto E07 6 $2,739,800 $456,633 $449,500 5 4 100% 12 Toronto E08 - - - - 2 2 - - Toronto E09 - - - - - 1 - - Toronto E10 - - - - 1 1 - - Toronto E11 3 $1,240,000 $413,333 $470,000 5 3 96% 14 SUMMARY OF EXISTING HOME TRANSACTIONS LINK, JULY 2013
- 17. Industrial Leasing July 2010Page 3 Toronto Real Estate Board Market Watch, July 2013 ALL TREB AREAS Sales 1 Dollar Volume 1 Average Price 1 Median Price 1 New Listings 2 Active Listings 3 Avg. SP/LP 4 Avg. DOM 5 TREB Total 676 $301,287,571 $445,692 $425,000 940 967 99% 22- - - - - - - - Halton Region 111 $50,450,550 $454,509 $410,000 141 141 98% 23 Burlington 8 $3,226,300 $403,288 $408,500 13 18 98% 17 Halton Hills 6 $2,354,300 $392,383 $361,200 10 14 97% 27 Milton 56 $21,270,550 $379,831 $383,675 71 56 98% 20 Oakville 41 $23,599,400 $575,595 $514,900 47 53 98% 28- - - - - - - - Peel Region 123 $47,296,262 $384,522 $373,000 205 239 98% 23 Brampton 75 $26,469,612 $352,928 $346,000 127 162 98% 25 Caledon 8 $2,916,900 $364,613 $358,250 17 16 98% 18 Mississauga 40 $17,909,750 $447,744 $438,750 61 61 99% 20- - - - - - - - City of Toronto 102 $58,915,144 $577,599 $522,000 150 167 99% 26 - - - - - - - - York Region 216 $107,211,525 $496,350 $490,000 309 311 99% 21 Aurora 17 $7,618,999 $448,176 $448,000 20 17 98% 28 E. Gwillimbury 2 $634,650 $317,325 $317,325 3 2 97% 9 Georgina 2 $535,000 $267,500 $267,500 6 6 98% 26 King 4 $2,126,500 $531,625 $535,750 - 3 98% 47 Markham 56 $28,664,596 $511,868 $490,750 83 92 99% 21 Newmarket 19 $7,837,900 $412,521 $409,900 14 6 99% 11 Richmond Hill 67 $35,944,180 $536,480 $538,800 70 75 99% 21 Vaughan 34 $17,644,200 $518,947 $518,250 90 96 99% 18 Whitchurch-Stouffville 15 $6,205,500 $413,700 $411,000 23 14 99% 21- - - - - - - - Durham Region 102 $31,669,290 $310,483 $298,250 109 82 99% 18 Ajax 33 $10,578,030 $320,546 $320,000 34 25 100% 18 Brock - - - - - - - - Clarington 16 $3,901,060 $243,816 $247,490 13 10 99% 19 Oshawa 8 $1,958,100 $244,763 $276,000 8 6 99% 12 Pickering 12 $5,128,950 $427,413 $380,500 18 12 99% 15 Scugog - - - - - - - - Uxbridge 1 $327,000 $327,000 $327,000 4 4 96% 23 Whitby 32 $9,776,150 $305,505 $303,000 32 25 99% 19- - - - - - - - Dufferin County 5 $1,454,900 $290,980 $304,900 3 5 97% 31 Orangeville 5 $1,454,900 $290,980 $304,900 3 5 97% 31- - - - - - - - Simcoe County 17 $4,289,900 $252,347 $250,000 23 22 98% 17 Adjala-Tosorontio - - - - - - - - Bradford West Gwillimbury - - - - 3 4 - - Essa 4 $1,008,000 $252,000 $251,000 5 8 98% 20 Innisfil 4 $998,000 $249,500 $247,500 7 4 98% 17 New Tecumseth 9 $2,283,900 $253,767 $250,000 8 6 98% 16 ! TURN PAGE FOR CITY OF TORONTO TABLES OR CLICK HERE: SUMMARY OF EXISTING HOME TRANSACTIONS ATTACHED/ROW/TOWNHOUSE, JULY 2013 17
- 18. Industrial Leasing July 2010Page 3 Toronto Real Estate Board Market Watch, July 2013 18 CITY OF TORONTO MUNICIPAL BREAKDOWN Sales1 Dollar Volume1 Average Price1 Median Price1 New Listings2 Active Listings3 Avg. SP/LP4 Avg. DOM5 TREB Total 676 $301,287,571 $445,692 $425,000 940 967 99% 22 City of Toronto Total 102 $58,915,144 $577,599 $522,000 150 167 99% 26 Toronto West 27 $15,163,000 $561,593 $517,000 45 50 98% 26 Toronto W01 - - - - - - - - Toronto W02 2 $1,010,000 $505,000 $505,000 7 5 108% 10 Toronto W03 3 $1,224,000 $408,000 $359,000 6 6 97% 20 Toronto W04 5 $2,042,500 $408,500 $402,000 5 5 97% 36 Toronto W05 1 $389,000 $389,000 $389,000 6 8 100% 43 Toronto W06 10 $6,641,500 $664,150 $592,500 9 11 98% 22 Toronto W07 3 $2,089,000 $696,333 $730,000 7 8 99% 21 Toronto W08 2 $1,340,000 $670,000 $670,000 2 4 99% 30 Toronto W09 - - - - 1 1 - - Toronto W10 1 $427,000 $427,000 $427,000 2 2 98% 42 Toronto Central 23 $19,005,250 $826,315 $721,000 43 64 99% 22 Toronto C01 11 $7,180,500 $652,773 $650,500 18 18 101% 13 Toronto C02 3 $4,111,000 $1,370,333 $1,150,000 5 10 98% 20 Toronto C03 - - - - 4 4 - - Toronto C04 1 $800,000 $800,000 $800,000 3 10 94% 95 Toronto C06 - - - - 1 2 - - Toronto C07 1 $645,000 $645,000 $645,000 - - 99% 49 Toronto C08 3 $2,838,750 $946,250 $1,023,750 2 6 94% 32 Toronto C09 - - - - 1 3 - - Toronto C10 - - - - 1 1 - - Toronto C11 - - - - 2 1 - - Toronto C12 - - - - - 1 - - Toronto C13 - - - - 2 2 - - Toronto C14 4 $3,430,000 $857,500 $861,500 4 6 99% 14 Toronto C15 - - - - - - - - Toronto East 52 $24,746,894 $475,902 $459,000 62 53 100% 29 Toronto E01 4 $2,345,700 $586,425 $569,850 13 11 105% 7 Toronto E02 6 $3,533,616 $588,936 $574,680 8 5 101% 16 Toronto E03 3 $2,129,990 $709,997 $725,000 2 4 98% 50 Toronto E04 8 $3,812,800 $476,600 $483,500 5 5 99% 42 Toronto E05 4 $1,778,888 $444,722 $449,500 4 2 100% 10 Toronto E06 - - - - 1 2 - - Toronto E07 4 $1,711,000 $427,750 $418,000 5 3 97% 28 Toronto E08 3 $1,254,900 $418,300 $422,900 6 5 97% 31 Toronto E09 - - - - 1 3 - - Toronto E10 12 $5,412,900 $451,075 $453,500 4 5 99% 41 Toronto E11 8 $2,767,100 $345,888 $307,550 13 8 100% 19 SUMMARY OF EXISTING HOME TRANSACTIONS ATTACHED/ROW/TOWNHOUSE, JULY 2013
- 19. Industrial Leasing July 2010Page 3 Toronto Real Estate Board Market Watch, July 2013 ALL TREB AREAS Sales 1 Dollar Volume 1 Average Price 1 Median Price 1 New Listings 2 Active Listings 3 Avg. SP/LP 4 Avg. DOM 5 TREB Total 11 $3,340,100 $303,645 $180,000 18 30 99% 34- - - - - - - - Halton Region 1 $164,900 $164,900 $164,900 1 1 100% 3 Burlington 1 $164,900 $164,900 $164,900 - - 100% 3 Halton Hills - - - - - - - - Milton - - - - - - - - Oakville - - - - 1 1 - -- - - - - - - - Peel Region - - - - - - - - Brampton - - - - - - - - Caledon - - - - - - - - Mississauga - - - - - - - -- - - - - - - - City of Toronto 10 $3,175,200 $317,520 $275,500 16 28 99% 37 - - - - - - - - York Region - - - - 1 1 - - Aurora - - - - - - - - E. Gwillimbury - - - - - - - - Georgina - - - - - - - - King - - - - - - - - Markham - - - - 1 1 - - Newmarket - - - - - - - - Richmond Hill - - - - - - - - Vaughan - - - - - - - - Whitchurch-Stouffville - - - - - - - -- - - - - - - - Durham Region - - - - - - - - Ajax - - - - - - - - Brock - - - - - - - - Clarington - - - - - - - - Oshawa - - - - - - - - Pickering - - - - - - - - Scugog - - - - - - - - Uxbridge - - - - - - - - Whitby - - - - - - - -- - - - - - - - Dufferin County - - - - - - - - Orangeville - - - - - - - -- - - - - - - - Simcoe County - - - - - - - - Adjala-Tosorontio - - - - - - - - Bradford West Gwillimbury - - - - - - - - Essa - - - - - - - - Innisfil - - - - - - - - New Tecumseth - - - - - - - - SUMMARY OF EXISTING HOME TRANSACTIONS CO-OP APARTMENT, JULY 2013 ! TURN PAGE FOR CITY OF TORONTO TABLES OR CLICK HERE: 19
- 20. Industrial Leasing July 2010Page 3 Toronto Real Estate Board Market Watch, July 2013 20 CITY OF TORONTO MUNICIPAL BREAKDOWN Sales1 Dollar Volume1 Average Price1 Median Price1 New Listings2 Active Listings3 Avg. SP/LP4 Avg. DOM5 TREB Total 11 $3,340,100 $303,645 $180,000 18 30 99% 34 City of Toronto Total 10 $3,175,200 $317,520 $275,500 16 28 99% 37 Toronto West 3 $336,000 $112,000 $96,000 1 4 96% 24 Toronto W01 - - - - - - - - Toronto W02 - - - - - - - - Toronto W03 - - - - - - - - Toronto W04 - - - - - - - - Toronto W05 - - - - - - - - Toronto W06 2 $276,000 $138,000 $138,000 1 2 97% 30 Toronto W07 - - - - - 1 - - Toronto W08 - - - - - - - - Toronto W09 1 $60,000 $60,000 $60,000 - 1 92% 13 Toronto W10 - - - - - - - - Toronto Central 5 $2,646,200 $529,240 $465,000 11 19 100% 24 Toronto C01 - - - - 4 5 - - Toronto C02 - - - - 2 1 - - Toronto C03 - - - - 2 2 - - Toronto C04 - - - - - 1 - - Toronto C06 - - - - - - - - Toronto C07 - - - - - 2 - - Toronto C08 - - - - - - - - Toronto C09 5 $2,646,200 $529,240 $465,000 3 8 100% 24 Toronto C10 - - - - - - - - Toronto C11 - - - - - - - - Toronto C12 - - - - - - - - Toronto C13 - - - - - - - - Toronto C14 - - - - - - - - Toronto C15 - - - - - - - - Toronto East 2 $193,000 $96,500 $96,500 4 5 95% 89 Toronto E01 - - - - - - - - Toronto E02 - - - - - 1 - - Toronto E03 - - - - - - - - Toronto E04 1 $98,000 $98,000 $98,000 3 3 94% 155 Toronto E05 - - - - - - - - Toronto E06 - - - - - - - - Toronto E07 - - - - - - - - Toronto E08 - - - - - - - - Toronto E09 - - - - - - - - Toronto E10 1 $95,000 $95,000 $95,000 1 1 95% 22 Toronto E11 - - - - - - - - SUMMARY OF EXISTING HOME TRANSACTIONS CO-OP APARTMENT, JULY 2013
- 21. Industrial Leasing July 2010Page 3 Toronto Real Estate Board Market Watch, July 2013 ALL TREB AREAS Sales 1 Dollar Volume 1 Average Price 1 Median Price 1 New Listings 2 Active Listings 3 Avg. SP/LP 4 Avg. DOM 5 TREB Total 4 $2,191,000 $547,750 $486,000 12 41 99% 26- - - - - - - - Halton Region - - - - 3 3 - - Burlington - - - - 1 1 - - Halton Hills - - - - 1 1 - - Milton - - - - - - - - Oakville - - - - 1 1 - -- - - - - - - - Peel Region 2 $972,000 $486,000 $486,000 2 3 98% 15 Brampton 1 $509,000 $509,000 $509,000 1 1 99% 5 Caledon - - - - - 1 - - Mississauga 1 $463,000 $463,000 $463,000 1 1 97% 24- - - - - - - - City of Toronto - - - - 1 3 - - - - - - - - - - York Region 1 $829,000 $829,000 $829,000 - - 100% 20 Aurora - - - - - - - - E. Gwillimbury - - - - - - - - Georgina - - - - - - - - King - - - - - - - - Markham 1 $829,000 $829,000 $829,000 - - 100% 20 Newmarket - - - - - - - - Richmond Hill - - - - - - - - Vaughan - - - - - - - - Whitchurch-Stouffville - - - - - - - -- - - - - - - - Durham Region 1 $390,000 $390,000 $390,000 - - 98% 55 Ajax - - - - - - - - Brock - - - - - - - - Clarington - - - - - - - - Oshawa - - - - - - - - Pickering 1 $390,000 $390,000 $390,000 - - 98% 55 Scugog - - - - - - - - Uxbridge - - - - - - - - Whitby - - - - - - - -- - - - - - - - Dufferin County - - - - - - - - Orangeville - - - - - - - -- - - - - - - - Simcoe County - - - - 6 32 - - Adjala-Tosorontio - - - - - - - - Bradford West Gwillimbury - - - - - - - - Essa - - - - - - - - Innisfil - - - - - - - - New Tecumseth - - - - 6 32 - - ! TURN PAGE FOR CITY OF TORONTO TABLES OR CLICK HERE: SUMMARY OF EXISTING HOME TRANSACTIONS DETACHED CONDOMINIUM, JULY 2013 21
- 22. Industrial Leasing July 2010Page 3 Toronto Real Estate Board Market Watch, July 2013 22 CITY OF TORONTO MUNICIPAL BREAKDOWN Sales1 Dollar Volume1 Average Price1 Median Price1 New Listings2 Active Listings3 Avg. SP/LP4 Avg. DOM5 TREB Total 4 $2,191,000 $547,750 $486,000 12 41 99% 26 City of Toronto Total - - - - 1 3 - - Toronto West - - - - - - - - Toronto W01 - - - - - - - - Toronto W02 - - - - - - - - Toronto W03 - - - - - - - - Toronto W04 - - - - - - - - Toronto W05 - - - - - - - - Toronto W06 - - - - - - - - Toronto W07 - - - - - - - - Toronto W08 - - - - - - - - Toronto W09 - - - - - - - - Toronto W10 - - - - - - - - Toronto Central - - - - - 2 - - Toronto C01 - - - - - - - - Toronto C02 - - - - - - - - Toronto C03 - - - - - - - - Toronto C04 - - - - - - - - Toronto C06 - - - - - - - - Toronto C07 - - - - - 1 - - Toronto C08 - - - - - - - - Toronto C09 - - - - - 1 - - Toronto C10 - - - - - - - - Toronto C11 - - - - - - - - Toronto C12 - - - - - - - - Toronto C13 - - - - - - - - Toronto C14 - - - - - - - - Toronto C15 - - - - - - - - Toronto East - - - - 1 1 - - Toronto E01 - - - - - - - - Toronto E02 - - - - - - - - Toronto E03 - - - - - - - - Toronto E04 - - - - - - - - Toronto E05 - - - - - - - - Toronto E06 - - - - - - - - Toronto E07 - - - - - - - - Toronto E08 - - - - 1 - - - Toronto E09 - - - - - - - - Toronto E10 - - - - - 1 - - Toronto E11 - - - - - - - - SUMMARY OF EXISTING HOME TRANSACTIONS DETACHED CONDOMINIUM, JULY 2013
- 23. Industrial Leasing July 2010Page 3 Toronto Real Estate Board Market Watch, July 2013 23 ALL TREB AREAS Sales 1 Dollar Volume 1 Average Price 1 Median Price 1 New Listings 2 Active Listings 3 Avg. SP/LP 4 Avg. DOM 5 TREB Total 9 $2,510,000 $278,889 $312,500 9 19 98% 23- - - - - - - - Halton Region - - - - - - - - Burlington - - - - - - - - Halton Hills - - - - - - - - Milton - - - - - - - - Oakville - - - - - - - -- - - - - - - - Peel Region - - - - - - - - Brampton - - - - - - - - Caledon - - - - - - - - Mississauga - - - - - - - -- - - - - - - - City of Toronto 9 $2,510,000 $278,889 $312,500 9 19 98% 23 - - - - - - - - York Region - - - - - - - - Aurora - - - - - - - - E. Gwillimbury - - - - - - - - Georgina - - - - - - - - King - - - - - - - - Markham - - - - - - - - Newmarket - - - - - - - - Richmond Hill - - - - - - - - Vaughan - - - - - - - - Whitchurch-Stouffville - - - - - - - -- - - - - - - - Durham Region - - - - - - - - Ajax - - - - - - - - Brock - - - - - - - - Clarington - - - - - - - - Oshawa - - - - - - - - Pickering - - - - - - - - Scugog - - - - - - - - Uxbridge - - - - - - - - Whitby - - - - - - - -- - - - - - - - Dufferin County - - - - - - - - Orangeville - - - - - - - -- - - - - - - - Simcoe County - - - - - - - - Adjala-Tosorontio - - - - - - - - Bradford West Gwillimbury - - - - - - - - Essa - - - - - - - - Innisfil - - - - - - - - New Tecumseth - - - - - - - - ! TURN PAGE FOR CITY OF TORONTO TABLES OR CLICK HERE: SUMMARY OF EXISTING HOME TRANSACTIONS CO-OWNERSHIP APARTMENT, JULY 2013
- 24. Industrial Leasing July 2010Page 3 Toronto Real Estate Board Market Watch, July 2013 24 CITY OF TORONTO MUNICIPAL BREAKDOWN Sales1 Dollar Volume1 Average Price1 Median Price1 New Listings2 Active Listings3 Avg. SP/LP4 Avg. DOM5 TREB Total 9 $2,510,000 $278,889 $312,500 9 19 98% 23 City of Toronto Total 9 $2,510,000 $278,889 $312,500 9 19 98% 23 Toronto West 1 $98,500 $98,500 $98,500 2 2 86% 12 Toronto W01 - - - - - - - - Toronto W02 - - - - - - - - Toronto W03 - - - - - - - - Toronto W04 - - - - - - - - Toronto W05 1 $98,500 $98,500 $98,500 2 2 86% 12 Toronto W06 - - - - - - - - Toronto W07 - - - - - - - - Toronto W08 - - - - - - - - Toronto W09 - - - - - - - - Toronto W10 - - - - - - - - Toronto Central 8 $2,411,500 $301,438 $313,250 7 17 99% 24 Toronto C01 - - - - - 1 - - Toronto C02 4 $1,190,500 $297,625 $293,750 2 4 98% 27 Toronto C03 - - - - - 2 - - Toronto C04 1 $322,000 $322,000 $322,000 2 4 98% 31 Toronto C06 - - - - - - - - Toronto C07 - - - - - - - - Toronto C08 1 $314,000 $314,000 $314,000 2 2 100% 19 Toronto C09 - - - - - - - - Toronto C10 1 $314,000 $314,000 $314,000 - 2 100% 23 Toronto C11 - - - - - - - - Toronto C12 - - - - - - - - Toronto C13 1 $271,000 $271,000 $271,000 1 - 99% 14 Toronto C14 - - - - - 2 - - Toronto C15 - - - - - - - - Toronto East - - - - - - - - Toronto E01 - - - - - - - - Toronto E02 - - - - - - - - Toronto E03 - - - - - - - - Toronto E04 - - - - - - - - Toronto E05 - - - - - - - - Toronto E06 - - - - - - - - Toronto E07 - - - - - - - - Toronto E08 - - - - - - - - Toronto E09 - - - - - - - - Toronto E10 - - - - - - - - Toronto E11 - - - - - - - - SUMMARY OF EXISTING HOME TRANSACTIONS CO-OWNERSHIP APARTMENT, JULY 2013
- 25. Industrial Leasing July 2010Page 3 Toronto Real Estate Board Market Watch, July 2013 25 FOCUS ON THE MLS® HOME PRICE INDEX INDEX AND BENCHMARK PRICE, JULY 2013 ALL TREB AREAS Index Benchmark Yr./Yr. % Chg. Index Benchmark Yr./Yr. % Chg. Index Benchmark Yr./Yr. % Chg. Index Benchmark Yr./Yr. % Chg. Index Benchmark Yr./Yr. % Chg. TREB Total 156.0 $475,900 3.38% 156.3 $581,200 3.78% 161.3 $455,700 4.00% 152.6 $334,200 3.04% 149.7 $300,600 1.84% Halton Region 164.4 $539,300 4.91% 161.7 $599,600 4.86% 165.1 $428,500 5.16% 157.4 $311,600 -0.63% - - - Burlington 170.3 $490,800 3.53% 168.7 $576,600 4.07% 166.2 $396,200 3.36% 166.9 $335,200 0.48% - - - Halton Hills 152.3 $443,400 0.99% 151.6 $485,000 0.73% 160.9 $396,300 3.81% 151.7 $273,500 -1.94% - - - Milton 156.4 $438,700 4.20% 145.5 $506,900 2.11% 159.2 $397,500 4.39% - - - - - - Oakville 172.6 $636,700 6.61% 171.8 $712,000 7.38% 174.8 $473,100 6.98% 156.7 $346,100 -0.44% - - - Peel Region 150.9 $412,800 3.29% 151.3 $512,200 2.86% 152.8 $389,900 2.96% 155.3 $321,400 3.53% 140.2 $241,300 3.70% Brampton 143.7 $366,600 2.86% 144.6 $422,600 2.19% 145.7 $343,200 2.53% 138.8 $257,900 5.31% 122.7 $192,000 5.87% Caledon 144.2 $513,800 1.91% 144.9 $531,900 1.40% 154.4 $381,700 3.42% - - - - - - Mississauga 156.9 $438,600 3.77% 160.5 $598,000 3.82% 160.7 $439,200 3.54% 160.3 $344,200 3.15% 143.3 $250,900 3.69% City of Toronto 159.5 $522,700 2.57% 162.7 $705,300 2.97% 170.2 $564,400 3.84% 156.3 $378,000 2.09% 152.3 $314,500 1.67% York Region 164.0 $562,800 3.86% 165.2 $649,000 4.36% 167.5 $485,200 4.43% 153.9 $392,300 3.92% 148.3 $322,200 -0.20% Aurora 157.2 $506,200 5.72% 156.0 $579,600 6.41% 160.4 $415,200 5.04% 143.2 $362,700 4.83% 147.0 $305,400 2.51% E. Gwillimbury 146.1 $472,300 7.58% 146.5 $481,200 7.80% 154.3 $326,700 7.23% - - - - - - Georgina 156.4 $324,600 11.55% 159.7 $329,000 10.75% 157.8 $311,000 12.47% - - - - - - King 152.2 $645,200 1.00% 153.4 $647,300 1.32% - - - - - - - - - Markham 168.0 $578,700 2.31% 171.7 $706,100 2.88% 170.7 $508,400 3.33% 157.9 $392,300 4.43% 151.4 $350,100 -2.82% Newmarket 149.4 $440,600 4.92% 146.6 $493,500 5.32% 155.2 $365,800 4.72% 160.4 $323,900 4.97% 149.9 $252,400 0.13% Richmond Hill 171.3 $620,200 3.19% 179.8 $761,800 3.87% 176.9 $535,900 4.43% 143.7 $406,300 0.70% 147.3 $306,800 -0.74% Vaughan 163.2 $589,900 5.09% 160.2 $666,700 5.05% 167.5 $509,900 6.08% 158.0 $431,700 5.26% 145.7 $323,300 3.48% Whitchurch-Stouffville 162.2 $611,500 4.38% 162.3 $622,800 5.18% 146.1 $401,300 1.39% - - - - - - Durham Region 137.8 $324,200 5.43% 137.6 $358,800 5.52% 142.8 $286,000 6.41% 128.0 $210,400 5.70% 129.4 $231,500 3.77% Ajax 143.2 $353,900 5.84% 144.6 $387,300 5.93% 150.1 $322,800 5.70% 128.6 $235,000 7.26% 126.0 $213,900 3.87% Brock 127.0 $240,800 2.75% 127.4 $242,100 2.74% 134.3 $214,000 0.22% - - - - - - Clarington 135.5 $286,700 7.71% 132.8 $319,200 8.23% 138.4 $264,300 7.45% 149.1 $266,900 3.61% 127.6 $180,600 3.07% Oshawa 133.6 $255,700 7.74% 132.5 $282,100 7.81% 138.5 $231,900 8.63% 115.3 $154,300 3.59% 133.6 $159,900 -0.15% Pickering 143.5 $388,200 6.06% 144.8 $453,000 5.08% 149.1 $347,500 5.82% 134.8 $243,200 5.89% 131.2 $256,900 7.89% Scugog 138.0 $358,100 1.40% 141.8 $365,100 1.50% 125.4 $262,400 2.45% - - - - - - Uxbridge 136.7 $418,000 5.15% 137.9 $427,100 4.95% 132.6 $325,400 3.92% - - - - - - Whitby 136.6 $356,400 2.02% 137.4 $394,700 2.77% 139.9 $308,600 4.72% 133.6 $244,900 8.88% 129.6 $252,800 -1.14% Dufferin County 146.1 $334,800 3.54% 149.8 $341,300 2.96% 146.6 $274,800 2.52% - - - - - - Orangeville 146.1 $334,800 3.54% 149.8 $341,300 2.96% 146.6 $274,800 2.52% - - - - - - Simcoe County 143.3 $304,500 5.99% 140.5 $309,900 6.12% 146.5 $281,300 3.75% - - - - - - Adjala-Tosorontio 126.7 $399,000 -1.09% 126.7 $399,500 -0.94% - - - - - - - - - Bradford West Gwillimbury 154.3 $383,500 3.00% 140.0 $428,800 3.09% 159.5 $331,600 2.84% - - - - - - Essa 140.6 $318,800 4.46% 137.4 $339,900 3.08% 142.8 $243,300 4.54% - - - - - - Innisfil 145.6 $269,800 8.25% 146.7 $272,300 8.67% 148.2 $230,500 4.00% - - - - - - New Tecumseth 129.8 $299,800 3.84% 127.2 $327,600 3.33% 134.5 $257,300 4.26% - - - - - - Townhouse Apartment ! TURN PAGE FOR CITY OF TORONTO TABLES OR CLICK HERE: Composite Single-Family Detached Single-Family Attached CLICK HERE FOR MORE BACKGROUND INFORMATION ON THE MLS® HPI
- 26. Industrial Leasing July 2010Page 3 Toronto Real Estate Board Market Watch, July 2013 26 FOCUS ON THE MLS® HOME PRICE INDEX INDEX AND BENCHMARK PRICE, JULY 2013 CITY OF TORONTO Index Benchmark Yr./Yr. % Chg. Index Benchmark Yr./Yr. % Chg. Index Benchmark Yr./Yr. % Chg. Index Benchmark Yr./Yr. % Chg. Index Benchmark Yr./Yr. % Chg. TREB Total 156.0 $475,900 3.38% 156.3 $581,200 3.78% 161.3 $455,700 4.00% 152.6 $334,200 3.04% 149.7 $300,600 1.84% City of Toronto 159.5 $522,700 2.57% 162.7 $705,300 2.97% 170.2 $564,400 3.84% 156.3 $378,000 2.09% 152.3 $314,500 1.67% Toronto W01 166.2 $678,200 1.65% 165.9 $855,100 3.24% 178.1 $687,200 5.32% 217.2 $447,200 6.05% 142.6 $332,700 -3.52% Toronto W02 183.2 $660,800 5.35% 182.5 $749,100 5.25% 205.5 $629,500 6.15% 141.2 $389,300 4.59% 125.9 $523,300 6.97% Toronto W03 163.5 $422,300 6.10% 165.6 $450,400 6.91% 169.0 $433,000 7.30% - - - 130.6 $242,200 -2.25% Toronto W04 143.7 $376,300 4.28% 150.5 $474,900 4.30% 145.1 $422,500 4.46% 145.9 $355,000 5.34% 127.7 $188,100 2.74% Toronto W05 140.4 $334,300 5.17% 148.1 $493,700 5.11% 139.0 $406,500 4.28% 134.4 $221,300 4.59% 134.0 $176,000 7.80% Toronto W06 149.1 $432,800 1.22% 172.0 $545,900 4.05% 154.2 $467,500 0.13% 156.1 $459,900 1.83% 127.9 $316,400 -1.69% Toronto W07 154.4 $658,000 3.21% 162.1 $700,600 2.47% 155.4 $637,200 0.78% 122.3 $449,600 -3.62% 102.9 $417,300 -2.74% Toronto W08 140.5 $571,600 0.64% 151.3 $791,400 1.00% 159.7 $599,900 1.78% 135.4 $331,000 0.15% 127.1 $255,900 -0.55% Toronto W09 143.3 $368,300 6.23% 155.8 $582,900 1.96% 141.4 $400,300 4.28% 146.4 $371,400 2.52% 124.0 $159,000 14.29% Toronto W10 138.8 $322,200 3.27% 149.5 $439,900 3.75% 147.3 $400,200 3.01% 121.9 $219,600 8.16% 125.7 $191,900 0.96% Toronto C01 181.0 $448,900 1.29% 196.0 $691,900 0.56% 201.0 $697,400 3.18% 169.8 $509,600 -4.01% 178.0 $370,500 1.02% Toronto C02 169.6 $805,300 -0.06% 158.7 $1,257,900 0.95% 182.2 $958,700 5.62% 168.1 $786,100 -5.14% 163.4 $455,700 -3.77% Toronto C03 173.7 $894,000 7.96% 168.9 $1,017,900 7.17% 180.3 $667,500 10.21% - - - 180.1 $475,800 7.14% Toronto C04 158.6 $982,600 1.80% 163.5 $1,142,900 4.21% 163.0 $779,300 4.15% 151.4 $565,600 1.07% 136.7 $325,000 -9.65% Toronto C06 166.2 $657,700 3.62% 170.2 $728,500 3.97% 151.4 $556,800 0.20% 140.1 $382,300 2.79% 162.3 $358,900 4.11% Toronto C07 157.1 $539,600 2.01% 174.6 $799,300 2.71% 155.4 $552,300 -0.58% 132.7 $389,500 2.87% 146.9 $346,000 0.75% Toronto C08 163.1 $419,900 -1.39% 157.8 $490,400 -2.65% 160.1 $662,700 -1.36% 183.9 $557,700 11.12% 163.1 $359,800 -1.92% Toronto C09 128.9 $957,200 -8.52% 119.5 $1,501,100 -4.02% 138.0 $1,123,000 -1.43% 152.0 $784,600 -7.99% 135.7 $449,600 -5.17% Toronto C10 179.7 $701,000 5.46% 162.4 $996,600 3.90% 168.0 $829,700 2.63% 215.3 $493,700 -2.84% 185.5 $444,500 7.72% Toronto C11 145.2 $520,300 4.09% 150.2 $1,005,600 -0.20% 168.9 $741,100 5.36% 111.6 $178,000 -5.74% 139.3 $198,300 13.44% Toronto C12 150.9 $1,293,200 0.00% 144.8 $1,556,200 0.00% 168.3 $727,200 6.93% 144.0 $487,800 -0.89% 173.6 $546,000 2.12% Toronto C13 149.8 $552,600 2.67% 159.4 $854,100 2.84% 148.3 $475,800 -2.11% 138.4 $394,100 -19.72% 140.9 $278,800 4.45% Toronto C14 165.7 $563,100 3.05% 182.4 $989,600 2.82% 176.9 $863,000 -1.61% 203.9 $689,000 8.98% 156.7 $394,100 2.75% Toronto C15 155.5 $519,900 1.44% 173.9 $815,200 0.46% 162.3 $529,600 2.79% 163.5 $402,800 -1.21% 134.3 $313,900 3.15% Toronto E01 184.2 $572,100 2.73% 177.5 $598,000 -0.78% 188.5 $591,400 5.13% 217.3 $439,400 14.91% 178.3 $422,900 -3.31% Toronto E02 170.1 $632,700 2.16% 160.5 $706,900 -0.86% 177.9 $593,300 3.25% 171.7 $574,000 11.93% 166.3 $440,100 -1.66% Toronto E03 156.8 $483,000 -2.24% 157.7 $529,800 -4.25% 160.4 $522,300 4.84% - - - 131.0 $195,900 -7.22% Toronto E04 157.0 $394,100 5.16% 163.0 $481,300 4.49% 158.9 $385,500 3.25% 161.2 $348,400 3.67% 153.7 $232,800 9.86% Toronto E05 150.6 $402,700 4.80% 166.9 $589,300 6.31% 163.8 $451,500 5.47% 153.5 $333,700 5.50% 131.2 $257,800 1.78% Toronto E06 171.9 $485,800 1.90% 172.2 $492,200 1.53% 182.3 $431,200 6.67% - - - 152.4 $336,000 -0.85% Toronto E07 161.1 $397,100 7.33% 170.7 $558,700 8.38% 164.1 $428,900 3.86% 162.3 $350,900 5.73% 148.7 $254,600 13.17% Toronto E08 151.4 $371,000 2.09% 163.5 $510,400 1.30% 156.5 $400,500 1.76% 156.1 $316,000 4.00% 123.7 $197,500 1.14% Toronto E09 147.9 $357,100 5.57% 159.3 $453,400 7.20% 150.4 $369,100 4.23% 140.1 $258,200 5.90% 136.0 $255,100 3.19% Toronto E10 156.1 $441,900 4.69% 157.9 $505,500 3.68% 158.5 $412,300 4.07% 155.7 $272,700 10.50% 117.8 $189,900 15.94% Toronto E11 144.9 $319,400 4.02% 161.3 $447,900 5.42% 155.0 $351,700 6.38% 114.8 $225,600 2.78% 121.7 $181,600 0.16% ApartmentComposite Single-Family Detached Single-Family Attached Townhouse CLICK HERE FOR MORE BACKGROUND INFORMATION ON THE MLS® HPI
- 27. July 2010Page 3 Toronto Real Estate Board Market Watch, July 2013 27 YEAR SALES AVERAGE PRICE 2002 74,759 $275,231 2003 78,898 $293,067 2004 83,501 $315,231 2005 84,145 $335,907 2006 83,084 $351,941 2007 93,193 $376,236 2008 74,552 $379,347 2009 87,308 $395,460 2010 85,545 $431,276 2011 89,096 $465,014 2012 85,502 $497,143 January 4,431 $462,701 February 6,809 $500,249 March 9,384 $500,895 April 10,021 $515,888 May 10,544 $514,567 June 9,129 $507,342 July 7,338 $475,523 August 6,249 $477,170 September 5,687 $501,326 October 6,713 $502,127 November 5,615 $484,186 December 3,582 $477,756 Annual 85,502 $497,143 January 4,229 $482,080 February 5,614 $509,389 March 7,543 $517,382 April 9,545 $525,339 May 9,969 $540,816 June 8,893 $530,636 July 8,544 $513,246 August - - September - - October - - November - - December - - Year-to-Date 54,337 $521,025 HISTORIC ANNUAL STATISTICS1,6,7 2013 MONTHLY STATISTICS1,7 2012 MONTHLY STATISTICS1,7 *For historic annual sales and average price data over a longer time frame go to: http://www.torontorealestateboard.com/market_news/market_watch/histori c_stats/pdf/TREB_historic_statistics.pdf NOTES 8 SNLR = Sales-to-New Listings Ratio. Calculated using a 12-month moving average (sales/new listings). 9 Mos. Inv. = Months of Inventory. Calculated using a 12-month moving average (active listings/sales). 7 Past monthly and year-to-date figures are revised on a monthly basis. 1 Sales, dollar volume, average sale prices and median sale prices are based on firm transactions entered into the TorontoMLS® system between the first and last day of the month/period being reported. 2 New listings entered into the TorontoMLS® system between the first and last day of the month/period being reported. 3 Active listings at the end of the last day of the month/period being reported. 4 Ratio of the average selling price to the average listing price for firm transactions entered into the TorontoMLS® system between the first and last day of the month/period being reported. 5 Average number of days on the market for firm transactions entered into the TorontoMLS® system between the first and last day of the month/period being reported. 6 Due to past changes to TREB's service area, caution should be exercised when making historical comparisons.