Market Watch Toronto JUNE 2014
•
0 j'aime•398 vues

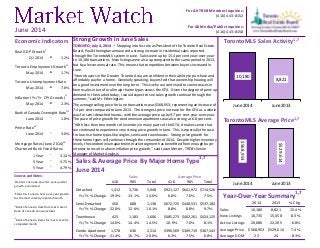
A strong increase in residential sales reported through the TorontoMLS system in June. Sales were up by 15.4 per cent year-over-year to 10,180 transactions. New listings were also up compared to the same period in 2013, but by a lesser annual rate. This means that competition between buyers increased in June.

Recommandé
Contenu connexe
Plus de Chaba Tamasi
Plus de Chaba Tamasi (20)
Dernier
Dernier (20)
Market Watch Toronto JUNE 2014
- 1. Strong Growth in June Sales TORONTO, July 4, 2014 – Stepping into his role as President of the Toronto Real Estate Board, Paul Etherington announced a strong increase in residential sales reported through the TorontoMLS system in June. Sales were up by 15.4 per cent year-over-year to 10,180 transactions. New listings were also up compared to the same period in 2013, but by a lesser annual rate. This means that competition between buyers increased in June. “Home buyers in the Greater Toronto Area are confident in their ability to purchase and affordably pay for a home. Generally speaking, buyers feel that ownership housing will be a good investment over the long term. This is why we continued to see increases in home sales in June for all major home types across the GTA. Given the degree of pent-up demand in the market today, I would expect to see sales growth continue through the summer,” said Mr. Etherington. The average selling price for June transactions was $568,953, representing an increase of 7.4 per cent compared to June 2013. The strongest price increase for the GTA as a whole was for semi-detached houses, with the average price up by 9.7 per cent year-over-year. The pace of price growth for condominium apartments was also strong at 6.8 per cent. “With less than two months of inventory in many parts of the GTA, it makes sense that we continued to experience very strong price growth in June. This is especially the case for low-rise home types like singles, semis and townhouses. Strong price growth for these home types will continue through the remainder of 2014. Despite higher inventory levels, the condominium apartment market segment has benefitted from enough buyer interest to result in above-inflation price growth,” said Jason Mercer, TREB’s Senior Manager of Market Analysis. 10,180 8,821 June2014 June2013 $568,953 $529,614 June2014 June2013 For All TREB Member Inquiries: (416) 443-8152 For All Media/Public Inquiries: (416) 443-8158June 2014 Real GDP Growthi Q1 2014 t 1.2% Toronto Employment Growthii May 2014 t 1.7% Toronto Unemployment Rate May 2014 t 7.6% Inflation (Yr./Yr. CPI Growth)ii May 2014 t 2.3% Bank of Canada Overnight Rateiii June 2014 q 1.0% Prime Rate iv June 2014 q 3.0% Mortgage Rates (June 2014) iv Chartered Bank Fixed Rates 1 Year q 3.14% 3 Year q 3.75% 5 Year q 4.79% Sources and Notes: Economic Indicators i Statistics Canada, Quarter-over-quarter growth, annualized ii Statistics Canada, Year-over-year growth for the most recently reported month iii Bank of Canada, Rate from most recent Bank of Canada announcement iv Bank of Canada, Rates for most recently completed month Sales & Average Price By Major Home Type1,7 416 905 Total 416 905 Total Detached 1,312 3,736 5,048 $921,127 $641,972 $714,526 Yr./Yr. % Change 19.3% 13.1% 14.6% 6.0% 7.6% 7.5% Semi-Detached 450 688 1,138 $672,725 $448,531 $537,184 Yr./Yr. % Change 22.0% 12.6% 16.1% 8.8% 8.8% 9.7% Townhouse 423 1,183 1,606 $485,273 $402,261 $424,125 Yr./Yr. % Change 14.6% 14.4% 14.5% 10.9% 7.0% 8.1% Condo Apartment 1,578 636 2,214 $390,569 $309,719 $367,343 Yr./Yr. % Change 21.4% 16.7% 20.0% 6.3% 7.5% 6.8% June 2014 Sales Average Price 2014 2013 % Chg. Sales 10,180 8,821 15.4% New Listings 16,735 15,458 8.3% Active Listings 20,686 22,205 -6.8% Average Price $568,953 $529,614 7.4% Average DOM 22 24 -8.3% Year-Over-Year Summary 1,7 TorontoMLS Sales Activity1,7 TorontoMLS Average Price1,7
- 2. Price Range Detached Semi-Detached Att/Row/Twnhouse Condo Townhouse Condo Apt Link Co-op Apt Det Condo Co-ownership Apt Total $0 to $99,999 3 0 0 2 5 0 1 0 1 12 $100,000 to $199,999 32 6 1 39 206 0 4 0 1 289 $200,000 to $299,999 173 43 51 195 697 24 3 0 3 1,189 $300,000 to $399,999 536 160 225 328 683 32 2 4 1 1,971 $400,000 to $499,999 820 377 236 171 306 29 2 3 0 1,944 $500,000 to $599,999 886 266 131 46 142 11 0 1 0 1,483 $600,000 to $699,999 784 123 70 21 77 38 0 0 0 1,113 $700,000 to $799,999 481 49 40 9 38 13 1 0 0 631 $800,000 to $899,999 408 57 11 6 12 0 0 0 0 494 $900,000 to $999,999 229 30 4 5 11 0 0 0 0 279 $1,000,000 to $1,249,999 296 16 8 3 19 0 0 0 0 342 $1,250,000 to $1,499,999 174 3 1 0 7 0 0 0 0 185 $1,500,000 to $1,749,999 57 3 1 0 4 0 0 0 0 65 $1,750,000 to $1,999,999 55 3 0 0 3 0 0 0 0 61 $2,000,000 + 114 2 1 1 4 0 0 0 0 122 Total Sales 5,048 1,138 780 826 2,214 147 13 8 6 10,180 Share of Total Sales 49.6% 11.2% 7.7% 8.1% 21.7% 1.4% 0.1% 0.1% 0.1% - Average Price $714,526 $537,184 $479,157 $372,157 $367,343 $480,890 $302,069 $422,750 $210,200 $568,953 Price Range Detached Semi-Detached Att/Row/Twnhouse Condo Townhouse Condo Apt Link Co-op Apt Det Condo Co-ownership Apt Total $0 to $99,999 9 0 1 12 56 0 2 0 3 83 $100,000 to $199,999 178 16 5 192 1,095 0 16 0 7 1,509 $200,000 to $299,999 948 255 274 921 3,507 108 13 6 17 6,049 $300,000 to $399,999 2,507 974 1,124 1,314 3,353 152 6 16 7 9,453 $400,000 to $499,999 3,907 1,627 1,203 744 1,527 136 10 9 0 9,163 $500,000 to $599,999 4,138 1,140 701 216 686 156 3 5 1 7,046 $600,000 to $699,999 3,482 518 338 88 354 155 4 3 0 4,942 $700,000 to $799,999 2,442 237 163 67 159 41 1 2 0 3,112 $800,000 to $899,999 1,834 184 63 23 56 8 1 0 0 2,169 $900,000 to $999,999 1,159 112 34 18 53 0 2 0 0 1,378 $1,000,000 to $1,249,999 1,441 71 35 16 66 1 1 1 0 1,632 $1,250,000 to $1,499,999 788 33 10 4 37 0 0 0 0 872 $1,500,000 to $1,749,999 406 20 4 4 18 0 0 0 0 452 $1,750,000 to $1,999,999 257 6 1 1 12 0 0 0 0 277 $2,000,000 + 575 16 1 2 27 0 0 0 0 621 Total Sales 24,071 5,209 3,957 3,622 11,006 757 59 42 35 48,758 Share of Total Sales 49.4% 10.7% 8.1% 7.4% 22.6% 1.6% 0.1% 0.1% 0.1% - Average Price $718,679 $526,114 $474,827 $374,313 $360,629 $486,512 $358,026 $441,226 $241,151 $567,291 SALES BY PRICE RANGE AND HOUSE TYPE1,7 JUNE 2014 SALES BY PRICE RANGE AND HOUSE TYPE1,7 YEAR-TO-DATE, 2014 Market Watch, June 2014 2 Toronto Real Estate Board
- 3. ALL HOME TYPES, JUNE 2014 ALL TREB AREAS Number of Sales Dollar Volume 1 Average Price 1 Median Price 1 New Listings 2 SNLR (Trend) 8 Active Listings 3 Mos. Inv. (Trend)9 Avg. SP/LP 4 Avg. DOM 5 TREB Total 10,180 $5,791,944,008 $568,953 $480,000 16,735 58.3% 20,686 2.3 100% 22 Halton Region 885 $551,726,724 $623,420 $538,100 1,303 64.3% 1,671 2.2 98% 24 Burlington 179 $101,722,419 $568,282 $497,000 272 64.7% 389 2.4 98% 31 Halton Hills 114 $56,050,861 $491,674 $473,750 156 66.5% 208 2.3 98% 21 Milton 263 $127,810,790 $485,973 $455,000 363 66.3% 364 1.6 99% 18 Oakville 329 $266,142,654 $808,944 $690,000 512 62.0% 710 2.4 98% 26 Peel Region 2,185 $1,067,577,381 $488,594 $448,500 3,641 56.1% 4,244 2.4 98% 21 Brampton 951 $432,380,170 $454,658 $429,900 1,501 57.0% 1,576 2.2 98% 21 Caledon 106 $64,503,140 $608,520 $571,000 202 50.7% 337 4.0 97% 28 Mississauga 1,128 $570,694,071 $505,934 $469,900 1,938 55.9% 2,331 2.4 98% 20 City of Toronto 3,795 $2,344,757,716 $617,854 $493,000 6,521 55.6% 8,267 2.5 101% 21 York Region 1,826 $1,241,108,463 $679,687 $620,000 3,133 58.7% 3,891 2.3 99% 21 Aurora 102 $74,949,176 $734,796 $607,950 129 65.9% 165 2.2 98% 22 E. Gwillimbury 31 $16,938,400 $546,400 $481,000 67 66.1% 95 2.9 98% 28 Georgina 109 $43,515,594 $399,226 $370,000 152 65.2% 211 2.4 98% 23 King 34 $29,794,738 $876,316 $788,000 89 40.5% 193 6.4 97% 39 Markham 510 $363,155,624 $712,070 $669,250 864 61.5% 894 1.9 100% 19 Newmarket 167 $86,489,476 $517,901 $505,000 260 70.1% 232 1.4 99% 18 Richmond Hill 389 $293,922,276 $755,584 $700,000 702 55.5% 846 2.3 100% 20 Vaughan 386 $269,453,792 $698,067 $650,000 729 54.2% 1,032 2.5 98% 20 Whitchurch-Stouffville 98 $62,889,387 $641,728 $576,250 141 57.8% 223 3.0 98% 28 Durham Region 1,175 $464,768,920 $395,548 $370,000 1,651 68.1% 1,677 1.6 99% 20 Ajax 236 $103,054,538 $436,672 $415,000 285 72.8% 203 1.2 99% 17 Brock 24 $6,426,500 $267,771 $273,000 36 54.3% 98 5.5 97% 48 Clarington 173 $59,827,752 $345,825 $325,000 279 66.9% 303 1.7 99% 22 Oshawa 287 $91,352,124 $318,300 $307,000 416 68.9% 362 1.3 99% 17 Pickering 161 $74,605,938 $463,391 $432,000 202 67.6% 193 1.6 100% 18 Scugog 48 $21,425,715 $446,369 $418,000 84 54.1% 144 3.8 98% 32 Uxbridge 42 $21,994,300 $523,674 $460,000 61 60.7% 128 4.3 98% 43 Whitby 204 $86,082,053 $421,971 $393,750 288 70.2% 246 1.3 100% 15 Dufferin County 65 $24,073,525 $370,362 $345,000 93 65.9% 177 2.8 98% 35 Orangeville 65 $24,073,525 $370,362 $345,000 93 65.9% 177 2.8 98% 35 Simcoe County 249 $97,931,279 $393,298 $364,900 393 60.4% 759 3.4 97% 37 Adjala-Tosorontio 10 $3,861,700 $386,170 $379,950 31 51.8% 90 5.7 97% 45 Bradford West Gwillimbury 71 $34,145,440 $480,922 $460,000 96 60.0% 147 2.7 98% 34 Essa 33 $10,829,701 $328,173 $310,000 37 67.9% 84 3.0 98% 39 Innisfil 76 $28,070,338 $369,347 $329,950 125 55.2% 234 4.0 96% 34 New Tecumseth 59 $21,024,100 $356,341 $352,000 104 65.6% 204 3.3 98% 41 SUMMARY OF EXISTING HOME TRANSACTIONS ! TURN PAGE FOR CITY OF TORONTO TABLES OR CLICK HERE: Market Watch, June 2014 3 Toronto Real Estate Board
- 4. Market Watch, June 2014 July 2010Page 3 4 Toronto Real Estate Board ALL HOME TYPES, JUNE 2014 CITY OF TORONTO MUNICIPAL BREAKDOWN Number of Sales Dollar Volume 1 Average Price 1 Median Price 1 New Listings 2 SNLR (Trend) 8 Active Listings 3 Mos. Inv. (Trend)9 Avg. SP/LP 4 Avg. DOM 5 TREB Total 10,180 $5,791,944,008 $568,953 $480,000 16,735 58.3% 20,686 2.3 100% 22 City of Toronto Total 3,795 $2,344,757,716 $617,854 $493,000 6,521 55.6% 8,267 2.5 101% 21 Toronto West 971 $531,899,417 $547,785 $483,000 1,657 57.3% 2,169 2.4 101% 23 Toronto W01 52 $39,740,832 $764,247 $732,500 110 51.2% 151 2.7 105% 18 Toronto W02 100 $68,429,829 $684,298 $655,000 149 68.0% 118 1.3 107% 12 Toronto W03 74 $35,356,742 $477,794 $479,000 118 64.7% 119 1.5 101% 20 Toronto W04 93 $36,897,743 $396,750 $396,000 122 66.9% 149 1.9 100% 21 Toronto W05 129 $49,915,973 $386,946 $430,000 203 58.5% 301 2.7 98% 30 Toronto W06 133 $71,479,739 $537,442 $492,000 265 47.6% 447 3.7 100% 32 Toronto W07 38 $32,012,400 $842,432 $777,000 44 74.6% 32 1.3 104% 11 Toronto W08 198 $133,141,721 $672,433 $530,000 374 53.2% 517 2.7 99% 24 Toronto W09 60 $30,812,188 $513,536 $555,000 91 59.4% 123 2.4 101% 23 Toronto W10 94 $34,112,250 $362,896 $401,000 181 56.8% 212 2.6 98% 25 Toronto Central 1,721 $1,249,570,296 $726,072 $500,000 3,204 49.6% 4,680 3.0 100% 24 Toronto C01 432 $214,267,923 $495,991 $411,000 962 43.0% 1,630 3.8 100% 27 Toronto C02 91 $98,138,231 $1,078,442 $860,000 176 48.6% 261 3.7 101% 22 Toronto C03 65 $82,343,518 $1,266,823 $870,000 101 58.0% 125 2.3 100% 23 Toronto C04 112 $148,249,227 $1,323,654 $1,200,000 204 53.2% 218 2.4 101% 16 Toronto C06 27 $16,611,050 $615,224 $730,000 68 47.3% 108 3.4 101% 20 Toronto C07 118 $74,134,058 $628,255 $461,000 228 48.9% 367 3.1 98% 26 Toronto C08 190 $89,802,714 $472,646 $420,000 276 54.4% 380 2.7 99% 24 Toronto C09 31 $48,292,600 $1,557,826 $1,258,000 54 54.0% 102 2.8 99% 19 Toronto C10 89 $71,881,078 $807,653 $720,000 117 61.8% 123 1.8 102% 18 Toronto C11 59 $52,836,184 $895,529 $810,000 68 68.4% 56 1.5 101% 15 Toronto C12 48 $76,469,062 $1,593,105 $1,267,500 77 47.0% 147 4.2 98% 30 Toronto C13 81 $59,490,674 $734,453 $485,000 129 65.2% 117 1.7 103% 18 Toronto C14 198 $116,216,214 $586,951 $425,000 409 44.8% 654 3.5 98% 31 Toronto C15 180 $100,837,763 $560,210 $450,500 335 54.5% 392 2.4 100% 22 Toronto East 1,103 $563,288,004 $510,687 $495,000 1,660 66.1% 1,418 1.6 103% 16 Toronto E01 99 $65,934,238 $666,002 $635,000 126 67.4% 90 1.3 105% 11 Toronto E02 88 $64,816,489 $736,551 $652,450 132 65.5% 103 1.3 104% 10 Toronto E03 115 $70,937,089 $616,844 $600,000 153 66.8% 98 1.2 105% 10 Toronto E04 142 $61,936,965 $436,176 $466,500 188 70.0% 169 1.5 102% 20 Toronto E05 123 $59,650,356 $484,962 $426,000 179 71.8% 118 1.3 103% 13 Toronto E06 43 $24,021,600 $558,642 $501,100 79 57.9% 70 1.6 101% 16 Toronto E07 101 $48,138,186 $476,616 $445,000 176 65.5% 174 1.8 102% 22 Toronto E08 72 $33,125,899 $460,082 $442,500 116 64.6% 110 1.9 98% 21 Toronto E09 143 $54,556,001 $381,510 $355,000 234 61.9% 240 2.0 101% 20 Toronto E10 77 $40,857,654 $530,619 $495,000 124 63.7% 108 1.9 103% 16 Toronto E11 100 $39,313,527 $393,135 $377,500 153 68.7% 138 1.6 101% 20 SUMMARY OF EXISTING HOME TRANSACTIONS
- 5. ALL HOME TYPES, YEAR-TO-DATE 2014 ALL TREB AREAS Number of Sales Dollar Volume 1 Average Price 1 Median Price 1 New Listings 2 Avg. SP/LP 4 Avg. DOM 5 TREB Total 48,758 $27,659,968,581 $567,291 $476,000 87,160 99% 23 Halton Region 4,271 $2,680,006,428 $627,489 $535,000 6,972 98% 24 Burlington 804 $447,556,650 $556,663 $495,000 1,296 98% 29 Halton Hills 558 $279,142,539 $500,255 $470,000 884 98% 23 Milton 1,215 $596,234,286 $490,728 $458,000 1,957 99% 19 Oakville 1,694 $1,357,072,952 $801,106 $689,750 2,835 98% 24 Peel Region 10,310 $4,969,055,661 $481,965 $440,000 18,617 98% 23 Brampton 4,449 $1,955,825,977 $439,610 $418,000 7,707 98% 23 Caledon 464 $281,325,130 $606,304 $555,000 931 97% 35 Mississauga 5,397 $2,731,904,554 $506,189 $460,500 9,979 98% 22 City of Toronto 18,025 $11,164,261,269 $619,376 $489,000 34,062 101% 23 York Region 9,015 $6,079,995,323 $674,431 $615,000 16,207 99% 21 Aurora 517 $335,088,812 $648,141 $581,000 791 98% 20 E. Gwillimbury 191 $110,024,042 $576,042 $489,000 297 97% 39 Georgina 468 $169,928,098 $363,094 $350,000 754 98% 27 King 165 $151,322,328 $917,105 $825,000 433 96% 44 Markham 2,493 $1,745,131,942 $700,013 $645,000 4,268 100% 19 Newmarket 816 $427,386,924 $523,758 $501,750 1,229 99% 20 Richmond Hill 1,873 $1,421,445,990 $758,914 $700,000 3,599 100% 19 Vaughan 2,051 $1,442,199,355 $703,169 $650,000 4,050 98% 21 Whitchurch-Stouffville 441 $277,467,834 $629,179 $565,000 786 98% 27 Durham Region 5,686 $2,209,035,726 $388,504 $362,000 8,690 99% 20 Ajax 1,077 $452,924,311 $420,543 $395,300 1,525 99% 16 Brock 104 $30,259,163 $290,953 $257,000 200 96% 57 Clarington 920 $308,928,854 $335,792 $317,000 1,443 99% 20 Oshawa 1,378 $422,734,354 $306,774 $287,250 2,138 99% 17 Pickering 718 $334,498,282 $465,875 $434,500 1,073 99% 20 Scugog 172 $72,484,729 $421,423 $397,450 337 98% 39 Uxbridge 185 $99,868,350 $539,829 $480,000 316 97% 42 Whitby 1,132 $487,337,683 $430,510 $398,500 1,658 99% 16 Dufferin County 301 $109,150,475 $362,626 $342,000 506 98% 35 Orangeville 301 $109,150,475 $362,626 $342,000 506 98% 35 Simcoe County 1,150 $448,463,700 $389,968 $360,250 2,106 98% 39 Adjala-Tosorontio 72 $31,753,350 $441,019 $385,000 155 97% 63 Bradford West Gwillimbury 316 $145,301,084 $459,814 $444,722 575 98% 29 Essa 179 $58,972,606 $329,456 $297,500 278 98% 37 Innisfil 278 $104,395,066 $375,522 $336,000 572 97% 40 New Tecumseth 305 $108,041,594 $354,235 $334,000 526 97% 45 ! TURN PAGE FOR CITY OF TORONTO TABLES OR CLICK HERE: SUMMARY OF EXISTING HOME TRANSACTIONS Market Watch, June 2014 July 2010Page 3 5 Toronto Real Estate Board
- 6. Market Watch, June 2014 July 2010Page 3 6 Toronto Real Estate Board ALL HOME TYPES, YEAR-TO-DATE 2014 CITY OF TORONTO MUNICIPAL BREAKDOWN Number of Sales Dollar Volume 1 Average Price 1 Median Price 1 New Listings 2 Avg. SP/LP 4 Avg. DOM 5 TREB Total 48,758 $27,659,968,581 $567,291 $476,000 87,160 99% 23 City of Toronto Total 18,025 $11,164,261,269 $619,376 $489,000 34,062 101% 23 Toronto West 4,467 $2,399,690,559 $537,204 $475,000 8,393 101% 24 Toronto W01 282 $185,692,121 $658,483 $575,500 552 103% 23 Toronto W02 448 $308,003,569 $687,508 $650,500 679 105% 15 Toronto W03 352 $169,316,040 $481,011 $485,000 609 103% 17 Toronto W04 396 $170,668,362 $430,981 $436,000 653 100% 22 Toronto W05 594 $236,726,146 $398,529 $425,000 1,049 98% 31 Toronto W06 590 $290,002,293 $491,529 $468,950 1,440 100% 31 Toronto W07 169 $141,664,875 $838,254 $807,000 226 103% 14 Toronto W08 929 $611,749,858 $658,504 $541,000 1,891 99% 25 Toronto W09 256 $127,492,817 $498,019 $541,000 471 100% 23 Toronto W10 451 $158,374,479 $351,163 $395,000 823 98% 28 Toronto Central 8,291 $6,118,573,775 $737,978 $499,000 17,513 100% 25 Toronto C01 2,128 $1,048,214,250 $492,582 $410,000 5,433 99% 29 Toronto C02 391 $428,798,754 $1,096,672 $860,000 835 101% 23 Toronto C03 299 $348,567,245 $1,165,777 $818,000 529 100% 23 Toronto C04 586 $762,725,610 $1,301,580 $1,200,000 1,070 101% 19 Toronto C06 175 $103,640,690 $592,233 $560,000 365 100% 24 Toronto C07 618 $402,839,165 $651,843 $464,000 1,315 98% 25 Toronto C08 820 $393,255,017 $479,579 $417,300 1,595 99% 26 Toronto C09 192 $320,888,262 $1,671,293 $1,445,000 368 99% 23 Toronto C10 341 $262,772,243 $770,593 $700,000 566 102% 17 Toronto C11 304 $233,519,330 $768,156 $446,000 432 102% 20 Toronto C12 235 $421,670,752 $1,794,344 $1,500,000 510 97% 30 Toronto C13 431 $303,450,128 $704,061 $539,000 675 103% 19 Toronto C14 951 $619,476,895 $651,395 $445,000 2,244 98% 28 Toronto C15 820 $468,755,434 $571,653 $447,250 1,576 101% 23 Toronto East 5,267 $2,645,996,935 $502,373 $490,000 8,156 103% 17 Toronto E01 506 $333,901,030 $659,883 $643,275 759 107% 12 Toronto E02 434 $330,845,839 $762,318 $680,000 688 103% 12 Toronto E03 564 $353,455,306 $626,694 $600,000 840 106% 13 Toronto E04 636 $271,188,386 $426,397 $460,000 940 102% 18 Toronto E05 544 $253,805,720 $466,555 $395,500 796 103% 16 Toronto E06 240 $132,237,289 $550,989 $509,000 415 101% 14 Toronto E07 502 $221,233,654 $440,704 $421,000 835 103% 20 Toronto E08 341 $150,553,823 $441,507 $450,000 538 100% 21 Toronto E09 654 $243,152,820 $371,793 $363,000 1,058 100% 22 Toronto E10 363 $178,359,592 $491,349 $483,500 567 102% 19 Toronto E11 483 $177,263,476 $367,005 $367,000 720 100% 20 SUMMARY OF EXISTING HOME TRANSACTIONS
- 7. Market Watch, June 2014 Industrial Leasing July 2010Page 3 7 Toronto Real Estate Board ALL TREB AREAS Sales 1 Dollar Volume 1 Average Price 1 Median Price 1 New Listings 2 Active Listings 3 Avg. SP/LP 4 Avg. DOM 5 TREB Total 5,048 $3,606,924,726 $714,526 $610,000 8,267 9,961 99% 21- - - - - - - - Halton Region 528 $400,262,352 $758,073 $641,750 815 1,133 98% 23 Burlington 93 $67,737,970 $728,365 $618,000 167 252 97% 30 Halton Hills 87 $46,620,961 $535,873 $524,900 132 189 98% 23 Milton 119 $70,449,500 $592,013 $568,000 182 226 99% 19 Oakville 229 $215,453,921 $940,847 $791,500 334 466 98% 23- - - - - - - - Peel Region 1,024 $634,752,455 $619,875 $582,000 1,732 2,107 98% 21 Brampton 537 $285,087,694 $530,890 $504,000 869 988 98% 22 Caledon 88 $56,878,240 $646,344 $593,750 179 311 97% 28 Mississauga 399 $292,786,521 $733,801 $665,000 684 808 98% 19- - - - - - - - City of Toronto 1,312 $1,208,518,966 $921,127 $721,250 2,145 2,068 101% 15 - - - - - - - - York Region 1,106 $899,550,705 $813,337 $745,000 1,915 2,429 99% 21 Aurora 59 $54,148,699 $917,775 $730,000 84 117 97% 24 E. Gwillimbury 26 $14,748,600 $567,254 $503,500 61 94 97% 32 Georgina 97 $39,766,742 $409,966 $380,000 142 206 98% 24 King 33 $29,019,738 $879,386 $790,000 85 175 97% 39 Markham 256 $236,535,790 $923,968 $851,100 419 387 99% 17 Newmarket 111 $64,339,776 $579,638 $550,000 175 177 99% 20 Richmond Hill 232 $221,275,099 $953,772 $856,500 418 475 100% 18 Vaughan 214 $185,928,574 $868,825 $757,000 412 590 98% 20 Whitchurch-Stouffville 78 $53,787,687 $689,586 $618,950 119 208 97% 31- - - - - - - - Durham Region 832 $362,507,133 $435,706 $409,500 1,246 1,389 99% 21 Ajax 162 $78,087,288 $482,020 $465,000 188 139 99% 17 Brock 22 $5,901,500 $268,250 $282,000 35 94 97% 49 Clarington 125 $46,599,580 $372,797 $346,500 224 263 99% 25 Oshawa 207 $72,664,574 $351,037 $334,000 327 290 99% 17 Pickering 96 $53,164,240 $553,794 $522,500 130 146 99% 20 Scugog 46 $20,850,815 $453,279 $422,800 83 142 98% 31 Uxbridge 34 $19,567,400 $575,512 $525,000 53 120 97% 47 Whitby 140 $65,671,736 $469,084 $447,000 206 195 100% 15- - - - - - - - Dufferin County 53 $20,811,825 $392,676 $371,000 77 151 98% 36 Orangeville 53 $20,811,825 $392,676 $371,000 77 151 98% 36- - - - - - - - Simcoe County 193 $80,521,290 $417,209 $380,000 337 684 97% 37 Adjala-Tosorontio 10 $3,861,700 $386,170 $379,950 31 90 97% 45 Bradford West Gwillimbury 51 $27,119,040 $531,746 $503,000 75 126 98% 38 Essa 23 $8,197,800 $356,426 $333,000 29 78 98% 50 Innisfil 70 $26,492,950 $378,471 $334,450 118 228 96% 34 New Tecumseth 39 $14,849,800 $380,764 $365,500 84 162 98% 30 SUMMARY OF EXISTING HOME TRANSACTIONS DETACHED HOUSES, JUNE 2014 ! TURN PAGE FOR CITY OF TORONTO TABLES OR CLICK HERE:
- 8. Market Watch, June 2014 Industrial Leasing July 2010Page 3 8 Toronto Real Estate Board CITY OF TORONTO MUNICIPAL BREAKDOWN Sales1 Dollar Volume1 Average Price1 Median Price1 New Listings2 Active Listings3 Avg. SP/LP4 Avg. DOM5 TREB Total 5,048 $3,606,924,726 $714,526 $610,000 8,267 9,961 99% 21 City of Toronto Total 1,312 $1,208,518,966 $921,127 $721,250 2,145 2,068 101% 15 Toronto West 425 $317,377,720 $746,771 $640,000 668 668 101% 17 Toronto W01 18 $21,525,000 $1,195,833 $1,250,000 23 19 104% 20 Toronto W02 39 $33,795,143 $866,542 $850,000 56 40 107% 10 Toronto W03 44 $22,577,064 $513,115 $488,750 76 78 101% 18 Toronto W04 47 $24,839,455 $528,499 $523,000 79 76 101% 14 Toronto W05 30 $17,557,700 $585,257 $571,750 49 66 97% 32 Toronto W06 48 $32,215,339 $671,153 $600,000 60 42 102% 14 Toronto W07 29 $25,325,500 $873,293 $831,500 32 24 105% 11 Toronto W08 89 $93,393,181 $1,049,362 $860,000 169 198 99% 17 Toronto W09 35 $23,771,388 $679,183 $665,000 47 50 101% 17 Toronto W10 46 $22,377,950 $486,477 $485,000 77 75 99% 19 Toronto Central 401 $580,755,086 $1,448,267 $1,205,000 694 842 100% 17 Toronto C01 8 $8,590,000 $1,073,750 $1,072,500 14 15 107% 12 Toronto C02 18 $27,584,042 $1,532,447 $1,354,500 34 41 104% 11 Toronto C03 45 $68,164,018 $1,514,756 $1,100,000 64 70 99% 24 Toronto C04 76 $123,947,568 $1,630,889 $1,497,500 154 168 100% 17 Toronto C06 16 $13,007,000 $812,938 $790,000 31 35 102% 11 Toronto C07 38 $41,250,300 $1,085,534 $955,000 81 131 97% 18 Toronto C08 - - - - 1 3 - - Toronto C09 15 $36,295,000 $2,419,667 $2,575,000 23 51 98% 18 Toronto C10 20 $28,340,000 $1,417,000 $1,332,500 25 22 101% 18 Toronto C11 30 $43,339,684 $1,444,656 $1,399,500 25 12 102% 11 Toronto C12 24 $56,703,048 $2,362,627 $2,430,000 50 102 98% 31 Toronto C13 26 $36,544,188 $1,405,546 $1,254,594 37 29 104% 16 Toronto C14 38 $50,192,488 $1,320,855 $1,200,000 81 111 98% 16 Toronto C15 47 $46,797,750 $995,697 $875,000 74 52 101% 13 Toronto East 486 $310,386,160 $638,655 $591,000 783 558 103% 12 Toronto E01 19 $16,969,529 $893,133 $848,000 26 19 102% 14 Toronto E02 24 $24,867,471 $1,036,145 $961,000 42 41 102% 9 Toronto E03 63 $41,351,374 $656,371 $620,000 95 66 105% 10 Toronto E04 77 $41,897,782 $544,127 $530,000 97 67 104% 13 Toronto E05 39 $27,847,388 $714,036 $710,000 67 38 105% 9 Toronto E06 36 $21,161,600 $587,822 $534,500 65 52 101% 16 Toronto E07 37 $26,507,520 $716,419 $660,000 58 28 103% 12 Toronto E08 35 $22,993,000 $656,943 $610,000 68 62 98% 15 Toronto E09 59 $30,542,988 $517,678 $515,000 110 78 103% 11 Toronto E10 54 $33,810,255 $626,116 $616,500 92 71 104% 14 Toronto E11 43 $22,437,253 $521,797 $490,870 63 36 101% 12 DETACHED HOUSES, JUNE 2014 SUMMARY OF EXISTING HOME TRANSACTIONS
- 9. Industrial Leasing Toronto Real Estate Board ALL TREB AREAS Sales 1 Dollar Volume 1 Average Price 1 Median Price 1 New Listings 2 Active Listings 3 Avg. SP/LP 4 Avg. DOM 5 TREB Total 1,138 $611,315,398 $537,184 $495,000 1,546 1,084 102% 13- - - - - - - - Halton Region 67 $30,810,810 $459,863 $458,500 86 77 99% 16 Burlington 12 $5,458,700 $454,892 $483,750 16 11 99% 21 Halton Hills 10 $3,742,400 $374,240 $389,750 6 2 99% 15 Milton 32 $14,606,060 $456,439 $456,500 46 42 99% 14 Oakville 13 $7,003,650 $538,742 $523,500 18 22 99% 14- - - - - - - - Peel Region 382 $171,775,145 $449,673 $439,000 565 426 99% 14 Brampton 184 $73,889,507 $401,573 $401,500 277 224 99% 15 Caledon 4 $1,795,000 $448,750 $457,500 9 8 98% 14 Mississauga 194 $96,090,638 $495,313 $497,500 279 194 100% 13- - - - - - - - City of Toronto 450 $302,726,092 $672,725 $620,000 571 361 105% 11 - - - - - - - - York Region 154 $80,035,765 $519,713 $527,000 223 154 100% 12 Aurora 14 $6,301,777 $450,127 $443,250 16 5 99% 10 E. Gwillimbury 2 $970,000 $485,000 $485,000 2 - 99% 11 Georgina 4 $1,390,500 $347,625 $345,000 2 - 98% 15 King - - - - - 1 - - Markham 32 $18,049,200 $564,038 $552,000 55 40 102% 12 Newmarket 23 $9,964,500 $433,239 $438,000 35 25 99% 13 Richmond Hill 23 $12,745,377 $554,147 $538,000 34 23 102% 12 Vaughan 47 $26,330,411 $560,222 $550,000 71 59 99% 14 Whitchurch-Stouffville 9 $4,284,000 $476,000 $465,000 8 1 102% 7- - - - - - - - Durham Region 78 $23,765,586 $304,687 $266,000 92 52 100% 13 Ajax 18 $6,986,850 $388,158 $375,150 21 12 100% 12 Brock - - - - - - - - Clarington 1 $245,000 $245,000 $245,000 2 2 102% 7 Oshawa 41 $9,513,250 $232,030 $235,000 45 27 99% 15 Pickering 12 $4,970,900 $414,242 $419,000 13 6 102% 9 Scugog - - - - - - - - Uxbridge 1 $349,000 $349,000 $349,000 - 1 97% 22 Whitby 5 $1,700,586 $340,117 $352,900 11 4 105% 5- - - - - - - - Dufferin County 6 $1,786,000 $297,667 $269,250 6 7 97% 26 Orangeville 6 $1,786,000 $297,667 $269,250 6 7 97% 26- - - - - - - - Simcoe County 1 $416,000 $416,000 $416,000 3 7 97% 62 Adjala-Tosorontio - - - - - - - - Bradford West Gwillimbury 1 $416,000 $416,000 $416,000 2 3 97% 62 Essa - - - - 1 2 - - Innisfil - - - - - - - - New Tecumseth - - - - - 2 - - ! TURN PAGE FOR CITY OF TORONTO TABLES OR CLICK HERE: SUMMARY OF EXISTING HOME TRANSACTIONS SEMI-DETACHED HOUSES, JUNE 2014 July 2010Page 3 Market Watch, June 2014 9
- 10. Industrial Leasing July 2010Page 3 Toronto Real Estate Board Market Watch, June 2014 CITY OF TORONTO MUNICIPAL BREAKDOWN Sales1 Dollar Volume1 Average Price1 Median Price1 New Listings2 Active Listings3 Avg. SP/LP4 Avg. DOM5 TREB Total 1,138 $611,315,398 $537,184 $495,000 1,546 1,084 102% 13 City of Toronto Total 450 $302,726,092 $672,725 $620,000 571 361 105% 11 Toronto West 117 $65,508,928 $559,905 $500,005 185 160 105% 12 Toronto W01 9 $7,136,800 $792,978 $760,000 15 8 111% 7 Toronto W02 30 $20,768,967 $692,299 $655,000 45 26 109% 9 Toronto W03 20 $9,673,678 $483,684 $485,000 29 23 102% 15 Toronto W04 3 $1,564,500 $521,500 $485,000 5 9 99% 6 Toronto W05 39 $17,880,483 $458,474 $450,000 64 73 100% 15 Toronto W06 6 $3,615,000 $602,500 $611,000 10 9 103% 9 Toronto W07 - - - - - - - - Toronto W08 4 $2,177,500 $544,375 $534,250 5 2 103% 8 Toronto W09 2 $1,060,000 $530,000 $530,000 2 3 103% 13 Toronto W10 4 $1,632,000 $408,000 $407,500 10 7 98% 15 Toronto Central 149 $125,128,040 $839,786 $792,800 167 112 103% 13 Toronto C01 20 $17,519,723 $875,986 $879,000 19 19 104% 11 Toronto C02 29 $30,932,501 $1,066,638 $892,000 33 20 102% 13 Toronto C03 14 $9,918,800 $708,486 $728,500 17 11 104% 18 Toronto C04 15 $12,616,659 $841,111 $836,000 13 2 106% 8 Toronto C06 - - - - - - - - Toronto C07 5 $2,891,380 $578,276 $540,000 4 3 101% 44 Toronto C08 5 $4,138,500 $827,700 $694,000 4 3 99% 21 Toronto C09 2 $3,939,500 $1,969,750 $1,969,750 - 6 95% 22 Toronto C10 20 $17,880,878 $894,044 $833,500 19 4 108% 7 Toronto C11 2 $1,703,500 $851,750 $851,750 5 5 108% 8 Toronto C12 2 $1,294,000 $647,000 $647,000 1 1 101% 17 Toronto C13 8 $4,698,786 $587,348 $584,000 17 11 102% 8 Toronto C14 1 $901,800 $901,800 $901,800 - - 93% 63 Toronto C15 26 $16,692,013 $642,001 $621,500 35 27 102% 12 Toronto East 184 $112,089,125 $609,180 $581,000 219 89 107% 9 Toronto E01 43 $30,154,122 $701,259 $693,500 48 21 109% 8 Toronto E02 43 $27,912,908 $649,137 $619,300 49 20 106% 9 Toronto E03 42 $26,876,215 $639,910 $614,500 44 9 108% 9 Toronto E04 10 $4,750,000 $475,000 $447,500 9 2 103% 12 Toronto E05 9 $5,450,580 $605,620 $612,000 13 9 108% 7 Toronto E06 5 $2,329,000 $465,800 $456,000 6 4 100% 13 Toronto E07 9 $4,934,800 $548,311 $548,000 17 8 104% 9 Toronto E08 1 $450,000 $450,000 $450,000 3 2 103% 9 Toronto E09 5 $2,258,000 $451,600 $480,000 9 3 100% 9 Toronto E10 4 $1,688,000 $422,000 $420,000 4 1 103% 8 Toronto E11 13 $5,285,500 $406,577 $387,500 17 10 103% 11 SUMMARY OF EXISTING HOME TRANSACTIONS SEMI-DETACHED HOUSES, JUNE 2014 10
- 11. Industrial Leasing July 2010Page 3 Toronto Real Estate Board Market Watch, June 2014 ALL TREB AREAS Sales 1 Dollar Volume 1 Average Price 1 Median Price 1 New Listings 2 Active Listings 3 Avg. SP/LP 4 Avg. DOM 5 TREB Total 826 $307,401,759 $372,157 $352,000 1,179 1,235 100% 21- - - - - - - - Halton Region 66 $23,176,768 $351,163 $320,250 83 99 99% 26 Burlington 29 $10,285,049 $354,657 $325,300 36 41 99% 28 Halton Hills 8 $2,405,000 $300,625 $292,500 5 4 99% 17 Milton 11 $3,234,900 $294,082 $294,000 14 15 99% 27 Oakville 18 $7,251,819 $402,879 $354,750 28 39 99% 28- - - - - - - - Peel Region 309 $111,179,101 $359,803 $353,800 474 475 99% 21 Brampton 65 $19,961,439 $307,099 $310,000 117 137 98% 24 Caledon - - - - 1 1 - - Mississauga 244 $91,217,662 $373,843 $368,500 356 337 99% 20- - - - - - - - City of Toronto 285 $114,714,010 $402,505 $384,000 427 472 100% 21 - - - - - - - - York Region 87 $38,062,680 $437,502 $425,000 113 123 99% 22 Aurora 7 $3,946,900 $563,843 $384,900 8 14 99% 26 E. Gwillimbury - - - - - - - - Georgina - - - - - - - - King - - - - - 1 - - Markham 46 $20,542,880 $446,584 $448,000 50 47 100% 22 Newmarket 9 $3,183,500 $353,722 $330,500 12 10 98% 21 Richmond Hill 13 $5,173,500 $397,962 $360,000 22 25 98% 23 Vaughan 11 $4,956,100 $450,555 $465,000 20 26 99% 22 Whitchurch-Stouffville 1 $259,800 $259,800 $259,800 1 - 97% 18- - - - - - - - Durham Region 71 $18,655,000 $262,746 $264,900 74 53 100% 22 Ajax 15 $4,315,300 $287,687 $286,000 13 7 99% 23 Brock 1 $259,000 $259,000 $259,000 1 4 96% 64 Clarington 3 $886,400 $295,467 $290,000 6 5 106% 7 Oshawa 14 $2,700,900 $192,921 $196,000 15 13 100% 21 Pickering 25 $7,333,100 $293,324 $282,000 25 17 101% 17 Scugog - - - - - - - - Uxbridge 3 $670,400 $223,467 $176,000 4 3 98% 39 Whitby 10 $2,489,900 $248,990 $248,000 10 4 99% 27- - - - - - - - Dufferin County 3 $594,700 $198,233 $199,000 4 7 99% 38 Orangeville 3 $594,700 $198,233 $199,000 4 7 99% 38- - - - - - - - Simcoe County 5 $1,019,500 $203,900 $212,500 4 6 98% 29 Adjala-Tosorontio - - - - - - - - Bradford West Gwillimbury 1 $260,000 $260,000 $260,000 2 1 97% 15 Essa - - - - - - - - Innisfil - - - - - - - - New Tecumseth 4 $759,500 $189,875 $194,250 2 5 98% 32 ! TURN PAGE FOR CITY OF TORONTO TABLES OR CLICK HERE: SUMMARY OF EXISTING HOME TRANSACTIONS CONDOMINIUM TOWNHOUSES, JUNE 2014 11
- 12. Industrial Leasing July 2010Page 3 Toronto Real Estate Board Market Watch, June 2014 12 CITY OF TORONTO MUNICIPAL BREAKDOWN Sales1 Dollar Volume1 Average Price1 Median Price1 New Listings2 Active Listings3 Avg. SP/LP4 Avg. DOM5 TREB Total 826 $307,401,759 $372,157 $352,000 1,179 1,235 100% 21 City of Toronto Total 285 $114,714,010 $402,505 $384,000 427 472 100% 21 Toronto West 72 $24,222,690 $336,426 $323,500 113 130 99% 25 Toronto W01 7 $2,688,000 $384,000 $414,000 10 10 100% 16 Toronto W02 8 $3,624,000 $453,000 $453,000 11 12 100% 19 Toronto W03 2 $688,000 $344,000 $344,000 3 4 100% 67 Toronto W04 9 $2,776,400 $308,489 $275,000 5 6 100% 25 Toronto W05 18 $4,397,490 $244,305 $210,000 27 32 98% 36 Toronto W06 3 $1,674,900 $558,300 $492,000 10 13 96% 15 Toronto W07 - - - - 1 1 - - Toronto W08 14 $5,398,000 $385,571 $422,000 16 18 98% 20 Toronto W09 2 $666,000 $333,000 $333,000 6 10 100% 9 Toronto W10 9 $2,309,900 $256,656 $280,000 24 24 98% 20 Toronto Central 104 $53,473,364 $514,167 $480,000 179 209 101% 19 Toronto C01 22 $10,893,950 $495,180 $518,325 40 48 101% 17 Toronto C02 3 $2,121,900 $707,300 $651,000 4 7 108% 8 Toronto C03 - - - - 1 3 - - Toronto C04 - - - - 1 3 - - Toronto C06 1 $495,000 $495,000 $495,000 2 5 102% 3 Toronto C07 8 $3,411,000 $426,375 $407,250 10 13 101% 19 Toronto C08 6 $3,455,000 $575,833 $530,000 10 15 99% 32 Toronto C09 1 $950,000 $950,000 $950,000 3 2 106% 3 Toronto C10 2 $1,023,700 $511,850 $511,850 5 3 106% 7 Toronto C11 1 $555,000 $555,000 $555,000 5 5 111% 12 Toronto C12 11 $9,501,014 $863,729 $775,000 13 15 101% 19 Toronto C13 3 $1,340,000 $446,667 $395,000 4 3 107% 26 Toronto C14 15 $7,035,500 $469,033 $427,000 25 45 98% 33 Toronto C15 31 $12,691,300 $409,397 $420,000 56 42 100% 15 Toronto East 109 $37,017,956 $339,614 $340,000 135 133 100% 19 Toronto E01 10 $4,622,932 $462,293 $415,716 9 4 102% 11 Toronto E02 3 $1,631,500 $543,833 $527,000 6 6 99% 9 Toronto E03 - - - - 1 1 - - Toronto E04 10 $3,359,283 $335,928 $333,750 15 18 99% 23 Toronto E05 27 $10,307,868 $381,773 $385,000 31 21 102% 12 Toronto E06 - - - - - 1 - - Toronto E07 9 $3,358,500 $373,167 $360,000 17 14 99% 26 Toronto E08 10 $2,952,400 $295,240 $316,550 5 7 98% 26 Toronto E09 14 $3,790,000 $270,714 $277,450 15 12 101% 19 Toronto E10 13 $3,209,899 $246,915 $259,900 14 19 98% 19 Toronto E11 13 $3,785,574 $291,198 $275,000 22 30 100% 31 SUMMARY OF EXISTING HOME TRANSACTIONS CONDOMINIUM TOWNHOUSES, JUNE 2014
- 13. Industrial Leasing July 2010Page 3 Toronto Real Estate Board Market Watch, June 2014 ALL TREB AREAS Sales 1 Dollar Volume 1 Average Price 1 Median Price 1 New Listings 2 Active Listings 3 Avg. SP/LP 4 Avg. DOM 5 TREB Total 2,214 $813,298,454 $367,343 $325,944 4,389 7,286 98% 31- - - - - - - - Halton Region 61 $24,714,490 $405,156 $318,000 112 205 97% 53 Burlington 23 $8,727,700 $379,465 $298,400 35 71 97% 55 Halton Hills 1 $335,000 $335,000 $335,000 - - 99% 9 Milton 15 $4,736,490 $315,766 $310,000 18 20 99% 23 Oakville 22 $10,915,300 $496,150 $365,000 59 114 97% 72- - - - - - - - Peel Region 301 $80,910,150 $268,804 $249,000 621 1,019 97% 31 Brampton 58 $13,553,500 $233,681 $223,000 63 76 98% 32 Caledon 2 $949,000 $474,500 $474,500 1 4 98% 41 Mississauga 241 $66,407,650 $275,550 $259,000 557 939 97% 31- - - - - - - - City of Toronto 1,578 $616,317,271 $390,569 $345,900 3,126 5,127 98% 30 - - - - - - - - York Region 219 $78,097,545 $356,610 $327,500 462 850 98% 33 Aurora 5 $2,360,000 $472,000 $498,000 4 19 97% 65 E. Gwillimbury - - - - - - - - Georgina 1 $149,900 $149,900 $149,900 2 1 100% 15 King - - - - 2 10 - - Markham 73 $25,913,488 $354,979 $323,500 179 306 97% 34 Newmarket 9 $2,532,400 $281,378 $287,000 13 7 99% 13 Richmond Hill 62 $20,226,700 $326,237 $306,000 132 249 97% 34 Vaughan 67 $25,979,057 $387,747 $361,000 128 250 98% 31 Whitchurch-Stouffville 2 $936,000 $468,000 $468,000 2 8 98% 62- - - - - - - - Durham Region 50 $12,194,198 $243,884 $230,000 58 63 99% 25 Ajax 11 $2,726,500 $247,864 $224,000 9 8 99% 25 Brock - - - - - - - - Clarington 4 $782,100 $195,525 $191,550 10 9 99% 20 Oshawa 7 $1,164,000 $166,286 $169,000 7 15 99% 22 Pickering 13 $3,409,198 $262,246 $247,000 17 14 99% 20 Scugog 2 $574,900 $287,450 $287,450 - 1 97% 68 Uxbridge 2 $623,000 $311,500 $311,500 2 2 98% 25 Whitby 11 $2,914,500 $264,955 $268,000 13 14 98% 25- - - - - - - - Dufferin County - - - - 1 6 - - Orangeville - - - - 1 6 - -- - - - - - - - Simcoe County 5 $1,064,800 $212,960 $203,400 9 16 100% 126 Adjala-Tosorontio - - - - - - - - Bradford West Gwillimbury 2 $397,000 $198,500 $198,500 4 6 98% 18 Essa - - - - - - - - Innisfil - - - - - - - - New Tecumseth 3 $667,800 $222,600 $203,400 5 10 100% 199 ! TURN PAGE FOR CITY OF TORONTO TABLES OR CLICK HERE: SUMMARY OF EXISTING HOME TRANSACTIONS CONDOMINIUM APARTMENT, JUNE 2014 13
- 14. Industrial Leasing July 2010Page 3 Toronto Real Estate Board Market Watch, June 2014 14 CITY OF TORONTO MUNICIPAL BREAKDOWN Sales1 Dollar Volume1 Average Price1 Median Price1 New Listings2 Active Listings3 Avg. SP/LP4 Avg. DOM5 TREB Total 2,214 $813,298,454 $367,343 $325,944 4,389 7,286 98% 31 City of Toronto Total 1,578 $616,317,271 $390,569 $345,900 3,126 5,127 98% 30 Toronto West 302 $96,965,975 $321,079 $283,000 634 1,160 98% 36 Toronto W01 17 $7,391,033 $434,767 $321,490 60 112 100% 23 Toronto W02 14 $5,148,914 $367,780 $375,250 24 32 100% 18 Toronto W03 6 $1,833,000 $305,500 $310,000 8 12 96% 38 Toronto W04 33 $7,067,388 $214,163 $210,000 32 57 98% 31 Toronto W05 32 $6,700,300 $209,384 $185,500 53 109 97% 40 Toronto W06 66 $28,378,500 $429,977 $338,250 171 372 97% 48 Toronto W07 4 $3,273,000 $818,250 $650,750 7 6 101% 13 Toronto W08 80 $26,372,140 $329,652 $286,000 180 299 98% 33 Toronto W09 20 $5,132,800 $256,640 $280,950 36 60 97% 33 Toronto W10 30 $5,668,900 $188,963 $187,500 63 101 96% 37 Toronto Central 1,011 $445,478,795 $440,632 $382,000 2,061 3,402 98% 29 Toronto C01 356 $156,515,564 $439,650 $388,500 856 1,529 98% 30 Toronto C02 34 $29,829,288 $877,332 $622,500 98 183 98% 34 Toronto C03 5 $3,932,000 $786,400 $770,000 16 35 101% 18 Toronto C04 20 $10,920,000 $546,000 $382,000 28 30 102% 16 Toronto C06 10 $3,109,050 $310,905 $304,500 34 66 98% 36 Toronto C07 62 $23,257,078 $375,114 $345,000 125 210 98% 30 Toronto C08 175 $78,159,189 $446,624 $415,000 251 351 99% 24 Toronto C09 11 $5,923,100 $538,464 $498,000 17 27 100% 23 Toronto C10 46 $23,806,500 $517,533 $505,000 66 93 100% 24 Toronto C11 25 $6,480,000 $259,200 $256,500 31 30 98% 20 Toronto C12 11 $8,971,000 $815,545 $524,000 12 28 95% 43 Toronto C13 38 $12,800,900 $336,866 $334,000 67 71 99% 21 Toronto C14 142 $57,118,426 $402,242 $375,000 296 483 98% 34 Toronto C15 76 $24,656,700 $324,430 $299,900 164 266 98% 34 Toronto East 265 $73,872,501 $278,764 $253,000 431 565 99% 26 Toronto E01 19 $9,135,638 $480,823 $510,500 33 40 101% 16 Toronto E02 14 $7,664,110 $547,436 $557,000 29 30 103% 13 Toronto E03 10 $2,709,500 $270,950 $163,250 13 20 98% 17 Toronto E04 35 $6,799,900 $194,283 $172,000 58 74 97% 30 Toronto E05 40 $11,564,100 $289,103 $289,500 56 46 98% 18 Toronto E06 2 $531,000 $265,500 $265,500 7 10 97% 16 Toronto E07 41 $10,704,066 $261,075 $255,000 69 111 98% 34 Toronto E08 22 $4,656,499 $211,659 $203,000 31 32 96% 30 Toronto E09 61 $16,167,988 $265,049 $269,000 96 145 98% 29 Toronto E10 2 $430,000 $215,000 $215,000 6 10 98% 30 Toronto E11 19 $3,509,700 $184,721 $185,000 33 47 97% 35 SUMMARY OF EXISTING HOME TRANSACTIONS CONDOMINIUM APARTMENT, JUNE 2014
- 15. Industrial Leasing July 2010Page 3 Toronto Real Estate Board Market Watch, June 2014 ALL TREB AREAS Sales 1 Dollar Volume 1 Average Price 1 Median Price 1 New Listings 2 Active Listings 3 Avg. SP/LP 4 Avg. DOM 5 TREB Total 147 $70,690,788 $480,890 $459,000 209 159 102% 13- - - - - - - - Halton Region 6 $2,652,500 $442,083 $471,250 10 8 99% 5 Burlington 2 $908,500 $454,250 $454,250 2 - 98% 5 Halton Hills 1 $299,000 $299,000 $299,000 1 - 100% 1 Milton 1 $461,000 $461,000 $461,000 2 2 98% 9 Oakville 2 $984,000 $492,000 $492,000 5 6 99% 6- - - - - - - - Peel Region 12 $4,894,399 $407,867 $386,000 25 26 99% 9 Brampton 11 $4,304,399 $391,309 $382,000 15 13 99% 9 Caledon - - - - 1 1 - - Mississauga 1 $590,000 $590,000 $590,000 9 12 97% 8- - - - - - - - City of Toronto 14 $7,232,000 $516,571 $533,750 28 25 100% 19 - - - - - - - - York Region 62 $38,941,488 $628,089 $644,000 90 65 104% 12 Aurora 2 $1,210,900 $605,450 $605,450 1 1 100% 5 E. Gwillimbury - - - - - - - - Georgina 1 $285,000 $285,000 $285,000 - - 97% 29 King - - - - 1 2 - - Markham 48 $31,187,588 $649,741 $656,500 65 41 105% 11 Newmarket 1 $455,000 $455,000 $455,000 1 2 101% 8 Richmond Hill 5 $3,108,000 $621,600 $605,000 13 11 100% 11 Vaughan 5 $2,695,000 $539,000 $485,000 9 8 98% 15 Whitchurch-Stouffville - - - - - - - -- - - - - - - - Durham Region 37 $11,921,400 $322,200 $316,000 43 27 99% 13 Ajax 3 $1,151,000 $383,667 $408,000 4 1 98% 17 Brock - - - - - - - - Clarington 19 $5,649,200 $297,326 $295,000 18 13 99% 15 Oshawa 5 $1,341,600 $268,320 $270,800 7 5 101% 7 Pickering 2 $834,000 $417,000 $417,000 1 1 98% 30 Scugog - - - - 1 1 - - Uxbridge 1 $388,000 $388,000 $388,000 - - 100% 11 Whitby 7 $2,557,600 $365,371 $358,000 12 6 100% 7- - - - - - - - Dufferin County - - - - - - - - Orangeville - - - - - - - -- - - - - - - - Simcoe County 16 $5,049,001 $315,563 $311,000 13 8 98% 18 Adjala-Tosorontio - - - - - - - - Bradford West Gwillimbury 7 $2,594,000 $370,571 $352,500 8 5 98% 18 Essa 8 $2,143,001 $267,875 $264,000 4 2 99% 16 Innisfil - - - - - - - - New Tecumseth 1 $312,000 $312,000 $312,000 1 1 98% 42 SUMMARY OF EXISTING HOME TRANSACTIONS LINK, JUNE 2014 ! TURN PAGE FOR CITY OF TORONTO TABLES OR CLICK HERE: 15
- 16. Industrial Leasing July 2010Page 3 Toronto Real Estate Board Market Watch, June 2014 16 CITY OF TORONTO MUNICIPAL BREAKDOWN Sales1 Dollar Volume1 Average Price1 Median Price1 New Listings2 Active Listings3 Avg. SP/LP4 Avg. DOM5 TREB Total 147 $70,690,788 $480,890 $459,000 209 159 102% 13 City of Toronto Total 14 $7,232,000 $516,571 $533,750 28 25 100% 19 Toronto West 2 $870,000 $435,000 $435,000 3 5 97% 20 Toronto W01 - - - - - - - - Toronto W02 - - - - - - - - Toronto W03 - - - - - - - - Toronto W04 - - - - - - - - Toronto W05 - - - - - 2 - - Toronto W06 - - - - - - - - Toronto W07 - - - - - - - - Toronto W08 - - - - - - - - Toronto W09 - - - - - - - - Toronto W10 2 $870,000 $435,000 $435,000 3 3 97% 20 Toronto Central 2 $1,217,500 $608,750 $608,750 5 6 98% 35 Toronto C01 - - - - - - - - Toronto C02 - - - - - - - - Toronto C03 - - - - - - - - Toronto C04 - - - - - - - - Toronto C06 - - - - - - - - Toronto C07 2 $1,217,500 $608,750 $608,750 2 3 98% 35 Toronto C08 - - - - - - - - Toronto C09 - - - - - - - - Toronto C10 - - - - - - - - Toronto C11 - - - - - - - - Toronto C12 - - - - - - - - Toronto C13 - - - - - - - - Toronto C14 - - - - - - - - Toronto C15 - - - - 3 3 - - Toronto East 10 $5,144,500 $514,450 $533,750 20 14 101% 16 Toronto E01 - - - - - - - - Toronto E02 - - - - - - - - Toronto E03 - - - - - - - - Toronto E04 - - - - - - - - Toronto E05 3 $1,840,000 $613,333 $605,000 5 1 101% 10 Toronto E06 - - - - - - - - Toronto E07 4 $2,122,500 $530,625 $537,750 9 8 102% 17 Toronto E08 - - - - 1 - - - Toronto E09 - - - - - - - - Toronto E10 - - - - - - - - Toronto E11 3 $1,182,000 $394,000 $405,000 5 5 99% 19 SUMMARY OF EXISTING HOME TRANSACTIONS LINK, JUNE 2014
- 17. Industrial Leasing July 2010Page 3 Toronto Real Estate Board Market Watch, June 2014 ALL TREB AREAS Sales 1 Dollar Volume 1 Average Price 1 Median Price 1 New Listings 2 Active Listings 3 Avg. SP/LP 4 Avg. DOM 5 TREB Total 780 $373,742,783 $479,157 $440,250 1,086 857 100% 15- - - - - - - - Halton Region 156 $69,614,804 $446,249 $425,000 194 146 99% 17 Burlington 20 $8,604,500 $430,225 $425,500 16 13 99% 17 Halton Hills 7 $2,648,500 $378,357 $379,900 12 13 100% 17 Milton 85 $34,322,840 $403,798 $407,000 101 59 99% 15 Oakville 44 $24,038,964 $546,340 $498,700 65 61 99% 20- - - - - - - - Peel Region 157 $64,066,131 $408,065 $403,500 217 175 99% 17 Brampton 96 $35,583,631 $370,663 $365,000 156 130 99% 16 Caledon 12 $4,880,900 $406,742 $410,500 9 9 98% 28 Mississauga 49 $23,601,600 $481,665 $485,000 52 36 100% 17- - - - - - - - City of Toronto 138 $90,556,277 $656,205 $610,000 183 150 103% 17 - - - - - - - - York Region 198 $106,420,280 $537,476 $523,000 330 270 100% 12 Aurora 15 $6,980,900 $465,393 $458,000 16 9 100% 12 E. Gwillimbury 3 $1,219,800 $406,600 $395,000 4 1 101% 3 Georgina 6 $1,923,452 $320,575 $319,450 6 4 99% 14 King 1 $775,000 $775,000 $775,000 1 4 91% 46 Markham 55 $30,926,678 $562,303 $550,000 96 73 102% 13 Newmarket 14 $6,014,300 $429,593 $432,000 24 11 99% 10 Richmond Hill 54 $31,393,600 $581,363 $573,000 83 63 101% 12 Vaughan 42 $23,564,650 $561,063 $529,000 89 99 99% 14 Whitchurch-Stouffville 8 $3,621,900 $452,738 $442,250 11 6 99% 8- - - - - - - - Durham Region 107 $35,725,603 $333,884 $340,000 137 92 100% 12 Ajax 27 $9,787,600 $362,504 $361,000 50 36 100% 13 Brock 1 $266,000 $266,000 $266,000 - - 93% 24 Clarington 21 $5,665,472 $269,784 $273,000 19 11 100% 13 Oshawa 13 $3,967,800 $305,215 $306,000 15 12 100% 11 Pickering 13 $4,894,500 $376,500 $362,000 15 8 100% 12 Scugog - - - - - - - - Uxbridge 1 $396,500 $396,500 $396,500 2 2 97% 10 Whitby 31 $10,747,731 $346,701 $350,500 36 23 101% 10- - - - - - - - Dufferin County 3 $881,000 $293,667 $315,000 5 6 97% 27 Orangeville 3 $881,000 $293,667 $315,000 5 6 97% 27- - - - - - - - Simcoe County 21 $6,478,688 $308,509 $290,000 20 18 98% 25 Adjala-Tosorontio - - - - - - - - Bradford West Gwillimbury 9 $3,359,400 $373,267 $379,900 5 6 98% 31 Essa 2 $488,900 $244,450 $244,450 3 2 100% 6 Innisfil 6 $1,577,388 $262,898 $277,944 7 6 98% 29 New Tecumseth 4 $1,053,000 $263,250 $258,750 5 4 98% 14 ! TURN PAGE FOR CITY OF TORONTO TABLES OR CLICK HERE: SUMMARY OF EXISTING HOME TRANSACTIONS ATTACHED/ROW/TOWNHOUSE, JUNE 2014 17
- 18. Industrial Leasing July 2010Page 3 Toronto Real Estate Board Market Watch, June 2014 18 CITY OF TORONTO MUNICIPAL BREAKDOWN Sales1 Dollar Volume1 Average Price1 Median Price1 New Listings2 Active Listings3 Avg. SP/LP4 Avg. DOM5 TREB Total 780 $373,742,783 $479,157 $440,250 1,086 857 100% 15 City of Toronto Total 138 $90,556,277 $656,205 $610,000 183 150 103% 17 Toronto West 43 $25,199,204 $586,028 $592,000 45 30 102% 16 Toronto W01 1 $999,999 $999,999 $999,999 2 2 119% 7 Toronto W02 8 $4,772,805 $596,601 $610,000 12 7 107% 8 Toronto W03 2 $585,000 $292,500 $292,500 2 2 104% 12 Toronto W04 1 $650,000 $650,000 $650,000 1 1 109% 6 Toronto W05 7 $3,087,000 $441,000 $443,000 5 6 98% 40 Toronto W06 8 $5,206,000 $650,750 $650,000 12 9 100% 15 Toronto W07 5 $3,413,900 $682,780 $669,900 4 1 100% 9 Toronto W08 8 $5,231,000 $653,875 $602,000 3 - 100% 12 Toronto W09 - - - - - - - - Toronto W10 3 $1,253,500 $417,833 $428,500 4 2 99% 8 Toronto Central 48 $41,287,311 $860,152 $750,000 69 64 103% 12 Toronto C01 26 $20,748,686 $798,026 $742,500 29 13 105% 7 Toronto C02 5 $7,177,000 $1,435,400 $1,150,000 4 6 98% 25 Toronto C03 - - - - 1 1 - - Toronto C04 1 $765,000 $765,000 $765,000 2 7 109% 14 Toronto C06 - - - - 1 2 - - Toronto C07 3 $2,106,800 $702,267 $716,800 5 6 98% 18 Toronto C08 4 $4,050,025 $1,012,506 $912,513 10 7 112% 7 Toronto C09 - - - - 2 2 - - Toronto C10 1 $830,000 $830,000 $830,000 2 1 98% 14 Toronto C11 1 $758,000 $758,000 $758,000 2 4 95% 8 Toronto C12 - - - - 1 1 - - Toronto C13 6 $4,106,800 $684,467 $712,500 4 2 101% 19 Toronto C14 1 $745,000 $745,000 $745,000 6 12 102% 10 Toronto C15 - - - - - - - - Toronto East 47 $24,069,762 $512,123 $493,000 69 56 102% 23 Toronto E01 8 $5,052,017 $631,502 $647,500 10 6 108% 10 Toronto E02 3 $2,247,500 $749,167 $926,000 5 5 99% 14 Toronto E03 - - - - - 2 - - Toronto E04 9 $4,915,000 $546,111 $541,000 8 7 100% 46 Toronto E05 5 $2,640,420 $528,084 $520,000 7 3 103% 12 Toronto E06 - - - - 1 3 - - Toronto E07 1 $510,800 $510,800 $510,800 6 5 110% 9 Toronto E08 4 $2,074,000 $518,500 $514,000 8 7 99% 24 Toronto E09 4 $1,797,025 $449,256 $461,063 3 1 101% 13 Toronto E10 4 $1,719,500 $429,875 $460,000 8 7 100% 34 Toronto E11 9 $3,113,500 $345,944 $333,000 13 10 99% 20 SUMMARY OF EXISTING HOME TRANSACTIONS ATTACHED/ROW/TOWNHOUSE, JUNE 2014
- 19. Industrial Leasing July 2010Page 3 Toronto Real Estate Board Market Watch, June 2014 ALL TREB AREAS Sales 1 Dollar Volume 1 Average Price 1 Median Price 1 New Listings 2 Active Listings 3 Avg. SP/LP 4 Avg. DOM 5 TREB Total 13 $3,926,900 $302,069 $235,000 25 38 98% 42- - - - - - - - Halton Region 1 $495,000 $495,000 $495,000 1 - 103% 2 Burlington - - - - - - - - Halton Hills - - - - - - - - Milton - - - - - - - - Oakville 1 $495,000 $495,000 $495,000 1 - 103% 2- - - - - - - - Peel Region - - - - 1 1 - - Brampton - - - - - - - - Caledon - - - - - - - - Mississauga - - - - 1 1 - -- - - - - - - - City of Toronto 12 $3,431,900 $285,992 $225,000 23 37 97% 45 - - - - - - - - York Region - - - - - - - - Aurora - - - - - - - - E. Gwillimbury - - - - - - - - Georgina - - - - - - - - King - - - - - - - - Markham - - - - - - - - Newmarket - - - - - - - - Richmond Hill - - - - - - - - Vaughan - - - - - - - - Whitchurch-Stouffville - - - - - - - -- - - - - - - - Durham Region - - - - - - - - Ajax - - - - - - - - Brock - - - - - - - - Clarington - - - - - - - - Oshawa - - - - - - - - Pickering - - - - - - - - Scugog - - - - - - - - Uxbridge - - - - - - - - Whitby - - - - - - - -- - - - - - - - Dufferin County - - - - - - - - Orangeville - - - - - - - -- - - - - - - - Simcoe County - - - - - - - - Adjala-Tosorontio - - - - - - - - Bradford West Gwillimbury - - - - - - - - Essa - - - - - - - - Innisfil - - - - - - - - New Tecumseth - - - - - - - - SUMMARY OF EXISTING HOME TRANSACTIONS CO-OP APARTMENT, JUNE 2014 ! TURN PAGE FOR CITY OF TORONTO TABLES OR CLICK HERE: 19
- 20. Industrial Leasing July 2010Page 3 Toronto Real Estate Board Market Watch, June 2014 20 CITY OF TORONTO MUNICIPAL BREAKDOWN Sales1 Dollar Volume1 Average Price1 Median Price1 New Listings2 Active Listings3 Avg. SP/LP4 Avg. DOM5 TREB Total 13 $3,926,900 $302,069 $235,000 25 38 98% 42 City of Toronto Total 12 $3,431,900 $285,992 $225,000 23 37 97% 45 Toronto West 8 $1,538,900 $192,363 $180,950 6 7 95% 50 Toronto W01 - - - - - - - - Toronto W02 1 $320,000 $320,000 $320,000 - - 100% 40 Toronto W03 - - - - - - - - Toronto W04 - - - - - - - - Toronto W05 1 $77,000 $77,000 $77,000 3 5 96% 23 Toronto W06 2 $390,000 $195,000 $195,000 2 2 92% 95 Toronto W07 - - - - - - - - Toronto W08 3 $569,900 $189,967 $179,900 1 - 94% 29 Toronto W09 1 $182,000 $182,000 $182,000 - - 91% 63 Toronto W10 - - - - - - - - Toronto Central 2 $1,185,000 $592,500 $592,500 16 29 101% 19 Toronto C01 - - - - 3 5 - - Toronto C02 - - - - - - - - Toronto C03 - - - - 1 4 - - Toronto C04 - - - - - 1 - - Toronto C06 - - - - - - - - Toronto C07 - - - - 1 1 - - Toronto C08 - - - - - 1 - - Toronto C09 2 $1,185,000 $592,500 $592,500 9 14 101% 19 Toronto C10 - - - - - - - - Toronto C11 - - - - - - - - Toronto C12 - - - - - - - - Toronto C13 - - - - - - - - Toronto C14 - - - - 1 2 - - Toronto C15 - - - - 1 1 - - Toronto East 2 $708,000 $354,000 $354,000 1 1 97% 51 Toronto E01 - - - - - - - - Toronto E02 1 $493,000 $493,000 $493,000 - - 99% 46 Toronto E03 - - - - - - - - Toronto E04 1 $215,000 $215,000 $215,000 - - 94% 55 Toronto E05 - - - - - - - - Toronto E06 - - - - - - - - Toronto E07 - - - - - - - - Toronto E08 - - - - - - - - Toronto E09 - - - - 1 1 - - Toronto E10 - - - - - - - - Toronto E11 - - - - - - - - SUMMARY OF EXISTING HOME TRANSACTIONS CO-OP APARTMENT, JUNE 2014
- 21. Industrial Leasing July 2010Page 3 Toronto Real Estate Board Market Watch, June 2014 ALL TREB AREAS Sales 1 Dollar Volume 1 Average Price 1 Median Price 1 New Listings 2 Active Listings 3 Avg. SP/LP 4 Avg. DOM 5 TREB Total 8 $3,382,000 $422,750 $411,250 17 40 98% 54- - - - - - - - Halton Region - - - - 2 3 - - Burlington - - - - - 1 - - Halton Hills - - - - - - - - Milton - - - - - - - - Oakville - - - - 2 2 - -- - - - - - - - Peel Region - - - - 6 15 - - Brampton - - - - 4 8 - - Caledon - - - - 2 3 - - Mississauga - - - - - 4 - -- - - - - - - - City of Toronto - - - - 1 1 - - - - - - - - - - York Region - - - - - - - - Aurora - - - - - - - - E. Gwillimbury - - - - - - - - Georgina - - - - - - - - King - - - - - - - - Markham - - - - - - - - Newmarket - - - - - - - - Richmond Hill - - - - - - - - Vaughan - - - - - - - - Whitchurch-Stouffville - - - - - - - -- - - - - - - - Durham Region - - - - 1 1 - - Ajax - - - - - - - - Brock - - - - - - - - Clarington - - - - - - - - Oshawa - - - - - - - - Pickering - - - - 1 1 - - Scugog - - - - - - - - Uxbridge - - - - - - - - Whitby - - - - - - - -- - - - - - - - Dufferin County - - - - - - - - Orangeville - - - - - - - -- - - - - - - - Simcoe County 8 $3,382,000 $422,750 $411,250 7 20 98% 54 Adjala-Tosorontio - - - - - - - - Bradford West Gwillimbury - - - - - - - - Essa - - - - - - - - Innisfil - - - - - - - - New Tecumseth 8 $3,382,000 $422,750 $411,250 7 20 98% 54 ! TURN PAGE FOR CITY OF TORONTO TABLES OR CLICK HERE: SUMMARY OF EXISTING HOME TRANSACTIONS DETACHED CONDOMINIUM, JUNE 2014 21
- 22. Industrial Leasing July 2010Page 3 Toronto Real Estate Board Market Watch, June 2014 22 CITY OF TORONTO MUNICIPAL BREAKDOWN Sales1 Dollar Volume1 Average Price1 Median Price1 New Listings2 Active Listings3 Avg. SP/LP4 Avg. DOM5 TREB Total 8 $3,382,000 $422,750 $411,250 17 40 98% 54 City of Toronto Total - - - - 1 1 - - Toronto West - - - - - - - - Toronto W01 - - - - - - - - Toronto W02 - - - - - - - - Toronto W03 - - - - - - - - Toronto W04 - - - - - - - - Toronto W05 - - - - - - - - Toronto W06 - - - - - - - - Toronto W07 - - - - - - - - Toronto W08 - - - - - - - - Toronto W09 - - - - - - - - Toronto W10 - - - - - - - - Toronto Central - - - - - - - - Toronto C01 - - - - - - - - Toronto C02 - - - - - - - - Toronto C03 - - - - - - - - Toronto C04 - - - - - - - - Toronto C06 - - - - - - - - Toronto C07 - - - - - - - - Toronto C08 - - - - - - - - Toronto C09 - - - - - - - - Toronto C10 - - - - - - - - Toronto C11 - - - - - - - - Toronto C12 - - - - - - - - Toronto C13 - - - - - - - - Toronto C14 - - - - - - - - Toronto C15 - - - - - - - - Toronto East - - - - 1 1 - - Toronto E01 - - - - - - - - Toronto E02 - - - - - - - - Toronto E03 - - - - - - - - Toronto E04 - - - - 1 1 - - Toronto E05 - - - - - - - - Toronto E06 - - - - - - - - Toronto E07 - - - - - - - - Toronto E08 - - - - - - - - Toronto E09 - - - - - - - - Toronto E10 - - - - - - - - Toronto E11 - - - - - - - - SUMMARY OF EXISTING HOME TRANSACTIONS DETACHED CONDOMINIUM, JUNE 2014
- 23. Industrial Leasing July 2010Page 3 Toronto Real Estate Board Market Watch, June 2014 23 ALL TREB AREAS Sales 1 Dollar Volume 1 Average Price 1 Median Price 1 New Listings 2 Active Listings 3 Avg. SP/LP 4 Avg. DOM 5 TREB Total 6 $1,261,200 $210,200 $232,250 17 26 98% 48- - - - - - - - Halton Region - - - - - - - - Burlington - - - - - - - - Halton Hills - - - - - - - - Milton - - - - - - - - Oakville - - - - - - - -- - - - - - - - Peel Region - - - - - - - - Brampton - - - - - - - - Caledon - - - - - - - - Mississauga - - - - - - - -- - - - - - - - City of Toronto 6 $1,261,200 $210,200 $232,250 17 26 98% 48 - - - - - - - - York Region - - - - - - - - Aurora - - - - - - - - E. Gwillimbury - - - - - - - - Georgina - - - - - - - - King - - - - - - - - Markham - - - - - - - - Newmarket - - - - - - - - Richmond Hill - - - - - - - - Vaughan - - - - - - - - Whitchurch-Stouffville - - - - - - - -- - - - - - - - Durham Region - - - - - - - - Ajax - - - - - - - - Brock - - - - - - - - Clarington - - - - - - - - Oshawa - - - - - - - - Pickering - - - - - - - - Scugog - - - - - - - - Uxbridge - - - - - - - - Whitby - - - - - - - -- - - - - - - - Dufferin County - - - - - - - - Orangeville - - - - - - - -- - - - - - - - Simcoe County - - - - - - - - Adjala-Tosorontio - - - - - - - - Bradford West Gwillimbury - - - - - - - - Essa - - - - - - - - Innisfil - - - - - - - - New Tecumseth - - - - - - - - ! TURN PAGE FOR CITY OF TORONTO TABLES OR CLICK HERE: SUMMARY OF EXISTING HOME TRANSACTIONS CO-OWNERSHIP APARTMENT, JUNE 2014
- 24. Industrial Leasing July 2010Page 3 Toronto Real Estate Board Market Watch, June 2014 24 CITY OF TORONTO MUNICIPAL BREAKDOWN Sales1 Dollar Volume1 Average Price1 Median Price1 New Listings2 Active Listings3 Avg. SP/LP4 Avg. DOM5 TREB Total 6 $1,261,200 $210,200 $232,250 17 26 98% 48 City of Toronto Total 6 $1,261,200 $210,200 $232,250 17 26 98% 48 Toronto West 2 $216,000 $108,000 $108,000 3 9 97% 44 Toronto W01 - - - - - - - - Toronto W02 - - - - 1 1 - - Toronto W03 - - - - - - - - Toronto W04 - - - - - - - - Toronto W05 2 $216,000 $108,000 $108,000 2 8 97% 44 Toronto W06 - - - - - - - - Toronto W07 - - - - - - - - Toronto W08 - - - - - - - - Toronto W09 - - - - - - - - Toronto W10 - - - - - - - - Toronto Central 4 $1,045,200 $261,300 $246,750 13 16 98% 50 Toronto C01 - - - - 1 1 - - Toronto C02 2 $493,500 $246,750 $246,750 3 4 99% 58 Toronto C03 1 $328,700 $328,700 $328,700 1 1 97% 46 Toronto C04 - - - - 6 7 - - Toronto C06 - - - - - - - - Toronto C07 - - - - - - - - Toronto C08 - - - - - - - - Toronto C09 - - - - - - - - Toronto C10 - - - - - - - - Toronto C11 - - - - - - - - Toronto C12 - - - - - - - - Toronto C13 - - - - - 1 - - Toronto C14 1 $223,000 $223,000 $223,000 - 1 97% 38 Toronto C15 - - - - 2 1 - - Toronto East - - - - 1 1 - - Toronto E01 - - - - - - - - Toronto E02 - - - - 1 1 - - Toronto E03 - - - - - - - - Toronto E04 - - - - - - - - Toronto E05 - - - - - - - - Toronto E06 - - - - - - - - Toronto E07 - - - - - - - - Toronto E08 - - - - - - - - Toronto E09 - - - - - - - - Toronto E10 - - - - - - - - Toronto E11 - - - - - - - - SUMMARY OF EXISTING HOME TRANSACTIONS CO-OWNERSHIP APARTMENT, JUNE 2014
- 25. Industrial Leasing July 2010Page 3 Toronto Real Estate Board Market Watch, June 2014 25 FOCUS ON THE MLS® HOME PRICE INDEX INDEX AND BENCHMARK PRICE, JUNE 2014 ALL TREB AREAS Index Benchmark Yr./Yr. % Chg. Index Benchmark Yr./Yr. % Chg. Index Benchmark Yr./Yr. % Chg. Index Benchmark Yr./Yr. % Chg. Index Benchmark Yr./Yr. % Chg. TREB Total 167.9 $512,200 7.77% 169.1 $628,800 8.19% 174.6 $493,200 8.31% 163.5 $358,100 7.07% 156.7 $314,700 5.24% Halton Region 176.0 $577,300 7.19% 172.9 $641,200 6.60% 176.4 $457,800 7.82% 169.5 $335,500 3.67% - - - Burlington 183.4 $528,600 5.95% 179.4 $613,200 4.42% 182.1 $434,100 9.44% 179.9 $361,300 4.05% - - - Halton Hills 160.4 $467,000 4.50% 160.3 $512,800 5.05% 169.8 $418,200 6.73% 158.0 $284,900 0.13% - - - Milton 165.9 $465,300 7.66% 154.6 $538,600 6.18% 168.8 $421,400 7.58% - - - - - - Oakville 185.1 $682,900 7.12% 183.6 $760,900 6.87% 187.1 $506,400 7.41% 170.1 $375,700 4.48% - - - Peel Region 160.1 $437,900 6.10% 161.1 $545,300 6.06% 163.1 $416,200 6.46% 165.3 $342,100 6.17% 143.6 $247,100 4.06% Brampton 153.1 $390,500 5.81% 153.0 $447,200 5.15% 154.9 $364,900 5.73% 149.6 $277,900 5.58% 128.3 $200,800 4.56% Caledon 148.9 $530,500 2.27% 149.6 $549,100 2.12% 161.9 $400,300 4.25% - - - - - - Mississauga 166.5 $465,400 6.73% 173.0 $644,600 7.86% 172.5 $471,400 7.34% 170.4 $365,900 6.57% 146.4 $256,300 4.05% City of Toronto 171.8 $563,000 7.85% 178.5 $773,800 9.71% 185.5 $615,200 8.86% 167.3 $404,600 7.45% 159.6 $329,500 5.28% York Region 179.4 $615,600 9.66% 179.7 $706,000 9.11% 183.6 $531,900 10.14% 165.0 $420,600 7.28% 156.9 $340,900 5.30% Aurora 172.0 $553,800 10.33% 171.0 $635,300 10.54% 176.5 $456,800 11.08% 145.4 $368,300 2.32% 152.3 $316,400 4.32% E. Gwillimbury 155.1 $501,400 5.08% 155.7 $511,500 4.99% 166.4 $352,300 8.12% - - - - - - Georgina 155.1 $321,900 0.06% 160.7 $331,000 1.13% 168.9 $332,900 7.85% - - - - - - King 166.4 $705,400 7.70% 168.2 $709,700 7.96% - - - - - - - - - Markham 186.0 $640,700 10.91% 189.8 $780,500 10.67% 190.1 $566,100 11.82% 170.2 $422,800 7.79% 159.6 $369,100 5.70% Newmarket 163.5 $482,200 9.73% 161.1 $542,300 9.89% 168.9 $398,000 9.11% 163.4 $329,900 2.64% 153.1 $257,800 2.20% Richmond Hill 187.9 $680,300 9.56% 198.0 $838,900 10.00% 192.9 $584,300 8.74% 157.4 $445,000 8.85% 151.4 $315,400 2.99% Vaughan 177.8 $642,700 9.69% 170.3 $708,700 7.38% 181.7 $553,100 9.59% 174.3 $476,200 10.81% 159.3 $353,500 7.27% Whitchurch-Stouffville 177.2 $668,100 9.79% 176.9 $678,800 9.67% 159.1 $437,000 9.20% - - - - - - Durham Region 149.0 $350,600 7.97% 147.8 $385,400 7.33% 153.8 $308,000 7.85% 141.2 $232,100 10.75% 143.7 $257,100 12.53% Ajax 154.5 $381,800 8.42% 153.5 $411,100 6.89% 160.9 $346,000 7.77% 145.7 $266,300 12.86% 139.0 $236,000 11.92% Brock 132.6 $251,400 4.08% 133.2 $253,100 4.14% 144.1 $229,700 9.33% - - - - - - Clarington 145.5 $307,900 6.20% 141.2 $339,300 4.98% 149.4 $285,300 5.73% 163.4 $292,500 11.69% 144.7 $204,800 14.30% Oshawa 143.1 $273,900 7.59% 142.3 $303,000 7.56% 148.1 $248,000 7.71% 126.4 $169,100 10.78% 142.5 $170,500 8.37% Pickering 156.8 $424,200 10.58% 157.8 $493,600 10.35% 161.6 $376,700 10.23% 150.5 $271,500 11.73% 148.4 $290,600 14.77% Scugog 147.8 $383,600 7.26% 152.0 $391,400 7.27% 143.5 $300,300 16.67% - - - - - - Uxbridge 146.8 $448,900 8.90% 147.3 $456,200 8.15% 143.5 $352,100 9.96% - - - - - - Whitby 149.3 $389,600 7.33% 149.5 $429,500 7.40% 151.9 $335,100 8.04% 139.8 $256,300 4.48% 140.0 $273,100 9.29% Dufferin County 155.0 $355,200 6.02% 159.4 $363,200 6.41% 152.4 $285,700 3.81% - - - - - - Orangeville 155.0 $355,200 6.02% 159.4 $363,200 6.41% 152.4 $285,700 3.81% - - - - - - Simcoe County 149.1 $316,900 4.19% 144.8 $319,400 3.35% 155.2 $298,000 5.94% - - - - - - Adjala-Tosorontio 134.5 $423,600 6.32% 134.4 $423,800 6.25% - - - - - - - - - Bradford West Gwillimbury 165.4 $411,100 6.71% 149.8 $458,900 7.15% 169.7 $352,800 6.06% - - - - - - Essa 146.4 $332,000 4.42% 143.9 $355,900 5.11% 147.9 $252,000 3.57% - - - - - - Innisfil 147.1 $272,500 1.45% 147.5 $273,800 0.82% 158.1 $245,900 8.29% - - - - - - New Tecumseth 136.3 $314,800 4.93% 133.1 $342,800 4.72% 142.7 $273,000 5.70% - - - - - - Townhouse Apartment ! TURN PAGE FOR CITY OF TORONTO TABLES OR CLICK HERE: Composite Single-Family Detached Single-Family Attached CLICK HERE FOR MORE BACKGROUND INFORMATION ON THE MLS® HPI
- 26. Industrial Leasing July 2010Page 3 Toronto Real Estate Board Market Watch, June 2014 26 FOCUS ON THE MLS® HOME PRICE INDEX INDEX AND BENCHMARK PRICE, JUNE 2014 CITY OF TORONTO Index Benchmark Yr./Yr. % Chg. Index Benchmark Yr./Yr. % Chg. Index Benchmark Yr./Yr. % Chg. Index Benchmark Yr./Yr. % Chg. Index Benchmark Yr./Yr. % Chg. TREB Total 167.9 $512,200 7.77% 169.1 $628,800 8.19% 174.6 $493,200 8.31% 163.5 $358,100 7.07% 156.7 $314,700 5.24% City of Toronto 171.8 $563,000 7.85% 178.5 $773,800 9.71% 185.5 $615,200 8.86% 167.3 $404,600 7.45% 159.6 $329,500 5.28% Toronto W01 168.6 $688,000 2.00% 172.8 $890,600 5.88% 183.7 $708,800 5.33% 212.6 $437,800 -1.30% 142.5 $332,500 -2.20% Toronto W02 191.6 $691,100 4.53% 193.3 $793,400 6.50% 219.0 $670,900 6.78% 153.6 $423,500 7.34% 133.2 $553,600 7.25% Toronto W03 183.0 $472,700 12.68% 186.9 $508,300 13.14% 188.6 $483,200 11.53% - - - 134.6 $249,700 10.60% Toronto W04 159.0 $416,300 11.19% 168.0 $530,100 11.63% 164.4 $478,700 13.38% 139.6 $339,600 -2.79% 138.9 $204,600 10.41% Toronto W05 147.2 $350,500 5.75% 162.2 $540,700 9.45% 150.2 $439,300 7.98% 138.4 $227,800 8.13% 124.1 $163,000 -5.05% Toronto W06 155.2 $450,500 3.26% 188.1 $597,000 8.48% 158.4 $480,300 0.96% 162.7 $479,400 1.62% 126.4 $312,600 -1.33% Toronto W07 170.0 $724,500 9.11% 177.0 $765,000 8.39% 165.3 $677,800 4.16% 136.4 $501,400 10.18% 110.0 $446,100 8.37% Toronto W08 149.2 $607,000 5.82% 163.6 $855,700 6.65% 168.7 $633,700 3.50% 146.4 $357,900 6.63% 132.8 $267,300 5.82% Toronto W09 153.6 $394,700 8.17% 170.2 $636,800 7.59% 158.2 $447,800 9.86% 145.3 $368,600 0.28% 125.4 $160,800 7.18% Toronto W10 147.1 $341,400 6.59% 159.8 $470,200 7.25% 156.7 $425,800 5.88% 132.6 $238,900 14.61% 127.9 $195,300 1.99% Toronto C01 189.0 $468,800 5.53% 205.7 $726,100 6.09% 211.3 $733,100 6.13% 178.9 $536,900 4.44% 185.1 $385,200 5.29% Toronto C02 186.6 $886,000 9.83% 173.0 $1,371,200 9.01% 194.5 $1,023,400 7.28% 191.2 $894,100 8.39% 183.1 $510,600 12.06% Toronto C03 190.6 $981,000 9.86% 188.6 $1,136,600 11.93% 193.9 $717,800 7.66% - - - 188.1 $496,900 4.33% Toronto C04 171.3 $1,061,300 8.14% 175.4 $1,226,100 7.74% 173.3 $828,500 5.41% 159.4 $595,500 6.20% 152.7 $363,000 10.41% Toronto C06 178.5 $706,400 6.57% 179.9 $770,000 5.27% 158.9 $584,400 2.52% 151.7 $413,900 10.41% 180.6 $399,300 9.99% Toronto C07 166.4 $571,500 5.58% 190.4 $871,600 8.30% 164.5 $584,600 3.65% 142.9 $419,500 8.59% 149.5 $352,200 1.77% Toronto C08 177.8 $457,800 7.43% 152.6 $474,300 -5.04% 183.3 $758,700 10.09% 185.1 $561,300 1.82% 178.0 $392,600 7.81% Toronto C09 135.5 $1,006,200 3.83% 125.6 $1,577,700 0.00% 149.9 $1,219,800 3.88% 181.3 $935,800 12.89% 140.1 $464,200 7.03% Toronto C10 195.2 $761,400 7.79% 185.6 $1,138,900 12.83% 187.1 $924,100 8.40% 234.5 $537,800 4.08% 199.8 $478,700 8.12% Toronto C11 164.9 $590,900 13.96% 171.9 $1,150,900 10.76% 199.1 $873,600 14.03% 114.3 $182,300 -0.44% 157.8 $224,600 18.29% Toronto C12 159.7 $1,368,600 5.00% 151.6 $1,629,300 4.48% 179.5 $775,600 6.15% 170.1 $576,200 14.08% 179.5 $564,600 2.69% Toronto C13 160.8 $593,200 5.79% 177.0 $948,400 10.28% 164.2 $526,800 10.28% 167.9 $478,100 17.74% 141.5 $280,000 -2.14% Toronto C14 178.2 $605,600 7.03% 203.5 $1,104,100 10.84% 187.6 $915,200 3.42% 222.8 $752,800 9.70% 165.2 $415,400 4.89% Toronto C15 171.3 $572,700 10.30% 198.2 $929,100 13.78% 182.4 $595,200 12.59% 179.6 $442,500 8.85% 140.8 $329,100 5.86% Toronto E01 204.7 $635,800 11.43% 199.8 $673,100 12.50% 212.8 $667,600 13.37% 218.7 $442,200 3.31% 191.1 $453,300 7.18% Toronto E02 188.2 $700,100 10.19% 172.5 $759,700 6.81% 198.2 $661,000 11.29% 170.5 $570,000 0.06% 180.9 $478,700 8.52% Toronto E03 173.4 $534,100 9.82% 176.8 $594,000 11.62% 173.8 $566,000 6.82% - - - 136.5 $204,200 5.00% Toronto E04 173.5 $435,600 11.43% 180.7 $533,600 12.31% 176.0 $427,000 10.69% 169.2 $365,700 7.36% 168.0 $254,500 10.02% Toronto E05 165.4 $442,300 9.75% 185.7 $655,700 12.07% 183.5 $505,800 11.96% 166.4 $361,700 10.05% 141.4 $277,800 5.68% Toronto E06 186.2 $526,200 9.47% 187.6 $536,200 9.77% 189.9 $449,200 7.90% - - - 165.1 $364,100 8.33% Toronto E07 179.6 $442,800 13.74% 198.7 $650,300 18.49% 191.9 $501,600 17.95% 178.4 $385,800 11.78% 156.0 $267,100 8.79% Toronto E08 165.5 $405,600 9.82% 179.2 $559,400 10.21% 161.3 $412,800 4.60% 165.8 $335,600 9.15% 137.5 $219,500 10.53% Toronto E09 159.9 $386,100 8.48% 173.9 $494,900 11.05% 162.9 $399,800 9.33% 156.0 $287,500 12.47% 144.1 $270,300 4.19% Toronto E10 169.6 $480,200 10.20% 171.2 $548,000 9.74% 168.1 $437,200 7.48% 173.3 $303,500 14.54% 131.5 $211,900 11.16% Toronto E11 159.6 $351,900 12.79% 178.8 $496,500 11.61% 171.6 $389,400 12.01% 128.1 $251,700 13.16% 131.7 $196,600 18.76% ApartmentComposite Single-Family Detached Single-Family Attached Townhouse CLICK HERE FOR MORE BACKGROUND INFORMATION ON THE MLS® HPI
- 27. July 2010Page 3 Toronto Real Estate Board Market Watch, June 2014 27 YEAR SALES AVERAGE PRICE 2003 78,898 $293,067 2004 83,501 $315,231 2005 84,145 $335,907 2006 83,084 $351,941 2007 93,193 $376,236 2008 74,552 $379,347 2009 87,308 $395,460 2010 85,545 $431,276 2011 89,096 $465,014 2012 85,496 $497,130 2013 87,058 $523,007 January 4,229 $482,080 February 5,613 $509,396 March 7,537 $517,232 April 9,535 $524,868 May 9,946 $540,544 June 8,821 $529,614 July 8,367 $512,286 August 7,391 $501,677 September 7,258 $532,631 October 7,946 $539,443 November 6,356 $538,841 December 4,059 $520,260 Annual 87,058 $523,007 January 4,103 $526,965 February 5,697 $552,857 March 8,055 $557,881 April 9,674 $578,236 May 11,049 $585,454 June 10,180 $568,953 July - - August - - September - - October - - November - - December - - Year-to-Date 48,758 $567,291 HISTORIC ANNUAL STATISTICS1,6,7 2014 MONTHLY STATISTICS1,7 2013 MONTHLY STATISTICS1,7 *For historic annual sales and average price data over a longer time frame go to: http://www.torontorealestateboard.com/market_news/market_watch/histori c_stats/pdf/TREB_historic_statistics.pdf NOTES 8 SNLR = Sales-to-New Listings Ratio. Calculated using a 12-month moving average (sales/new listings). 9 Mos. Inv. = Months of Inventory. Calculated using a 12-month moving average (active listings/sales). 7 Past monthly and year-to-date figures are revised on a monthly basis. 1 Sales, dollar volume, average sale prices and median sale prices are based on firm transactions entered into the TorontoMLS® system between the first and last day of the month/period being reported. 2 New listings entered into the TorontoMLS® system between the first and last day of the month/period being reported. 3 Active listings at the end of the last day of the month/period being reported. 4 Ratio of the average selling price to the average listing price for firm transactions entered into the TorontoMLS® system between the first and last day of the month/period being reported. 5 Average number of days on the market for firm transactions entered into the TorontoMLS® system between the first and last day of the month/period being reported. 6 Due to past changes to TREB's service area, caution should be exercised when making historical comparisons. Copyright® 2014 Toronto Real Estate Board