SlideShare une entreprise Scribd logo
1  sur  69
Télécharger pour lire hors ligne
Community Housing Market Report
City of Toronto: Central
First Quarter 2013
First Quarter 2013
Toronto Real Estate Board
*The source for all slides is the Toronto Real Estate Board. Some statistics are not reported when the number of transactions is two (2) or less.
Statistics are updated on a monthly basis. Quarterly community statistics in this report may not match quarterly sums calculated from past TREB publications.
1
ALL HOME TYPES, FIRST QUARTER 2013
TORONTO C01 COMMUNITY BREAKDOWN
Sales Dollar Volume Average Price Median Price New Listings Active Listings Avg. SP/LP Avg. DOM
Toronto C01 772 $353,952,372 $458,488 $393,900 2,169 1,272 98% 32
Dufferin Grove 16 $6,717,000 $419,813 $372,500 31 13 97% 27
Palmerston-Little Italy 18 $16,111,500 $895,083 $814,000 35 19 97% 32
University 11 $10,342,266 $940,206 $1,000,000 21 11 97% 23
Bay Street Corridor 127 $60,216,465 $474,145 $405,000 311 190 98% 33
Kensington-Chinatown 19 $8,584,800 $451,832 $425,000 49 36 98% 30
Trinity-Bellwoods 33 $21,562,172 $653,399 $670,000 50 26 102% 38
Little Portugal 37 $16,605,687 $448,802 $380,000 73 31 100% 30
Niagara 188 $75,842,039 $403,415 $367,500 508 268 99% 28
Waterfront Communities C1 323 $137,970,443 $427,153 $380,000 1,091 678 98% 34
The Islands 0 - - - 0 0 - -
SUMMARY OF EXISTING HOME TRANSACTIONS
Toronto C01 Community Breakdown
First Quarter 2013
Toronto Real Estate Board
*The source for all slides is the Toronto Real Estate Board. Some statistics are not reported when the number of transactions is two (2) or less.
Statistics are updated on a monthly basis. Quarterly community statistics in this report may not match quarterly sums calculated from past TREB publications.
2
2
4
0
3
7
0
Number of Transactions*
$595
$389
$305
$617
$380
$315
Average/Median Selling Price (,000s)* Average Selling Price
MedianSelling Price
4
9
0
6
12
0
Number of New Listings*
50%
44%
0%
50%
58%
0%
Sales-to-New Listings Ratio*
22
16
34
Average Days on Market*
95% 98% 97%
Average Sale Price to List Price Ratio*
Toronto C01: Dufferin Grove
First Quarter 2013
Toronto Real Estate Board
*The source for all slides is the Toronto Real Estate Board. Some statistics are not reported when the number of transactions is two (2) or less.
Statistics are updated on a monthly basis. Quarterly community statistics in this report may not match quarterly sums calculated from past TREB publications.
3
1
12
2
0
3
0
Number of Transactions*
$919
$747$787
$540
Average/Median Selling Price (,000s)* Average Selling Price
MedianSelling Price
5
15
4
1
10
0
Number of New Listings*
20%
80%
50%
0%
30%
0%
Sales-to-New Listings Ratio*
28
66
Average Days on Market*
97% 91%
Average Sale Price to List Price Ratio*
Toronto C01: Palmerston-Little Italy
First Quarter 2013
Toronto Real Estate Board
*The source for all slides is the Toronto Real Estate Board. Some statistics are not reported when the number of transactions is two (2) or less.
Statistics are updated on a monthly basis. Quarterly community statistics in this report may not match quarterly sums calculated from past TREB publications.
4
1
5
2
0
3
0
Number of Transactions*
$1,041
$547
$1,065
$503
Average/Median Selling Price (,000s)* Average Selling Price
MedianSelling Price
0
7
5
0
9
0
Number of New Listings*
0%
71%
40%
0%
33%
0%
Sales-to-New Listings Ratio*
15
35
Average Days on Market*
99% 96%
Average Sale Price to List Price Ratio*
Toronto C01: University
First Quarter 2013
Toronto Real Estate Board
*The source for all slides is the Toronto Real Estate Board. Some statistics are not reported when the number of transactions is two (2) or less.
Statistics are updated on a monthly basis. Quarterly community statistics in this report may not match quarterly sums calculated from past TREB publications.
5
0 0 0 0
127
0
Number of Transactions*
$474
$405
Average/Median Selling Price (,000s)* Average Selling Price
MedianSelling Price
0 0 0 0
311
0
Number of New Listings*
0% 0% 0% 0%
41%
0%
Sales-to-New Listings Ratio*
33
Average Days on Market*
98%
Average Sale Price to List Price Ratio*
Toronto C01: Bay Street Corridor
First Quarter 2013
Toronto Real Estate Board
*The source for all slides is the Toronto Real Estate Board. Some statistics are not reported when the number of transactions is two (2) or less.
Statistics are updated on a monthly basis. Quarterly community statistics in this report may not match quarterly sums calculated from past TREB publications.
6
1 1
0
4
13
0
Number of Transactions*
$394
$424
$367
$425
Average/Median Selling Price (,000s)* Average Selling Price
MedianSelling Price
1 2 1
5
40
0
Number of New Listings*
100%
50%
0%
80%
33%
0%
Sales-to-New Listings Ratio*
35
24
Average Days on Market*
99% 98%
Average Sale Price to List Price Ratio*
Toronto C01: Kensington-Chinatown
First Quarter 2013
Toronto Real Estate Board
*The source for all slides is the Toronto Real Estate Board. Some statistics are not reported when the number of transactions is two (2) or less.
Statistics are updated on a monthly basis. Quarterly community statistics in this report may not match quarterly sums calculated from past TREB publications.
7
1
7 8
1
16
0
Number of Transactions*
$895
$768
$473
$940
$746
$432
Average/Median Selling Price (,000s)* Average Selling Price
MedianSelling Price
1
19
10
1
19
0
Number of New Listings*
100%
37%
80%
100%
84%
0%
Sales-to-New Listings Ratio*
17
21
50
Average Days on Market*
105% 103% 100%
Average Sale Price to List Price Ratio*
Toronto C01: Trinity-Bellwoods
First Quarter 2013
Toronto Real Estate Board
*The source for all slides is the Toronto Real Estate Board. Some statistics are not reported when the number of transactions is two (2) or less.
Statistics are updated on a monthly basis. Quarterly community statistics in this report may not match quarterly sums calculated from past TREB publications.
8
1
5
2
4
25
0
Number of Transactions*
$661
$535
$361
$650
$537
$332
Average/Median Selling Price (,000s)* Average Selling Price
MedianSelling Price
3 6 4 4
56
0
Number of New Listings*
33%
83%
50%
100%
45%
0%
Sales-to-New Listings Ratio*
12
30
36
Average Days on Market*
104% 99% 99%
Average Sale Price to List Price Ratio*
Toronto C01: Little Portugal
First Quarter 2013
Toronto Real Estate Board
*The source for all slides is the Toronto Real Estate Board. Some statistics are not reported when the number of transactions is two (2) or less.
Statistics are updated on a monthly basis. Quarterly community statistics in this report may not match quarterly sums calculated from past TREB publications.
9
1 3 4
26
154
0
Number of Transactions*
$772 $783
$432
$379
$678
$795
$452
$354
Average/Median Selling Price (,000s)* Average Selling Price
MedianSelling Price
0 5 7
39
455
2
Number of New Listings*
0%
60% 57%
67%
34%
0%
Sales-to-New Listings Ratio*
17
4
26
28
Average Days on Market*
99%
106%
98% 98%
Average Sale Price to List Price Ratio*
Toronto C01: Niagara
First Quarter 2013
Toronto Real Estate Board
*The source for all slides is the Toronto Real Estate Board. Some statistics are not reported when the number of transactions is two (2) or less.
Statistics are updated on a monthly basis. Quarterly community statistics in this report may not match quarterly sums calculated from past TREB publications.
10
0 0 0 2
321
0
Number of Transactions*
$426
$379
Average/Median Selling Price (,000s)* Average Selling Price
MedianSelling Price
2 0 0 11
1075
3
Number of New Listings*
0% 0% 0%
18%
30%
0%
Sales-to-New Listings Ratio*
35
Average Days on Market*
98%
Average Sale Price to List Price Ratio*
Toronto C01: Waterfront Communities C1
First Quarter 2013
Toronto Real Estate Board
*The source for all slides is the Toronto Real Estate Board. Some statistics are not reported when the number of transactions is two (2) or less.
Statistics are updated on a monthly basis. Quarterly community statistics in this report may not match quarterly sums calculated from past TREB publications.
11
0 0 0 0 0 0
Number of Transactions* Average/Median Selling Price (,000s)* Average Selling Price
MedianSelling Price
0 0 0 0 0 0
Number of New Listings*
0% 0% 0% 0% 0% 0%
Sales-to-New Listings Ratio*
Average Days on Market* Average Sale Price to List Price Ratio*
Toronto C01: The Islands
First Quarter 2013
Toronto Real Estate Board
*The source for all slides is the Toronto Real Estate Board. Some statistics are not reported when the number of transactions is two (2) or less.
Statistics are updated on a monthly basis. Quarterly community statistics in this report may not match quarterly sums calculated from past TREB publications.
12
ALL HOME TYPES, FIRST QUARTER 2013
TORONTO C02 COMMUNITY BREAKDOWN
Sales Dollar Volume Average Price Median Price New Listings Active Listings Avg. SP/LP Avg. DOM
Toronto C02 122 $124,483,900 $1,020,360 $851,000 377 253 98% 27
Yonge-St. Clair 36 $39,962,700 $1,110,075 $942,000 65 36 97% 32
Casa Loma 16 $19,388,950 $1,211,809 $1,199,000 69 43 97% 31
Wychwood 13 $10,756,500 $827,423 $725,000 26 10 103% 10
Annex 57 $54,375,750 $953,961 $785,000 217 164 97% 26
SUMMARY OF EXISTING HOME TRANSACTIONS
Toronto C02 Community Breakdown
First Quarter 2013
Toronto Real Estate Board
*The source for all slides is the Toronto Real Estate Board. Some statistics are not reported when the number of transactions is two (2) or less.
Statistics are updated on a monthly basis. Quarterly community statistics in this report may not match quarterly sums calculated from past TREB publications.
13
5
9
2
0
19
1
Number of Transactions*
$2,212
$1,661
$600
$1,979
$1,650
$545
Average/Median Selling Price (,000s)* Average Selling Price
MedianSelling Price
11 11
4
0
37
2
Number of New Listings*
45%
82%
50%
0%
51% 50%
Sales-to-New Listings Ratio*
25
13
39
Average Days on Market*
99% 96% 98%
Average Sale Price to List Price Ratio*
Toronto C02: Yonge-St. Clair
First Quarter 2013
Toronto Real Estate Board
*The source for all slides is the Toronto Real Estate Board. Some statistics are not reported when the number of transactions is two (2) or less.
Statistics are updated on a monthly basis. Quarterly community statistics in this report may not match quarterly sums calculated from past TREB publications.
14
5
2 2
0
7
0
Number of Transactions*
$1,317
$1,014
$1,335
$875
Average/Median Selling Price (,000s)* Average Selling Price
MedianSelling Price
19
6 5 3
36
0
Number of New Listings*
26%
33%
40%
0%
19%
0%
Sales-to-New Listings Ratio*
33
40
Average Days on Market*
96% 98%
Average Sale Price to List Price Ratio*
Toronto C02: Casa Loma
First Quarter 2013
Toronto Real Estate Board
*The source for all slides is the Toronto Real Estate Board. Some statistics are not reported when the number of transactions is two (2) or less.
Statistics are updated on a monthly basis. Quarterly community statistics in this report may not match quarterly sums calculated from past TREB publications.
15
7
4
2
0 0 0
Number of Transactions*
$971
$764
$862
$673
Average/Median Selling Price (,000s)* Average Selling Price
MedianSelling Price
15
6
1
0 0
4
Number of New Listings*
47%
67%
200%
0% 0% 0%
Sales-to-New Listings Ratio*
9
7
Average Days on Market*
105% 102%
Average Sale Price to List Price Ratio*
Toronto C02: Wychwood
First Quarter 2013
Toronto Real Estate Board
*The source for all slides is the Toronto Real Estate Board. Some statistics are not reported when the number of transactions is two (2) or less.
Statistics are updated on a monthly basis. Quarterly community statistics in this report may not match quarterly sums calculated from past TREB publications.
16
7 9
5
2
34
0
Number of Transactions*
$1,323 $1,293
$861
$784
$1,110
$990
$840
$663
Average/Median Selling Price (,000s)* Average Selling Price
MedianSelling Price
20 24
8 12
153
0
Number of New Listings*
35% 38%
63%
17%
22%
0%
Sales-to-New Listings Ratio*
13
30
27
30
Average Days on Market*
97% 100% 97% 95%
Average Sale Price to List Price Ratio*
Toronto C02: Annex
First Quarter 2013
Toronto Real Estate Board
*The source for all slides is the Toronto Real Estate Board. Some statistics are not reported when the number of transactions is two (2) or less.
Statistics are updated on a monthly basis. Quarterly community statistics in this report may not match quarterly sums calculated from past TREB publications.
17
ALL HOME TYPES, FIRST QUARTER 2013
TORONTO C03 COMMUNITY BREAKDOWN
Sales Dollar Volume Average Price Median Price New Listings Active Listings Avg. SP/LP Avg. DOM
Toronto C03 101 $87,857,029 $869,872 $680,216 212 104 99% 22
Humewood-Cedarvale 26 $22,329,004 $858,808 $766,000 40 12 100% 12
Oakwood-Vaughan 33 $16,190,866 $490,632 $451,000 55 20 99% 26
Forest Hill South 21 $28,476,000 $1,356,000 $1,165,000 79 59 95% 37
Yonge-Eglinton 21 $20,861,159 $993,389 $976,000 38 13 103% 11
SUMMARY OF EXISTING HOME TRANSACTIONS
Toronto C03 Community Breakdown
First Quarter 2013
Toronto Real Estate Board
*The source for all slides is the Toronto Real Estate Board. Some statistics are not reported when the number of transactions is two (2) or less.
Statistics are updated on a monthly basis. Quarterly community statistics in this report may not match quarterly sums calculated from past TREB publications.
18
20
4
0 0 0
2
Number of Transactions*
$962
$660
$901
$668
Average/Median Selling Price (,000s)* Average Selling Price
MedianSelling Price
32
3
0 0 0
5
Number of New Listings*
63%
133%
0% 0% 0%
40%
Sales-to-New Listings Ratio*
12
14
Average Days on Market*
100% 105%
Average Sale Price to List Price Ratio*
Toronto C03: Humewood-Cedarvale
First Quarter 2013
Toronto Real Estate Board
*The source for all slides is the Toronto Real Estate Board. Some statistics are not reported when the number of transactions is two (2) or less.
Statistics are updated on a monthly basis. Quarterly community statistics in this report may not match quarterly sums calculated from past TREB publications.
19
22
11
0 0 0 0
Number of Transactions*
$503
$466$463
$438
Average/Median Selling Price (,000s)* Average Selling Price
MedianSelling Price
33
21
1 0 0 0
Number of New Listings*
67%
52%
0% 0% 0% 0%
Sales-to-New Listings Ratio*
28
21
Average Days on Market*
98% 102%
Average Sale Price to List Price Ratio*
Toronto C03: Oakwood-Vaughan
First Quarter 2013
Toronto Real Estate Board
*The source for all slides is the Toronto Real Estate Board. Some statistics are not reported when the number of transactions is two (2) or less.
Statistics are updated on a monthly basis. Quarterly community statistics in this report may not match quarterly sums calculated from past TREB publications.
20
11
0 0
3
6
1
Number of Transactions*
$2,156
$665
$400
$2,100
$460 $395
Average/Median Selling Price (,000s)* Average Selling Price
MedianSelling Price
51
2 0
6
17
3
Number of New Listings*
22%
0% 0%
50%
35% 33%
Sales-to-New Listings Ratio*
48
23
28
Average Days on Market*
95% 93% 100%
Average Sale Price to List Price Ratio*
Toronto C03: Forest Hill South
First Quarter 2013
Toronto Real Estate Board
*The source for all slides is the Toronto Real Estate Board. Some statistics are not reported when the number of transactions is two (2) or less.
Statistics are updated on a monthly basis. Quarterly community statistics in this report may not match quarterly sums calculated from past TREB publications.
21
13
7
0 0
1
0
Number of Transactions*
$1,111
$851
$1,170
$880
Average/Median Selling Price (,000s)* Average Selling Price
MedianSelling Price
20
10
2 2
4
0
Number of New Listings*
65%
70%
0% 0%
25%
0%
Sales-to-New Listings Ratio*
8
15
Average Days on Market*
103% 103%
Average Sale Price to List Price Ratio*
Toronto C03: Yonge-Eglinton
First Quarter 2013
Toronto Real Estate Board
*The source for all slides is the Toronto Real Estate Board. Some statistics are not reported when the number of transactions is two (2) or less.
Statistics are updated on a monthly basis. Quarterly community statistics in this report may not match quarterly sums calculated from past TREB publications.
22
ALL HOME TYPES, FIRST QUARTER 2013
TORONTO C04 COMMUNITY BREAKDOWN
Sales Dollar Volume Average Price Median Price New Listings Active Listings Avg. SP/LP Avg. DOM
Toronto C04 214 $236,222,665 $1,103,844 $1,049,658 471 213 99% 22
Englemount-Lawrence 33 $21,889,000 $663,303 $675,000 66 38 98% 30
Bedford Park-Nortown 85 $105,850,928 $1,245,305 $1,200,000 212 94 99% 26
Lawrence Park North 42 $45,695,019 $1,087,977 $1,009,500 73 23 100% 13
Lawrence Park South 36 $43,776,300 $1,216,008 $1,062,450 78 36 98% 16
Forest Hill North 18 $19,011,418 $1,056,190 $1,199,509 42 22 97% 23
SUMMARY OF EXISTING HOME TRANSACTIONS
Toronto C04 Community Breakdown
First Quarter 2013
Toronto Real Estate Board
*The source for all slides is the Toronto Real Estate Board. Some statistics are not reported when the number of transactions is two (2) or less.
Statistics are updated on a monthly basis. Quarterly community statistics in this report may not match quarterly sums calculated from past TREB publications.
23
19
0 0
2
12
0
Number of Transactions*
$858
$397
$812
$352
Average/Median Selling Price (,000s)* Average Selling Price
MedianSelling Price
34
0 1
4
24
3
Number of New Listings*
56%
0% 0%
50% 50%
0%
Sales-to-New Listings Ratio*
20
44
Average Days on Market*
98% 97%
Average Sale Price to List Price Ratio*
Toronto C04: Englemount-Lawrence
First Quarter 2013
Toronto Real Estate Board
*The source for all slides is the Toronto Real Estate Board. Some statistics are not reported when the number of transactions is two (2) or less.
Statistics are updated on a monthly basis. Quarterly community statistics in this report may not match quarterly sums calculated from past TREB publications.
24
63
1 0 0
21
0
Number of Transactions*
$1,490
$531
$1,485
$475
Average/Median Selling Price (,000s)* Average Selling Price
MedianSelling Price
169
2 4 0
37
0
Number of New Listings*
37%
50%
0% 0%
57%
0%
Sales-to-New Listings Ratio*
22
37
Average Days on Market*
100% 98%
Average Sale Price to List Price Ratio*
Toronto C04: Bedford Park-Nortown
First Quarter 2013
Toronto Real Estate Board
*The source for all slides is the Toronto Real Estate Board. Some statistics are not reported when the number of transactions is two (2) or less.
Statistics are updated on a monthly basis. Quarterly community statistics in this report may not match quarterly sums calculated from past TREB publications.
25
31
8
0 1 2
0
Number of Transactions*
$1,222
$796
$1,150
$771
Average/Median Selling Price (,000s)* Average Selling Price
MedianSelling Price
55
10
2 2 4
0
Number of New Listings*
56%
80%
0%
50% 50%
0%
Sales-to-New Listings Ratio*
14
5
Average Days on Market*
99% 104%
Average Sale Price to List Price Ratio*
Toronto C04: Lawrence Park North
First Quarter 2013
Toronto Real Estate Board
*The source for all slides is the Toronto Real Estate Board. Some statistics are not reported when the number of transactions is two (2) or less.
Statistics are updated on a monthly basis. Quarterly community statistics in this report may not match quarterly sums calculated from past TREB publications.
26
26
2
0 0
8
0
Number of Transactions*
$1,476
$482
$1,363
$473
Average/Median Selling Price (,000s)* Average Selling Price
MedianSelling Price
55
5
0 0
18
0
Number of New Listings*
47%
40%
0% 0%
44%
0%
Sales-to-New Listings Ratio*
15
22
Average Days on Market*
97% 99%
Average Sale Price to List Price Ratio*
Toronto C04: Lawrence Park South
First Quarter 2013
Toronto Real Estate Board
*The source for all slides is the Toronto Real Estate Board. Some statistics are not reported when the number of transactions is two (2) or less.
Statistics are updated on a monthly basis. Quarterly community statistics in this report may not match quarterly sums calculated from past TREB publications.
27
13
0
1
0
1
3
Number of Transactions*
$1,332
$286
$1,295
$273
Average/Median Selling Price (,000s)* Average Selling Price
MedianSelling Price
22
0
3
0
7
10
Number of New Listings*
59%
0%
33%
0%
14%
30%
Sales-to-New Listings Ratio*
16
53
Average Days on Market*
96%
104%
Average Sale Price to List Price Ratio*
Toronto C04: Forest Hill North
First Quarter 2013
Toronto Real Estate Board
*The source for all slides is the Toronto Real Estate Board. Some statistics are not reported when the number of transactions is two (2) or less.
Statistics are updated on a monthly basis. Quarterly community statistics in this report may not match quarterly sums calculated from past TREB publications.
28
ALL HOME TYPES, FIRST QUARTER 2013
TORONTO C06 COMMUNITY BREAKDOWN
Sales Dollar Volume Average Price Median Price New Listings Active Listings Avg. SP/LP Avg. DOM
Toronto C06 62 $39,312,089 $634,066 $668,000 164 101 97% 30
Bathurst Manor 24 $14,804,671 $616,861 $647,500 55 31 98% 24
Clanton Park 38 $24,507,418 $644,932 $699,500 109 70 97% 33
SUMMARY OF EXISTING HOME TRANSACTIONS
Toronto C06 Community Breakdown
First Quarter 2013
Toronto Real Estate Board
*The source for all slides is the Toronto Real Estate Board. Some statistics are not reported when the number of transactions is two (2) or less.
Statistics are updated on a monthly basis. Quarterly community statistics in this report may not match quarterly sums calculated from past TREB publications.
29
16
1 0 1
6
0
Number of Transactions*
$734
$357
$675
$360
Average/Median Selling Price (,000s)* Average Selling Price
MedianSelling Price
34
1 0 2
18
0
Number of New Listings*
47%
100%
0%
50%
33%
0%
Sales-to-New Listings Ratio*
24
29
Average Days on Market*
98% 98%
Average Sale Price to List Price Ratio*
Toronto C06: Bathurst Manor
First Quarter 2013
Toronto Real Estate Board
*The source for all slides is the Toronto Real Estate Board. Some statistics are not reported when the number of transactions is two (2) or less.
Statistics are updated on a monthly basis. Quarterly community statistics in this report may not match quarterly sums calculated from past TREB publications.
30
22
0 0 0
16
0
Number of Transactions*
$892
$305
$813
$294
Average/Median Selling Price (,000s)* Average Selling Price
MedianSelling Price
42
0 0 0
67
0
Number of New Listings*
52%
0% 0% 0%
24%
0%
Sales-to-New Listings Ratio*
25
45
Average Days on Market*
97% 97%
Average Sale Price to List Price Ratio*
Toronto C06: Clanton Park
First Quarter 2013
Toronto Real Estate Board
*The source for all slides is the Toronto Real Estate Board. Some statistics are not reported when the number of transactions is two (2) or less.
Statistics are updated on a monthly basis. Quarterly community statistics in this report may not match quarterly sums calculated from past TREB publications.
31
ALL HOME TYPES, FIRST QUARTER 2013
TORONTO C07 COMMUNITY BREAKDOWN
Sales Dollar Volume Average Price Median Price New Listings Active Listings Avg. SP/LP Avg. DOM
Toronto C07 221 $119,952,523 $542,772 $406,000 538 296 98% 32
Westminster-Branson 49 $19,734,135 $402,737 $342,000 110 61 98% 30
Newtonbrook West 63 $34,339,200 $545,067 $499,900 137 69 98% 31
Willowdale West 66 $36,988,638 $560,434 $402,375 176 97 97% 32
Lansing-Westgate 43 $28,890,550 $671,873 $449,000 115 69 99% 36
SUMMARY OF EXISTING HOME TRANSACTIONS
Toronto C07 Community Breakdown
First Quarter 2013
Toronto Real Estate Board
*The source for all slides is the Toronto Real Estate Board. Some statistics are not reported when the number of transactions is two (2) or less.
Statistics are updated on a monthly basis. Quarterly community statistics in this report may not match quarterly sums calculated from past TREB publications.
32
$747
$537
$386
$296
$780
$535
$402
$295
Average/Median Selling Price (,000s)* Average Selling Price
MedianSelling Price
16
8
0
11
74
1
Number of New Listings*
38%
88%
0%
64%
38%
100%
Sales-to-New Listings Ratio*
8
18
37 36
Average Days on Market*
100% 101% 98% 97%
Average Sale Price to List Price Ratio*
Toronto C07: Westminster-Branson
6 7
0
7
28
1
Number of Transactions*
First Quarter 2013
Toronto Real Estate Board
*The source for all slides is the Toronto Real Estate Board. Some statistics are not reported when the number of transactions is two (2) or less.
Statistics are updated on a monthly basis. Quarterly community statistics in this report may not match quarterly sums calculated from past TREB publications.
33
23
6
2 3
28
1
Number of Transactions*
$792
$509
$381 $358
$739
$500
$388
$346
Average/Median Selling Price (,000s)* Average Selling Price
MedianSelling Price
57
6 6 7
60
1
Number of New Listings*
40%
100%
33%
43% 47%
100%
Sales-to-New Listings Ratio*
33
37
40
29
Average Days on Market*
98% 98% 98% 97%
Average Sale Price to List Price Ratio*
Toronto C07: Newtonbrook West
First Quarter 2013
Toronto Real Estate Board
*The source for all slides is the Toronto Real Estate Board. Some statistics are not reported when the number of transactions is two (2) or less.
Statistics are updated on a monthly basis. Quarterly community statistics in this report may not match quarterly sums calculated from past TREB publications.
34
19
0
6
1
40
0
Number of Transactions*
$937
$694
$356
$795
$682
$356
Average/Median Selling Price (,000s)* Average Selling Price
MedianSelling Price
61
0
8 3
104
0
Number of New Listings*
31%
0%
75%
33%
38%
0%
Sales-to-New Listings Ratio*
27
54
31
Average Days on Market*
97% 99% 97%
Average Sale Price to List Price Ratio*
Toronto C07: Willowdale West
First Quarter 2013
Toronto Real Estate Board
*The source for all slides is the Toronto Real Estate Board. Some statistics are not reported when the number of transactions is two (2) or less.
Statistics are updated on a monthly basis. Quarterly community statistics in this report may not match quarterly sums calculated from past TREB publications.
35
17
0 0 0
26
0
Number of Transactions*
$1,140
$366
$1,020
$345
Average/Median Selling Price (,000s)* Average Selling Price
MedianSelling Price
63
0 0 0
51
1
Number of New Listings*
27%
0% 0% 0%
51%
0%
Sales-to-New Listings Ratio*
16
49
Average Days on Market*
100% 98%
Average Sale Price to List Price Ratio*
Toronto C07: Lansing-Westgate
First Quarter 2013
Toronto Real Estate Board
*The source for all slides is the Toronto Real Estate Board. Some statistics are not reported when the number of transactions is two (2) or less.
Statistics are updated on a monthly basis. Quarterly community statistics in this report may not match quarterly sums calculated from past TREB publications.
36
Toronto C08 Community Breakdown
ALL HOME TYPES, FIRST QUARTER 2013
TORONTO C08 COMMUNITY BREAKDOWN
Sales Dollar Volume Average Price Median Price New Listings Active Listings Avg. SP/LP Avg. DOM
Toronto C08 300 $135,431,494 $451,438 $387,000 671 338 99% 29
Church-Yonge Corridor 112 $47,429,926 $423,481 $393,500 239 122 98% 33
North St. James Town 6 $2,160,800 $360,133 $344,400 30 19 99% 58
Cabbagetown-South St. James Town49 $27,738,060 $566,083 $405,000 86 33 101% 21
Regent Park 20 $8,504,190 $425,210 $347,500 53 30 99% 27
Moss Park 69 $30,730,318 $445,367 $403,000 164 84 99% 26
Waterfront Communities C8 45 $18,868,200 $419,293 $370,000 99 50 98% 27
SUMMARY OF EXISTING HOME TRANSACTIONS
First Quarter 2013
Toronto Real Estate Board
*The source for all slides is the Toronto Real Estate Board. Some statistics are not reported when the number of transactions is two (2) or less.
Statistics are updated on a monthly basis. Quarterly community statistics in this report may not match quarterly sums calculated from past TREB publications.
37
0 2 1 3
104
2
Number of Transactions*
$671
$406
$730
$391
Average/Median Selling Price (,000s)* Average Selling Price
MedianSelling Price
1 3 3 8
221
3
Number of New Listings*
0%
67%
33%
38%
47%
67%
Sales-to-New Listings Ratio*
31 33
Average Days on Market*
97% 98%
Average Sale Price to List Price Ratio*
Toronto C08: Church-Yonge Corridor
First Quarter 2013
Toronto Real Estate Board
*The source for all slides is the Toronto Real Estate Board. Some statistics are not reported when the number of transactions is two (2) or less.
Statistics are updated on a monthly basis. Quarterly community statistics in this report may not match quarterly sums calculated from past TREB publications.
38
0 0 0 0
6
0
Number of Transactions*
$360 $344
Average/Median Selling Price (,000s)* Average Selling Price
MedianSelling Price
0 0 0 1
29
0
Number of New Listings*
0% 0% 0% 0%
21%
0%
Sales-to-New Listings Ratio*
58
Average Days on Market*
99%
Average Sale Price to List Price Ratio*
Toronto C08: North St. James Town
First Quarter 2013
Toronto Real Estate Board
*The source for all slides is the Toronto Real Estate Board. Some statistics are not reported when the number of transactions is two (2) or less.
Statistics are updated on a monthly basis. Quarterly community statistics in this report may not match quarterly sums calculated from past TREB publications.
39
2
7
10
6
24
0
Number of Transactions*
$957
$867
$339 $345
$940
$765
$360 $320
Average/Median Selling Price (,000s)* Average Selling Price
MedianSelling Price
4
14 15 14
39
0
Number of New Listings*
50% 50%
67%
43%
62%
0%
Sales-to-New Listings Ratio*
7
11
15
32
Average Days on Market*
101% 100% 99% 98%
Average Sale Price to List Price Ratio*
Toronto C08: Cabbagetown-South St. James Town
First Quarter 2013
Toronto Real Estate Board
*The source for all slides is the Toronto Real Estate Board. Some statistics are not reported when the number of transactions is two (2) or less.
Statistics are updated on a monthly basis. Quarterly community statistics in this report may not match quarterly sums calculated from past TREB publications.
40
0
2
1
2
15
0
Number of Transactions*
$362
$330
Average/Median Selling Price (,000s)* Average Selling Price
MedianSelling Price
0 2 2 3
46
0
Number of New Listings*
0%
100%
50%
67%
33%
0%
Sales-to-New Listings Ratio*
25
Average Days on Market*
99%
Average Sale Price to List Price Ratio*
Toronto C08: Regent Park
First Quarter 2013
Toronto Real Estate Board
*The source for all slides is the Toronto Real Estate Board. Some statistics are not reported when the number of transactions is two (2) or less.
Statistics are updated on a monthly basis. Quarterly community statistics in this report may not match quarterly sums calculated from past TREB publications.
41
0
7
1 1
60
0
Number of Transactions*
$722
$405
$675
$377
Average/Median Selling Price (,000s)* Average Selling Price
MedianSelling Price
2 9 2 3
148
0
Number of New Listings*
0%
78%
50%
33%
41%
0%
Sales-to-New Listings Ratio*
25 26
Average Days on Market*
99% 99%
Average Sale Price to List Price Ratio*
Toronto C08: Moss Park
First Quarter 2013
Toronto Real Estate Board
*The source for all slides is the Toronto Real Estate Board. Some statistics are not reported when the number of transactions is two (2) or less.
Statistics are updated on a monthly basis. Quarterly community statistics in this report may not match quarterly sums calculated from past TREB publications.
42
0 0 1 0
44
0
Number of Transactions*
$423
$370
Average/Median Selling Price (,000s)* Average Selling Price
MedianSelling Price
0 0 1 0
98
0
Number of New Listings*
0% 0%
100%
0%
45%
0%
Sales-to-New Listings Ratio*
31
Average Days on Market*
98%
Average Sale Price to List Price Ratio*
Toronto C08: Waterfront Communities C8
First Quarter 2013
Toronto Real Estate Board
*The source for all slides is the Toronto Real Estate Board. Some statistics are not reported when the number of transactions is two (2) or less.
Statistics are updated on a monthly basis. Quarterly community statistics in this report may not match quarterly sums calculated from past TREB publications.
43
ALL HOME TYPES, FIRST QUARTER 2013
TORONTO C09 COMMUNITY BREAKDOWN
Sales Dollar Volume Average Price Median Price New Listings Active Listings Avg. SP/LP Avg. DOM
Toronto C09 54 $72,088,400 $1,334,970 $972,500 124 66 98% 25
Rosedale-Moore Park 54 $72,088,400 $1,334,970 $972,500 124 66 98% 25
SUMMARY OF EXISTING HOME TRANSACTIONS
Toronto C09 Community Breakdown
First Quarter 2013
Toronto Real Estate Board
*The source for all slides is the Toronto Real Estate Board. Some statistics are not reported when the number of transactions is two (2) or less.
Statistics are updated on a monthly basis. Quarterly community statistics in this report may not match quarterly sums calculated from past TREB publications.
44
22
5
0
4
15
8
Number of Transactions*
$2,122
$1,802
$858
$596 $502
$1,868
$1,695
$873
$590
$468
Average/Median Selling Price (,000s)* Average Selling Price
MedianSelling Price
47
7
3
6
42
19
Number of New Listings*
47%
71%
0%
67%
36%
42%
Sales-to-New Listings Ratio*
21
18
13
29
41
Average Days on Market*
98% 100% 97% 97% 98%
Average Sale Price to List Price Ratio*
Toronto C09: Rosedale-Moore Park
First Quarter 2013
Toronto Real Estate Board
*The source for all slides is the Toronto Real Estate Board. Some statistics are not reported when the number of transactions is two (2) or less.
Statistics are updated on a monthly basis. Quarterly community statistics in this report may not match quarterly sums calculated from past TREB publications.
45
ALL HOME TYPES, FIRST QUARTER 2013
TORONTO C10 COMMUNITY BREAKDOWN
Sales Dollar Volume Average Price Median Price New Listings Active Listings Avg. SP/LP Avg. DOM
Toronto C10 130 $77,652,144 $597,324 $487,450 275 123 101% 22
Mount Pleasant West 87 $44,532,444 $511,867 $423,000 179 80 100% 23
Mount Pleasant East 43 $33,119,700 $770,226 $741,000 96 43 102% 21
SUMMARY OF EXISTING HOME TRANSACTIONS
Toronto C10 Community Breakdown
First Quarter 2013
Toronto Real Estate Board
*The source for all slides is the Toronto Real Estate Board. Some statistics are not reported when the number of transactions is two (2) or less.
Statistics are updated on a monthly basis. Quarterly community statistics in this report may not match quarterly sums calculated from past TREB publications.
46
6
0 1
8
72
0
Number of Transactions*
$1,339
$513
$436
$1,308
$441 $417
Average/Median Selling Price (,000s)* Average Selling Price
MedianSelling Price
9 1 2
19
147
1
Number of New Listings*
67%
0%
50%
42%
49%
0%
Sales-to-New Listings Ratio*
16
11
25
Average Days on Market*
106% 102% 98%
Average Sale Price to List Price Ratio*
Toronto C10: Mount Pleasant West
First Quarter 2013
Toronto Real Estate Board
*The source for all slides is the Toronto Real Estate Board. Some statistics are not reported when the number of transactions is two (2) or less.
Statistics are updated on a monthly basis. Quarterly community statistics in this report may not match quarterly sums calculated from past TREB publications.
47
15 15
1
2
10
0
Number of Transactions*
$1,023
$735
$409
$956
$704
$318
Average/Median Selling Price (,000s)* Average Selling Price
MedianSelling Price
41
26
1
4
23
1
Number of New Listings*
37%
58%
100%
50% 43%
0%
Sales-to-New Listings Ratio*
21
6
37
Average Days on Market*
102% 105% 100%
Average Sale Price to List Price Ratio*
Toronto C10: Mount Pleasant East
First Quarter 2013
Toronto Real Estate Board
*The source for all slides is the Toronto Real Estate Board. Some statistics are not reported when the number of transactions is two (2) or less.
Statistics are updated on a monthly basis. Quarterly community statistics in this report may not match quarterly sums calculated from past TREB publications.
48
ALL HOME TYPES, FIRST QUARTER 2013
TORONTO C11 COMMUNITY BREAKDOWN
Sales Dollar Volume Average Price Median Price New Listings Active Listings Avg. SP/LP Avg. DOM
Toronto C11 104 $70,983,210 $682,531 $361,250 170 73 99% 34
Leaside 52 $59,594,797 $1,146,054 $1,135,500 75 15 100% 20
Thorncliffe Park 8 $1,900,000 $237,500 $230,750 12 6 97% 73
Flemingdon Park 44 $9,488,413 $215,646 $191,500 83 52 97% 44
SUMMARY OF EXISTING HOME TRANSACTIONS
Toronto C11 Community Breakdown
First Quarter 2013
Toronto Real Estate Board
*The source for all slides is the Toronto Real Estate Board. Some statistics are not reported when the number of transactions is two (2) or less.
Statistics are updated on a monthly basis. Quarterly community statistics in this report may not match quarterly sums calculated from past TREB publications.
49
34
10
1 0
7
0
Number of Transactions*
$1,417
$764
$405
$1,394
$762
$402
Average/Median Selling Price (,000s)* Average Selling Price
MedianSelling Price
57
10
1 0
7
0
Number of New Listings*
60%
100% 100%
0%
100%
0%
Sales-to-New Listings Ratio*
20
6
44
Average Days on Market*
99% 103% 98%
Average Sale Price to List Price Ratio*
Toronto C11: Leaside
First Quarter 2013
Toronto Real Estate Board
*The source for all slides is the Toronto Real Estate Board. Some statistics are not reported when the number of transactions is two (2) or less.
Statistics are updated on a monthly basis. Quarterly community statistics in this report may not match quarterly sums calculated from past TREB publications.
50
0 0 0 0
8
0
Number of Transactions*
$238 $231
Average/Median Selling Price (,000s)* Average Selling Price
MedianSelling Price
0 0 0 0
12
0
Number of New Listings*
0% 0% 0% 0%
67%
0%
Sales-to-New Listings Ratio*
73
Average Days on Market*
97%
Average Sale Price to List Price Ratio*
Toronto C11: Thorncliffe Park
First Quarter 2013
Toronto Real Estate Board
*The source for all slides is the Toronto Real Estate Board. Some statistics are not reported when the number of transactions is two (2) or less.
Statistics are updated on a monthly basis. Quarterly community statistics in this report may not match quarterly sums calculated from past TREB publications.
51
0 1 0 2
41
0
Number of Transactions*
$208
$195
Average/Median Selling Price (,000s)* Average Selling Price
MedianSelling Price
0 4 0 3
76
0
Number of New Listings*
0%
25%
0%
67%
54%
0%
Sales-to-New Listings Ratio*
44
Average Days on Market*
96%
Average Sale Price to List Price Ratio*
Toronto C11: Flemingdon Park
First Quarter 2013
Toronto Real Estate Board
*The source for all slides is the Toronto Real Estate Board. Some statistics are not reported when the number of transactions is two (2) or less.
Statistics are updated on a monthly basis. Quarterly community statistics in this report may not match quarterly sums calculated from past TREB publications.
52
ALL HOME TYPES, FIRST QUARTER 2013
TORONTO C12 COMMUNITY BREAKDOWN
Sales Dollar Volume Average Price Median Price New Listings Active Listings Avg. SP/LP Avg. DOM
Toronto C12 83 $161,456,788 $1,945,263 $1,842,000 231 147 97% 29
St. Andrew-Windfields 55 $98,011,888 $1,782,034 $1,825,000 139 75 97% 28
Bridle Path-Sunnybrook-York Mills 28 $63,444,900 $2,265,889 $1,965,000 92 72 96% 33
SUMMARY OF EXISTING HOME TRANSACTIONS
Toronto C12 Community Breakdown
First Quarter 2013
Toronto Real Estate Board
*The source for all slides is the Toronto Real Estate Board. Some statistics are not reported when the number of transactions is two (2) or less.
Statistics are updated on a monthly basis. Quarterly community statistics in this report may not match quarterly sums calculated from past TREB publications.
53
44
1 0
4 6
0
Number of Transactions*
$2,079
$726
$508
$1,996
$735
$494
Average/Median Selling Price (,000s)* Average Selling Price
MedianSelling Price
96
1 0
17
25
0
Number of New Listings*
46%
100%
0%
24% 24%
0%
Sales-to-New Listings Ratio*
26
21
46
Average Days on Market*
97% 99% 97%
Average Sale Price to List Price Ratio*
Toronto C12: St. Andrew-Windfields
First Quarter 2013
Toronto Real Estate Board
*The source for all slides is the Toronto Real Estate Board. Some statistics are not reported when the number of transactions is two (2) or less.
Statistics are updated on a monthly basis. Quarterly community statistics in this report may not match quarterly sums calculated from past TREB publications.
54
21
0 0 1
6
0
Number of Transactions*
$2,633
$1,206
$2,500
$931
Average/Median Selling Price (,000s)* Average Selling Price
MedianSelling Price
74
0 1 0
17
0
Number of New Listings*
28%
0% 0% 0%
35%
0%
Sales-to-New Listings Ratio*
33 35
Average Days on Market*
96% 94%
Average Sale Price to List Price Ratio*
Toronto C12: Bridle Path-Sunnybrook-York Mills
First Quarter 2013
Toronto Real Estate Board
*The source for all slides is the Toronto Real Estate Board. Some statistics are not reported when the number of transactions is two (2) or less.
Statistics are updated on a monthly basis. Quarterly community statistics in this report may not match quarterly sums calculated from past TREB publications.
55
ALL HOME TYPES, FIRST QUARTER 2013
TORONTO C13 COMMUNITY BREAKDOWN
Sales Dollar Volume Average Price Median Price New Listings Active Listings Avg. SP/LP Avg. DOM
Toronto C13 153 $94,022,590 $614,527 $445,000 290 133 99% 28
Parkwoods-Donalda 47 $26,746,600 $569,077 $505,000 77 29 100% 26
Banbury-Don Mills 78 $57,713,190 $739,913 $454,000 157 76 99% 28
Victoria Village 28 $9,562,800 $341,529 $258,000 56 28 98% 30
SUMMARY OF EXISTING HOME TRANSACTIONS
Toronto C13 Community Breakdown
First Quarter 2013
Toronto Real Estate Board
*The source for all slides is the Toronto Real Estate Board. Some statistics are not reported when the number of transactions is two (2) or less.
Statistics are updated on a monthly basis. Quarterly community statistics in this report may not match quarterly sums calculated from past TREB publications.
56
19
13
0
5
10
0
Number of Transactions*
$870
$478
$355
$223
$830
$480
$348
$210
Average/Median Selling Price (,000s)* Average Selling Price
MedianSelling Price
29
17
0
5
26
0
Number of New Listings*
66%
76%
0%
100%
38%
0%
Sales-to-New Listings Ratio*
24
15
37 38
Average Days on Market*
101% 99% 97% 98%
Average Sale Price to List Price Ratio*
Toronto C13: Parkwoods-Donalda
First Quarter 2013
Toronto Real Estate Board
*The source for all slides is the Toronto Real Estate Board. Some statistics are not reported when the number of transactions is two (2) or less.
Statistics are updated on a monthly basis. Quarterly community statistics in this report may not match quarterly sums calculated from past TREB publications.
57
27
1 1
4
45
0
Number of Transactions*
$1,414
$564
$351
$1,308
$559
$332
Average/Median Selling Price (,000s)* Average Selling Price
MedianSelling Price
48
1 3 4
101
0
Number of New Listings*
56%
100%
33%
100%
45%
0%
Sales-to-New Listings Ratio*
19
15
34
Average Days on Market*
99% 100% 98%
Average Sale Price to List Price Ratio*
Toronto C13: Banbury-Don Mills
First Quarter 2013
Toronto Real Estate Board
*The source for all slides is the Toronto Real Estate Board. Some statistics are not reported when the number of transactions is two (2) or less.
Statistics are updated on a monthly basis. Quarterly community statistics in this report may not match quarterly sums calculated from past TREB publications.
58
4 4
2 2
14
2
Number of Transactions*
$617
$479
$223
$612
$463
$227
Average/Median Selling Price (,000s)* Average Selling Price
MedianSelling Price
8
3
7
5
31
2
Number of New Listings*
50%
133%
29%
40% 45%
100%
Sales-to-New Listings Ratio*
29
24
28
Average Days on Market*
99% 98% 98%
Average Sale Price to List Price Ratio*
Toronto C13: Victoria Village
First Quarter 2013
Toronto Real Estate Board
*The source for all slides is the Toronto Real Estate Board. Some statistics are not reported when the number of transactions is two (2) or less.
Statistics are updated on a monthly basis. Quarterly community statistics in this report may not match quarterly sums calculated from past TREB publications.
59
ALL HOME TYPES, FIRST QUARTER 2013
TORONTO C14 COMMUNITY BREAKDOWN
Sales Dollar Volume Average Price Median Price New Listings Active Listings Avg. SP/LP Avg. DOM
Toronto C14 387 $230,999,375 $596,898 $430,000 838 432 98% 33
Newtonbrook East 76 $54,373,800 $715,445 $746,000 158 74 98% 31
Willowdale East 311 $176,625,575 $567,928 $420,000 680 358 97% 34
SUMMARY OF EXISTING HOME TRANSACTIONS
Toronto C14 Community Breakdown
First Quarter 2013
Toronto Real Estate Board
*The source for all slides is the Toronto Real Estate Board. Some statistics are not reported when the number of transactions is two (2) or less.
Statistics are updated on a monthly basis. Quarterly community statistics in this report may not match quarterly sums calculated from past TREB publications.
60
46
0 0 0
30
0
Number of Transactions*
$973
$320
$897
$317
Average/Median Selling Price (,000s)* Average Selling Price
MedianSelling Price
91
0 0 0
62
5
Number of New Listings*
51%
0% 0% 0%
48%
0%
Sales-to-New Listings Ratio*
26
40
Average Days on Market*
98% 98%
Average Sale Price to List Price Ratio*
Toronto C14: Newtonbrook East
First Quarter 2013
Toronto Real Estate Board
*The source for all slides is the Toronto Real Estate Board. Some statistics are not reported when the number of transactions is two (2) or less.
Statistics are updated on a monthly basis. Quarterly community statistics in this report may not match quarterly sums calculated from past TREB publications.
61
53
2 7
24
225
0
Number of Transactions*
$1,269
$783
$603
$392
$1,180
$766
$621
$357
Average/Median Selling Price (,000s)* Average Selling Price
MedianSelling Price
124
2 12 45
497
0
Number of New Listings*
43%
100%
58% 53%
45%
0%
Sales-to-New Listings Ratio*
18
78
35 37
Average Days on Market*
97% 97% 98% 98%
Average Sale Price to List Price Ratio*
Toronto C14: Willowdale East
First Quarter 2013
Toronto Real Estate Board
*The source for all slides is the Toronto Real Estate Board. Some statistics are not reported when the number of transactions is two (2) or less.
Statistics are updated on a monthly basis. Quarterly community statistics in this report may not match quarterly sums calculated from past TREB publications.
62
ALL HOME TYPES, FIRST QUARTER 2013
TORONTO C15 COMMUNITY BREAKDOWN
Sales Dollar Volume Average Price Median Price New Listings Active Listings Avg. SP/LP Avg. DOM
Toronto C15 282 $157,402,386 $558,164 $462,250 628 312 98% 30
Bayview Woods-Steeles 26 $19,664,400 $756,323 $776,950 61 34 97% 26
Hillcrest Village 56 $32,685,746 $583,674 $504,500 86 33 98% 23
Pleasant View 34 $15,882,994 $467,147 $504,900 44 9 100% 17
Don Valley Village 50 $27,857,988 $557,160 $563,750 114 47 98% 21
Bayview Village 92 $52,842,395 $574,374 $365,000 280 167 96% 46
Henry Farm 24 $8,468,863 $352,869 $296,000 43 22 99% 22
SUMMARY OF EXISTING HOME TRANSACTIONS
Toronto C15 Community Breakdown
First Quarter 2013
Toronto Real Estate Board
*The source for all slides is the Toronto Real Estate Board. Some statistics are not reported when the number of transactions is two (2) or less.
Statistics are updated on a monthly basis. Quarterly community statistics in this report may not match quarterly sums calculated from past TREB publications.
63
12
7
0
2
5
0
Number of Transactions*
$924
$549
$778
$864
$565
$754
Average/Median Selling Price (,000s)* Average Selling Price
MedianSelling Price
36
10
0 2
13
0
Number of New Listings*
33%
70%
0%
100%
38%
0%
Sales-to-New Listings Ratio*
19 16
58
Average Days on Market*
97% 96% 97%
Average Sale Price to List Price Ratio*
Toronto C15: Bayview Woods-Steeles
First Quarter 2013
Toronto Real Estate Board
*The source for all slides is the Toronto Real Estate Board. Some statistics are not reported when the number of transactions is two (2) or less.
Statistics are updated on a monthly basis. Quarterly community statistics in this report may not match quarterly sums calculated from past TREB publications.
64
24
11
0
12
9
0
Number of Transactions*
$818
$482
$353
$392
$798
$480
$371
$420
Average/Median Selling Price (,000s)* Average Selling Price
MedianSelling Price
31
20
0
21
13
1
Number of New Listings*
77%
55%
0%
57%
69%
0%
Sales-to-New Listings Ratio*
16
32
15
41
Average Days on Market*
99% 98% 98% 96%
Average Sale Price to List Price Ratio*
Toronto C15: Hillcrest Village
First Quarter 2013
Toronto Real Estate Board
*The source for all slides is the Toronto Real Estate Board. Some statistics are not reported when the number of transactions is two (2) or less.
Statistics are updated on a monthly basis. Quarterly community statistics in this report may not match quarterly sums calculated from past TREB publications.
65
6
12
0
3
11
2
Number of Transactions*
$751
$533
$409
$235
$731
$549
$406
$240
Average/Median Selling Price (,000s)* Average Selling Price
MedianSelling Price
7
15
0
4
15
3
Number of New Listings*
86%
80%
0%
75% 73%
67%
Sales-to-New Listings Ratio*
23
9
5
27
Average Days on Market*
100% 101% 100% 97%
Average Sale Price to List Price Ratio*
Toronto C15: Pleasant View
First Quarter 2013
Toronto Real Estate Board
*The source for all slides is the Toronto Real Estate Board. Some statistics are not reported when the number of transactions is two (2) or less.
Statistics are updated on a monthly basis. Quarterly community statistics in this report may not match quarterly sums calculated from past TREB publications.
66
22
3
0
3
21
1
Number of Transactions*
$778
$585
$381 $347
$734
$577
$359 $334
Average/Median Selling Price (,000s)* Average Selling Price
MedianSelling Price
32
6
0
14
61
1
Number of New Listings*
69%
50%
0%
21%
34%
100%
Sales-to-New Listings Ratio*
16
19
23 23
Average Days on Market*
99% 102% 97% 97%
Average Sale Price to List Price Ratio*
Toronto C15: Don Valley Village
First Quarter 2013
Toronto Real Estate Board
*The source for all slides is the Toronto Real Estate Board. Some statistics are not reported when the number of transactions is two (2) or less.
Statistics are updated on a monthly basis. Quarterly community statistics in this report may not match quarterly sums calculated from past TREB publications.
67
19
0 0
7
66
0
Number of Transactions*
$1,352
$532
$355
$1,050
$488
$334
Average/Median Selling Price (,000s)* Average Selling Price
MedianSelling Price
47
0 0
19
214
0
Number of New Listings*
40%
0% 0%
37%
31%
0%
Sales-to-New Listings Ratio*
36
50 48
Average Days on Market*
95% 96% 97%
Average Sale Price to List Price Ratio*
Toronto C15: Bayview Village
First Quarter 2013
Toronto Real Estate Board
*The source for all slides is the Toronto Real Estate Board. Some statistics are not reported when the number of transactions is two (2) or less.
Statistics are updated on a monthly basis. Quarterly community statistics in this report may not match quarterly sums calculated from past TREB publications.
68
3
0 0
3
18
0
Number of Transactions*
$809
$334
$280
$806
$330
$272
Average/Median Selling Price (,000s)* Average Selling Price
MedianSelling Price
4
0 0
3
36
0
Number of New Listings*
75%
0% 0%
100%
50%
0%
Sales-to-New Listings Ratio*
8
39
21
Average Days on Market*
98% 100% 99%
Average Sale Price to List Price Ratio*
Toronto C15: Henry Farm

Contenu connexe

Tendances (14)

Treb housing market_charts-june_2014
Treb housing market_charts-june_2014Treb housing market_charts-june_2014
Treb housing market_charts-june_2014
 
Greater Princeton NJ Market Update
Greater Princeton NJ Market UpdateGreater Princeton NJ Market Update
Greater Princeton NJ Market Update
 
2013 04 market watch
2013 04 market watch2013 04 market watch
2013 04 market watch
 
TREB Housing Market Charts - September 2014
TREB Housing Market Charts - September 2014TREB Housing Market Charts - September 2014
TREB Housing Market Charts - September 2014
 
TREB Housing Market Charts - April 2015
TREB Housing Market Charts - April 2015TREB Housing Market Charts - April 2015
TREB Housing Market Charts - April 2015
 
TREB Housing Market Charts - May 2015
TREB Housing Market Charts - May 2015TREB Housing Market Charts - May 2015
TREB Housing Market Charts - May 2015
 
TREB Housing Market Charts - June 2015
TREB Housing Market Charts - June 2015TREB Housing Market Charts - June 2015
TREB Housing Market Charts - June 2015
 
TREB Housing Market Charts - August 2014
TREB Housing Market Charts - August 2014TREB Housing Market Charts - August 2014
TREB Housing Market Charts - August 2014
 
Treb housing market_charts-july_2014
Treb housing market_charts-july_2014Treb housing market_charts-july_2014
Treb housing market_charts-july_2014
 
TREB Housing Market Charts - November 2014
TREB Housing Market Charts - November 2014TREB Housing Market Charts - November 2014
TREB Housing Market Charts - November 2014
 
Treb housing market_charts-november_2014
Treb housing market_charts-november_2014Treb housing market_charts-november_2014
Treb housing market_charts-november_2014
 
Q2 2017 CONDO MARKET REPORT
Q2 2017 CONDO MARKET REPORTQ2 2017 CONDO MARKET REPORT
Q2 2017 CONDO MARKET REPORT
 
Princeton Area Real Estate Update5 1 14
Princeton Area Real Estate Update5 1 14Princeton Area Real Estate Update5 1 14
Princeton Area Real Estate Update5 1 14
 
TREB Housing Market Charts - March 2013
TREB Housing Market Charts - March 2013TREB Housing Market Charts - March 2013
TREB Housing Market Charts - March 2013
 

Similaire à Toronto central q1 2013

August 2013 Mid Month Housing Report
August 2013 Mid Month Housing ReportAugust 2013 Mid Month Housing Report
August 2013 Mid Month Housing ReportMichelle Makos
 
Condo report q1-2013
Condo report q1-2013Condo report q1-2013
Condo report q1-2013Chaba Tamasi
 
Rental report q1-2013
Rental report q1-2013Rental report q1-2013
Rental report q1-2013Chaba Tamasi
 
Rental report q1-2013
Rental report q1-2013Rental report q1-2013
Rental report q1-2013Chaba Tamasi
 
Treb housing market_charts-august_2014
Treb housing market_charts-august_2014Treb housing market_charts-august_2014
Treb housing market_charts-august_2014Andrew Doumont
 
Treb housing market_charts-march_2013
Treb housing market_charts-march_2013Treb housing market_charts-march_2013
Treb housing market_charts-march_2013Trish Bongard Godfrey
 
Treb housing market_charts-february_2015
Treb housing market_charts-february_2015Treb housing market_charts-february_2015
Treb housing market_charts-february_2015Andrew Doumont
 
Treb housing market_charts-january_2015
Treb housing market_charts-january_2015Treb housing market_charts-january_2015
Treb housing market_charts-january_2015Amit Saini
 
TREB - Rental Report Q3-2016
TREB - Rental Report Q3-2016TREB - Rental Report Q3-2016
TREB - Rental Report Q3-2016Gloria Yeung
 

Similaire à Toronto central q1 2013 (20)

August 2013 Mid Month Housing Report
August 2013 Mid Month Housing ReportAugust 2013 Mid Month Housing Report
August 2013 Mid Month Housing Report
 
Condo report q2-2013
Condo report q2-2013Condo report q2-2013
Condo report q2-2013
 
Condo report q1-2013
Condo report q1-2013Condo report q1-2013
Condo report q1-2013
 
Condo report q1-2013
Condo report q1-2013Condo report q1-2013
Condo report q1-2013
 
Rental report q1-2013
Rental report q1-2013Rental report q1-2013
Rental report q1-2013
 
Rental report q1-2013
Rental report q1-2013Rental report q1-2013
Rental report q1-2013
 
TREB Housing Market Charts October 2014
TREB Housing Market Charts October 2014TREB Housing Market Charts October 2014
TREB Housing Market Charts October 2014
 
TREB Housing Market Charts - October 2014
TREB Housing Market Charts - October 2014TREB Housing Market Charts - October 2014
TREB Housing Market Charts - October 2014
 
Treb housing market_charts-august_2014
Treb housing market_charts-august_2014Treb housing market_charts-august_2014
Treb housing market_charts-august_2014
 
Treb housing market_charts-june_2014
Treb housing market_charts-june_2014Treb housing market_charts-june_2014
Treb housing market_charts-june_2014
 
Treb housing market_charts-march_2013
Treb housing market_charts-march_2013Treb housing market_charts-march_2013
Treb housing market_charts-march_2013
 
TREB Housing Market Charts - May 2013
TREB Housing Market Charts - May 2013TREB Housing Market Charts - May 2013
TREB Housing Market Charts - May 2013
 
Treb housing market_charts-february_2015
Treb housing market_charts-february_2015Treb housing market_charts-february_2015
Treb housing market_charts-february_2015
 
Treb housing market_charts-january_2015
Treb housing market_charts-january_2015Treb housing market_charts-january_2015
Treb housing market_charts-january_2015
 
TREB Housing Market Charts January 2015
TREB Housing Market Charts January 2015TREB Housing Market Charts January 2015
TREB Housing Market Charts January 2015
 
TREB Housing Market Charts April 2015
TREB Housing Market Charts April 2015TREB Housing Market Charts April 2015
TREB Housing Market Charts April 2015
 
TREB Housing Market Charts - July 2013
TREB Housing Market Charts - July 2013TREB Housing Market Charts - July 2013
TREB Housing Market Charts - July 2013
 
TREB Housing Market Charts - September 2016
TREB Housing Market Charts - September 2016TREB Housing Market Charts - September 2016
TREB Housing Market Charts - September 2016
 
TREB Housing Market Charts December 2014
TREB Housing Market Charts December 2014TREB Housing Market Charts December 2014
TREB Housing Market Charts December 2014
 
TREB - Rental Report Q3-2016
TREB - Rental Report Q3-2016TREB - Rental Report Q3-2016
TREB - Rental Report Q3-2016
 

Plus de Chaba Tamasi

Toronto Market Watch AUGUST 2016
Toronto Market Watch AUGUST 2016Toronto Market Watch AUGUST 2016
Toronto Market Watch AUGUST 2016Chaba Tamasi
 
Market Watch May 2016
Market Watch May 2016Market Watch May 2016
Market Watch May 2016Chaba Tamasi
 
Market Watch TORONTO 2015 OCTOBER
Market Watch TORONTO 2015 OCTOBERMarket Watch TORONTO 2015 OCTOBER
Market Watch TORONTO 2015 OCTOBERChaba Tamasi
 
Market Watch TORONTO 2015 SEPTEMBER
Market Watch TORONTO 2015 SEPTEMBERMarket Watch TORONTO 2015 SEPTEMBER
Market Watch TORONTO 2015 SEPTEMBERChaba Tamasi
 
Market Watch APRIL 2015
Market Watch APRIL 2015Market Watch APRIL 2015
Market Watch APRIL 2015Chaba Tamasi
 
Market Watch TORONTO 2015 JANUARY
Market Watch TORONTO 2015 JANUARYMarket Watch TORONTO 2015 JANUARY
Market Watch TORONTO 2015 JANUARYChaba Tamasi
 
Market Watch TORONTO 2014 OCTOBER
Market Watch TORONTO 2014 OCTOBERMarket Watch TORONTO 2014 OCTOBER
Market Watch TORONTO 2014 OCTOBERChaba Tamasi
 
Market Watch November 2013
Market Watch November 2013Market Watch November 2013
Market Watch November 2013Chaba Tamasi
 
Market Watch June 2013
Market Watch June 2013Market Watch June 2013
Market Watch June 2013Chaba Tamasi
 
Treb historic statistics
Treb historic statisticsTreb historic statistics
Treb historic statisticsChaba Tamasi
 
Treb historic statistics
Treb historic statisticsTreb historic statistics
Treb historic statisticsChaba Tamasi
 
Market watch march 2013
Market watch   march 2013Market watch   march 2013
Market watch march 2013Chaba Tamasi
 
Treb toronto housing market charts-february2013
Treb   toronto housing market charts-february2013Treb   toronto housing market charts-february2013
Treb toronto housing market charts-february2013Chaba Tamasi
 
Rental Market Report Q4 2012
Rental Market Report Q4 2012Rental Market Report Q4 2012
Rental Market Report Q4 2012Chaba Tamasi
 
TREB Condo Report Q4 2012
TREB Condo Report Q4 2012TREB Condo Report Q4 2012
TREB Condo Report Q4 2012Chaba Tamasi
 
Mw1212 130107122612-phpapp01
Mw1212 130107122612-phpapp01Mw1212 130107122612-phpapp01
Mw1212 130107122612-phpapp01Chaba Tamasi
 
Condo Report OCT 2012
Condo Report OCT 2012Condo Report OCT 2012
Condo Report OCT 2012Chaba Tamasi
 

Plus de Chaba Tamasi (17)

Toronto Market Watch AUGUST 2016
Toronto Market Watch AUGUST 2016Toronto Market Watch AUGUST 2016
Toronto Market Watch AUGUST 2016
 
Market Watch May 2016
Market Watch May 2016Market Watch May 2016
Market Watch May 2016
 
Market Watch TORONTO 2015 OCTOBER
Market Watch TORONTO 2015 OCTOBERMarket Watch TORONTO 2015 OCTOBER
Market Watch TORONTO 2015 OCTOBER
 
Market Watch TORONTO 2015 SEPTEMBER
Market Watch TORONTO 2015 SEPTEMBERMarket Watch TORONTO 2015 SEPTEMBER
Market Watch TORONTO 2015 SEPTEMBER
 
Market Watch APRIL 2015
Market Watch APRIL 2015Market Watch APRIL 2015
Market Watch APRIL 2015
 
Market Watch TORONTO 2015 JANUARY
Market Watch TORONTO 2015 JANUARYMarket Watch TORONTO 2015 JANUARY
Market Watch TORONTO 2015 JANUARY
 
Market Watch TORONTO 2014 OCTOBER
Market Watch TORONTO 2014 OCTOBERMarket Watch TORONTO 2014 OCTOBER
Market Watch TORONTO 2014 OCTOBER
 
Market Watch November 2013
Market Watch November 2013Market Watch November 2013
Market Watch November 2013
 
Market Watch June 2013
Market Watch June 2013Market Watch June 2013
Market Watch June 2013
 
Treb historic statistics
Treb historic statisticsTreb historic statistics
Treb historic statistics
 
Treb historic statistics
Treb historic statisticsTreb historic statistics
Treb historic statistics
 
Market watch march 2013
Market watch   march 2013Market watch   march 2013
Market watch march 2013
 
Treb toronto housing market charts-february2013
Treb   toronto housing market charts-february2013Treb   toronto housing market charts-february2013
Treb toronto housing market charts-february2013
 
Rental Market Report Q4 2012
Rental Market Report Q4 2012Rental Market Report Q4 2012
Rental Market Report Q4 2012
 
TREB Condo Report Q4 2012
TREB Condo Report Q4 2012TREB Condo Report Q4 2012
TREB Condo Report Q4 2012
 
Mw1212 130107122612-phpapp01
Mw1212 130107122612-phpapp01Mw1212 130107122612-phpapp01
Mw1212 130107122612-phpapp01
 
Condo Report OCT 2012
Condo Report OCT 2012Condo Report OCT 2012
Condo Report OCT 2012
 

Dernier

LCAR RE Practice - The Power of Your Database
LCAR RE Practice - The Power of Your DatabaseLCAR RE Practice - The Power of Your Database
LCAR RE Practice - The Power of Your DatabaseTom Blefko
 
Raymond Ten X Era Viviana Mall Thane Brochure.pdf
Raymond Ten X Era Viviana Mall Thane Brochure.pdfRaymond Ten X Era Viviana Mall Thane Brochure.pdf
Raymond Ten X Era Viviana Mall Thane Brochure.pdfPrachiRudram
 
Fractional Ownership Vs Physical Ownership.pdf
Fractional Ownership Vs Physical Ownership.pdfFractional Ownership Vs Physical Ownership.pdf
Fractional Ownership Vs Physical Ownership.pdfHavendaxa
 
Prestige Sanctuary Nandi Hills Bangalore.pdf
Prestige Sanctuary Nandi Hills Bangalore.pdfPrestige Sanctuary Nandi Hills Bangalore.pdf
Prestige Sanctuary Nandi Hills Bangalore.pdfashiyadav24
 
Mana Dale Kodathi, Sarjapur Road, Bangalore E-Brochure.pdf
Mana Dale Kodathi, Sarjapur Road, Bangalore E-Brochure.pdfMana Dale Kodathi, Sarjapur Road, Bangalore E-Brochure.pdf
Mana Dale Kodathi, Sarjapur Road, Bangalore E-Brochure.pdffaheemali990101
 
Kolte Patil Mirabilis at Horamavu Road, Bangalore E brochure.pdf
Kolte Patil Mirabilis at Horamavu Road, Bangalore E brochure.pdfKolte Patil Mirabilis at Horamavu Road, Bangalore E brochure.pdf
Kolte Patil Mirabilis at Horamavu Road, Bangalore E brochure.pdfAhanundefined
 
Mahindra Vista Kandivali East Mumbai Brochure.pdf
Mahindra Vista Kandivali East Mumbai Brochure.pdfMahindra Vista Kandivali East Mumbai Brochure.pdf
Mahindra Vista Kandivali East Mumbai Brochure.pdfPrachiRudram
 
Ganga Fusion 85 Gurugram - PDF Download.pdf
Ganga Fusion 85 Gurugram - PDF Download.pdfGanga Fusion 85 Gurugram - PDF Download.pdf
Ganga Fusion 85 Gurugram - PDF Download.pdfanjalisaini334541
 
Listing Turkey - Resim Modern Catalog Istanbul
Listing Turkey - Resim Modern Catalog IstanbulListing Turkey - Resim Modern Catalog Istanbul
Listing Turkey - Resim Modern Catalog IstanbulListing Turkey
 
Kolte Patil Universe Hinjewadi Pune Brochure.pdf
Kolte Patil Universe Hinjewadi Pune Brochure.pdfKolte Patil Universe Hinjewadi Pune Brochure.pdf
Kolte Patil Universe Hinjewadi Pune Brochure.pdfPrachiRudram
 
Sankla East World Hadapsar Pune Brochure.pdf
Sankla East World Hadapsar Pune Brochure.pdfSankla East World Hadapsar Pune Brochure.pdf
Sankla East World Hadapsar Pune Brochure.pdfabbu831446
 
Triaa Housing Lohegaon Pune E-Brochure.pdf
Triaa Housing Lohegaon Pune  E-Brochure.pdfTriaa Housing Lohegaon Pune  E-Brochure.pdf
Triaa Housing Lohegaon Pune E-Brochure.pdfManishSaxena95
 
Prestige Orchards Plots in Shamshabad, Mamidipalli, Hyderabad pdf.pdf
Prestige Orchards Plots in Shamshabad, Mamidipalli, Hyderabad pdf.pdfPrestige Orchards Plots in Shamshabad, Mamidipalli, Hyderabad pdf.pdf
Prestige Orchards Plots in Shamshabad, Mamidipalli, Hyderabad pdf.pdfAhanundefined
 
Clemson Engineering Consultant Dubai For Innovative and Sustainable Engineeri...
Clemson Engineering Consultant Dubai For Innovative and Sustainable Engineeri...Clemson Engineering Consultant Dubai For Innovative and Sustainable Engineeri...
Clemson Engineering Consultant Dubai For Innovative and Sustainable Engineeri...Clemson Engineering Consultant
 
Listing Turkey - Viva Perla Maltepe Catalog
Listing Turkey - Viva Perla Maltepe CatalogListing Turkey - Viva Perla Maltepe Catalog
Listing Turkey - Viva Perla Maltepe CatalogListing Turkey
 
Anandtara Iris Residences Mundhwa Pune Brochure.pdf
Anandtara Iris Residences Mundhwa Pune Brochure.pdfAnandtara Iris Residences Mundhwa Pune Brochure.pdf
Anandtara Iris Residences Mundhwa Pune Brochure.pdfabbu831446
 
Listing Turkey Green life Istanbul Eyup Catalog
Listing Turkey Green life Istanbul Eyup CatalogListing Turkey Green life Istanbul Eyup Catalog
Listing Turkey Green life Istanbul Eyup CatalogListing Turkey
 
SVN Live 4.15.24 Weekly Property Broadcast
SVN Live 4.15.24 Weekly Property BroadcastSVN Live 4.15.24 Weekly Property Broadcast
SVN Live 4.15.24 Weekly Property BroadcastSVN International Corp.
 
The Role of Mortgage Brokers in Retirement Housing: Key Considerations
The Role of Mortgage Brokers in Retirement Housing: Key ConsiderationsThe Role of Mortgage Brokers in Retirement Housing: Key Considerations
The Role of Mortgage Brokers in Retirement Housing: Key Considerationssunlite Mortgage
 
Purva Park Hill Kanakapura Road Bangalore.pdf
Purva Park Hill  Kanakapura Road Bangalore.pdfPurva Park Hill  Kanakapura Road Bangalore.pdf
Purva Park Hill Kanakapura Road Bangalore.pdfashiyadav24
 

Dernier (20)

LCAR RE Practice - The Power of Your Database
LCAR RE Practice - The Power of Your DatabaseLCAR RE Practice - The Power of Your Database
LCAR RE Practice - The Power of Your Database
 
Raymond Ten X Era Viviana Mall Thane Brochure.pdf
Raymond Ten X Era Viviana Mall Thane Brochure.pdfRaymond Ten X Era Viviana Mall Thane Brochure.pdf
Raymond Ten X Era Viviana Mall Thane Brochure.pdf
 
Fractional Ownership Vs Physical Ownership.pdf
Fractional Ownership Vs Physical Ownership.pdfFractional Ownership Vs Physical Ownership.pdf
Fractional Ownership Vs Physical Ownership.pdf
 
Prestige Sanctuary Nandi Hills Bangalore.pdf
Prestige Sanctuary Nandi Hills Bangalore.pdfPrestige Sanctuary Nandi Hills Bangalore.pdf
Prestige Sanctuary Nandi Hills Bangalore.pdf
 
Mana Dale Kodathi, Sarjapur Road, Bangalore E-Brochure.pdf
Mana Dale Kodathi, Sarjapur Road, Bangalore E-Brochure.pdfMana Dale Kodathi, Sarjapur Road, Bangalore E-Brochure.pdf
Mana Dale Kodathi, Sarjapur Road, Bangalore E-Brochure.pdf
 
Kolte Patil Mirabilis at Horamavu Road, Bangalore E brochure.pdf
Kolte Patil Mirabilis at Horamavu Road, Bangalore E brochure.pdfKolte Patil Mirabilis at Horamavu Road, Bangalore E brochure.pdf
Kolte Patil Mirabilis at Horamavu Road, Bangalore E brochure.pdf
 
Mahindra Vista Kandivali East Mumbai Brochure.pdf
Mahindra Vista Kandivali East Mumbai Brochure.pdfMahindra Vista Kandivali East Mumbai Brochure.pdf
Mahindra Vista Kandivali East Mumbai Brochure.pdf
 
Ganga Fusion 85 Gurugram - PDF Download.pdf
Ganga Fusion 85 Gurugram - PDF Download.pdfGanga Fusion 85 Gurugram - PDF Download.pdf
Ganga Fusion 85 Gurugram - PDF Download.pdf
 
Listing Turkey - Resim Modern Catalog Istanbul
Listing Turkey - Resim Modern Catalog IstanbulListing Turkey - Resim Modern Catalog Istanbul
Listing Turkey - Resim Modern Catalog Istanbul
 
Kolte Patil Universe Hinjewadi Pune Brochure.pdf
Kolte Patil Universe Hinjewadi Pune Brochure.pdfKolte Patil Universe Hinjewadi Pune Brochure.pdf
Kolte Patil Universe Hinjewadi Pune Brochure.pdf
 
Sankla East World Hadapsar Pune Brochure.pdf
Sankla East World Hadapsar Pune Brochure.pdfSankla East World Hadapsar Pune Brochure.pdf
Sankla East World Hadapsar Pune Brochure.pdf
 
Triaa Housing Lohegaon Pune E-Brochure.pdf
Triaa Housing Lohegaon Pune  E-Brochure.pdfTriaa Housing Lohegaon Pune  E-Brochure.pdf
Triaa Housing Lohegaon Pune E-Brochure.pdf
 
Prestige Orchards Plots in Shamshabad, Mamidipalli, Hyderabad pdf.pdf
Prestige Orchards Plots in Shamshabad, Mamidipalli, Hyderabad pdf.pdfPrestige Orchards Plots in Shamshabad, Mamidipalli, Hyderabad pdf.pdf
Prestige Orchards Plots in Shamshabad, Mamidipalli, Hyderabad pdf.pdf
 
Clemson Engineering Consultant Dubai For Innovative and Sustainable Engineeri...
Clemson Engineering Consultant Dubai For Innovative and Sustainable Engineeri...Clemson Engineering Consultant Dubai For Innovative and Sustainable Engineeri...
Clemson Engineering Consultant Dubai For Innovative and Sustainable Engineeri...
 
Listing Turkey - Viva Perla Maltepe Catalog
Listing Turkey - Viva Perla Maltepe CatalogListing Turkey - Viva Perla Maltepe Catalog
Listing Turkey - Viva Perla Maltepe Catalog
 
Anandtara Iris Residences Mundhwa Pune Brochure.pdf
Anandtara Iris Residences Mundhwa Pune Brochure.pdfAnandtara Iris Residences Mundhwa Pune Brochure.pdf
Anandtara Iris Residences Mundhwa Pune Brochure.pdf
 
Listing Turkey Green life Istanbul Eyup Catalog
Listing Turkey Green life Istanbul Eyup CatalogListing Turkey Green life Istanbul Eyup Catalog
Listing Turkey Green life Istanbul Eyup Catalog
 
SVN Live 4.15.24 Weekly Property Broadcast
SVN Live 4.15.24 Weekly Property BroadcastSVN Live 4.15.24 Weekly Property Broadcast
SVN Live 4.15.24 Weekly Property Broadcast
 
The Role of Mortgage Brokers in Retirement Housing: Key Considerations
The Role of Mortgage Brokers in Retirement Housing: Key ConsiderationsThe Role of Mortgage Brokers in Retirement Housing: Key Considerations
The Role of Mortgage Brokers in Retirement Housing: Key Considerations
 
Purva Park Hill Kanakapura Road Bangalore.pdf
Purva Park Hill  Kanakapura Road Bangalore.pdfPurva Park Hill  Kanakapura Road Bangalore.pdf
Purva Park Hill Kanakapura Road Bangalore.pdf
 

Toronto central q1 2013

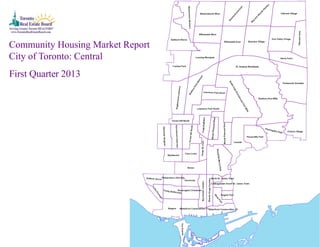
  • 1. Community Housing Market Report City of Toronto: Central First Quarter 2013
  • 2. First Quarter 2013 Toronto Real Estate Board *The source for all slides is the Toronto Real Estate Board. Some statistics are not reported when the number of transactions is two (2) or less. Statistics are updated on a monthly basis. Quarterly community statistics in this report may not match quarterly sums calculated from past TREB publications. 1 ALL HOME TYPES, FIRST QUARTER 2013 TORONTO C01 COMMUNITY BREAKDOWN Sales Dollar Volume Average Price Median Price New Listings Active Listings Avg. SP/LP Avg. DOM Toronto C01 772 $353,952,372 $458,488 $393,900 2,169 1,272 98% 32 Dufferin Grove 16 $6,717,000 $419,813 $372,500 31 13 97% 27 Palmerston-Little Italy 18 $16,111,500 $895,083 $814,000 35 19 97% 32 University 11 $10,342,266 $940,206 $1,000,000 21 11 97% 23 Bay Street Corridor 127 $60,216,465 $474,145 $405,000 311 190 98% 33 Kensington-Chinatown 19 $8,584,800 $451,832 $425,000 49 36 98% 30 Trinity-Bellwoods 33 $21,562,172 $653,399 $670,000 50 26 102% 38 Little Portugal 37 $16,605,687 $448,802 $380,000 73 31 100% 30 Niagara 188 $75,842,039 $403,415 $367,500 508 268 99% 28 Waterfront Communities C1 323 $137,970,443 $427,153 $380,000 1,091 678 98% 34 The Islands 0 - - - 0 0 - - SUMMARY OF EXISTING HOME TRANSACTIONS Toronto C01 Community Breakdown
  • 3. First Quarter 2013 Toronto Real Estate Board *The source for all slides is the Toronto Real Estate Board. Some statistics are not reported when the number of transactions is two (2) or less. Statistics are updated on a monthly basis. Quarterly community statistics in this report may not match quarterly sums calculated from past TREB publications. 2 2 4 0 3 7 0 Number of Transactions* $595 $389 $305 $617 $380 $315 Average/Median Selling Price (,000s)* Average Selling Price MedianSelling Price 4 9 0 6 12 0 Number of New Listings* 50% 44% 0% 50% 58% 0% Sales-to-New Listings Ratio* 22 16 34 Average Days on Market* 95% 98% 97% Average Sale Price to List Price Ratio* Toronto C01: Dufferin Grove
  • 4. First Quarter 2013 Toronto Real Estate Board *The source for all slides is the Toronto Real Estate Board. Some statistics are not reported when the number of transactions is two (2) or less. Statistics are updated on a monthly basis. Quarterly community statistics in this report may not match quarterly sums calculated from past TREB publications. 3 1 12 2 0 3 0 Number of Transactions* $919 $747$787 $540 Average/Median Selling Price (,000s)* Average Selling Price MedianSelling Price 5 15 4 1 10 0 Number of New Listings* 20% 80% 50% 0% 30% 0% Sales-to-New Listings Ratio* 28 66 Average Days on Market* 97% 91% Average Sale Price to List Price Ratio* Toronto C01: Palmerston-Little Italy
  • 5. First Quarter 2013 Toronto Real Estate Board *The source for all slides is the Toronto Real Estate Board. Some statistics are not reported when the number of transactions is two (2) or less. Statistics are updated on a monthly basis. Quarterly community statistics in this report may not match quarterly sums calculated from past TREB publications. 4 1 5 2 0 3 0 Number of Transactions* $1,041 $547 $1,065 $503 Average/Median Selling Price (,000s)* Average Selling Price MedianSelling Price 0 7 5 0 9 0 Number of New Listings* 0% 71% 40% 0% 33% 0% Sales-to-New Listings Ratio* 15 35 Average Days on Market* 99% 96% Average Sale Price to List Price Ratio* Toronto C01: University
  • 6. First Quarter 2013 Toronto Real Estate Board *The source for all slides is the Toronto Real Estate Board. Some statistics are not reported when the number of transactions is two (2) or less. Statistics are updated on a monthly basis. Quarterly community statistics in this report may not match quarterly sums calculated from past TREB publications. 5 0 0 0 0 127 0 Number of Transactions* $474 $405 Average/Median Selling Price (,000s)* Average Selling Price MedianSelling Price 0 0 0 0 311 0 Number of New Listings* 0% 0% 0% 0% 41% 0% Sales-to-New Listings Ratio* 33 Average Days on Market* 98% Average Sale Price to List Price Ratio* Toronto C01: Bay Street Corridor
  • 7. First Quarter 2013 Toronto Real Estate Board *The source for all slides is the Toronto Real Estate Board. Some statistics are not reported when the number of transactions is two (2) or less. Statistics are updated on a monthly basis. Quarterly community statistics in this report may not match quarterly sums calculated from past TREB publications. 6 1 1 0 4 13 0 Number of Transactions* $394 $424 $367 $425 Average/Median Selling Price (,000s)* Average Selling Price MedianSelling Price 1 2 1 5 40 0 Number of New Listings* 100% 50% 0% 80% 33% 0% Sales-to-New Listings Ratio* 35 24 Average Days on Market* 99% 98% Average Sale Price to List Price Ratio* Toronto C01: Kensington-Chinatown
  • 8. First Quarter 2013 Toronto Real Estate Board *The source for all slides is the Toronto Real Estate Board. Some statistics are not reported when the number of transactions is two (2) or less. Statistics are updated on a monthly basis. Quarterly community statistics in this report may not match quarterly sums calculated from past TREB publications. 7 1 7 8 1 16 0 Number of Transactions* $895 $768 $473 $940 $746 $432 Average/Median Selling Price (,000s)* Average Selling Price MedianSelling Price 1 19 10 1 19 0 Number of New Listings* 100% 37% 80% 100% 84% 0% Sales-to-New Listings Ratio* 17 21 50 Average Days on Market* 105% 103% 100% Average Sale Price to List Price Ratio* Toronto C01: Trinity-Bellwoods
  • 9. First Quarter 2013 Toronto Real Estate Board *The source for all slides is the Toronto Real Estate Board. Some statistics are not reported when the number of transactions is two (2) or less. Statistics are updated on a monthly basis. Quarterly community statistics in this report may not match quarterly sums calculated from past TREB publications. 8 1 5 2 4 25 0 Number of Transactions* $661 $535 $361 $650 $537 $332 Average/Median Selling Price (,000s)* Average Selling Price MedianSelling Price 3 6 4 4 56 0 Number of New Listings* 33% 83% 50% 100% 45% 0% Sales-to-New Listings Ratio* 12 30 36 Average Days on Market* 104% 99% 99% Average Sale Price to List Price Ratio* Toronto C01: Little Portugal
  • 10. First Quarter 2013 Toronto Real Estate Board *The source for all slides is the Toronto Real Estate Board. Some statistics are not reported when the number of transactions is two (2) or less. Statistics are updated on a monthly basis. Quarterly community statistics in this report may not match quarterly sums calculated from past TREB publications. 9 1 3 4 26 154 0 Number of Transactions* $772 $783 $432 $379 $678 $795 $452 $354 Average/Median Selling Price (,000s)* Average Selling Price MedianSelling Price 0 5 7 39 455 2 Number of New Listings* 0% 60% 57% 67% 34% 0% Sales-to-New Listings Ratio* 17 4 26 28 Average Days on Market* 99% 106% 98% 98% Average Sale Price to List Price Ratio* Toronto C01: Niagara
  • 11. First Quarter 2013 Toronto Real Estate Board *The source for all slides is the Toronto Real Estate Board. Some statistics are not reported when the number of transactions is two (2) or less. Statistics are updated on a monthly basis. Quarterly community statistics in this report may not match quarterly sums calculated from past TREB publications. 10 0 0 0 2 321 0 Number of Transactions* $426 $379 Average/Median Selling Price (,000s)* Average Selling Price MedianSelling Price 2 0 0 11 1075 3 Number of New Listings* 0% 0% 0% 18% 30% 0% Sales-to-New Listings Ratio* 35 Average Days on Market* 98% Average Sale Price to List Price Ratio* Toronto C01: Waterfront Communities C1
  • 12. First Quarter 2013 Toronto Real Estate Board *The source for all slides is the Toronto Real Estate Board. Some statistics are not reported when the number of transactions is two (2) or less. Statistics are updated on a monthly basis. Quarterly community statistics in this report may not match quarterly sums calculated from past TREB publications. 11 0 0 0 0 0 0 Number of Transactions* Average/Median Selling Price (,000s)* Average Selling Price MedianSelling Price 0 0 0 0 0 0 Number of New Listings* 0% 0% 0% 0% 0% 0% Sales-to-New Listings Ratio* Average Days on Market* Average Sale Price to List Price Ratio* Toronto C01: The Islands
  • 13. First Quarter 2013 Toronto Real Estate Board *The source for all slides is the Toronto Real Estate Board. Some statistics are not reported when the number of transactions is two (2) or less. Statistics are updated on a monthly basis. Quarterly community statistics in this report may not match quarterly sums calculated from past TREB publications. 12 ALL HOME TYPES, FIRST QUARTER 2013 TORONTO C02 COMMUNITY BREAKDOWN Sales Dollar Volume Average Price Median Price New Listings Active Listings Avg. SP/LP Avg. DOM Toronto C02 122 $124,483,900 $1,020,360 $851,000 377 253 98% 27 Yonge-St. Clair 36 $39,962,700 $1,110,075 $942,000 65 36 97% 32 Casa Loma 16 $19,388,950 $1,211,809 $1,199,000 69 43 97% 31 Wychwood 13 $10,756,500 $827,423 $725,000 26 10 103% 10 Annex 57 $54,375,750 $953,961 $785,000 217 164 97% 26 SUMMARY OF EXISTING HOME TRANSACTIONS Toronto C02 Community Breakdown
  • 14. First Quarter 2013 Toronto Real Estate Board *The source for all slides is the Toronto Real Estate Board. Some statistics are not reported when the number of transactions is two (2) or less. Statistics are updated on a monthly basis. Quarterly community statistics in this report may not match quarterly sums calculated from past TREB publications. 13 5 9 2 0 19 1 Number of Transactions* $2,212 $1,661 $600 $1,979 $1,650 $545 Average/Median Selling Price (,000s)* Average Selling Price MedianSelling Price 11 11 4 0 37 2 Number of New Listings* 45% 82% 50% 0% 51% 50% Sales-to-New Listings Ratio* 25 13 39 Average Days on Market* 99% 96% 98% Average Sale Price to List Price Ratio* Toronto C02: Yonge-St. Clair
  • 15. First Quarter 2013 Toronto Real Estate Board *The source for all slides is the Toronto Real Estate Board. Some statistics are not reported when the number of transactions is two (2) or less. Statistics are updated on a monthly basis. Quarterly community statistics in this report may not match quarterly sums calculated from past TREB publications. 14 5 2 2 0 7 0 Number of Transactions* $1,317 $1,014 $1,335 $875 Average/Median Selling Price (,000s)* Average Selling Price MedianSelling Price 19 6 5 3 36 0 Number of New Listings* 26% 33% 40% 0% 19% 0% Sales-to-New Listings Ratio* 33 40 Average Days on Market* 96% 98% Average Sale Price to List Price Ratio* Toronto C02: Casa Loma
  • 16. First Quarter 2013 Toronto Real Estate Board *The source for all slides is the Toronto Real Estate Board. Some statistics are not reported when the number of transactions is two (2) or less. Statistics are updated on a monthly basis. Quarterly community statistics in this report may not match quarterly sums calculated from past TREB publications. 15 7 4 2 0 0 0 Number of Transactions* $971 $764 $862 $673 Average/Median Selling Price (,000s)* Average Selling Price MedianSelling Price 15 6 1 0 0 4 Number of New Listings* 47% 67% 200% 0% 0% 0% Sales-to-New Listings Ratio* 9 7 Average Days on Market* 105% 102% Average Sale Price to List Price Ratio* Toronto C02: Wychwood
  • 17. First Quarter 2013 Toronto Real Estate Board *The source for all slides is the Toronto Real Estate Board. Some statistics are not reported when the number of transactions is two (2) or less. Statistics are updated on a monthly basis. Quarterly community statistics in this report may not match quarterly sums calculated from past TREB publications. 16 7 9 5 2 34 0 Number of Transactions* $1,323 $1,293 $861 $784 $1,110 $990 $840 $663 Average/Median Selling Price (,000s)* Average Selling Price MedianSelling Price 20 24 8 12 153 0 Number of New Listings* 35% 38% 63% 17% 22% 0% Sales-to-New Listings Ratio* 13 30 27 30 Average Days on Market* 97% 100% 97% 95% Average Sale Price to List Price Ratio* Toronto C02: Annex
  • 18. First Quarter 2013 Toronto Real Estate Board *The source for all slides is the Toronto Real Estate Board. Some statistics are not reported when the number of transactions is two (2) or less. Statistics are updated on a monthly basis. Quarterly community statistics in this report may not match quarterly sums calculated from past TREB publications. 17 ALL HOME TYPES, FIRST QUARTER 2013 TORONTO C03 COMMUNITY BREAKDOWN Sales Dollar Volume Average Price Median Price New Listings Active Listings Avg. SP/LP Avg. DOM Toronto C03 101 $87,857,029 $869,872 $680,216 212 104 99% 22 Humewood-Cedarvale 26 $22,329,004 $858,808 $766,000 40 12 100% 12 Oakwood-Vaughan 33 $16,190,866 $490,632 $451,000 55 20 99% 26 Forest Hill South 21 $28,476,000 $1,356,000 $1,165,000 79 59 95% 37 Yonge-Eglinton 21 $20,861,159 $993,389 $976,000 38 13 103% 11 SUMMARY OF EXISTING HOME TRANSACTIONS Toronto C03 Community Breakdown
  • 19. First Quarter 2013 Toronto Real Estate Board *The source for all slides is the Toronto Real Estate Board. Some statistics are not reported when the number of transactions is two (2) or less. Statistics are updated on a monthly basis. Quarterly community statistics in this report may not match quarterly sums calculated from past TREB publications. 18 20 4 0 0 0 2 Number of Transactions* $962 $660 $901 $668 Average/Median Selling Price (,000s)* Average Selling Price MedianSelling Price 32 3 0 0 0 5 Number of New Listings* 63% 133% 0% 0% 0% 40% Sales-to-New Listings Ratio* 12 14 Average Days on Market* 100% 105% Average Sale Price to List Price Ratio* Toronto C03: Humewood-Cedarvale
  • 20. First Quarter 2013 Toronto Real Estate Board *The source for all slides is the Toronto Real Estate Board. Some statistics are not reported when the number of transactions is two (2) or less. Statistics are updated on a monthly basis. Quarterly community statistics in this report may not match quarterly sums calculated from past TREB publications. 19 22 11 0 0 0 0 Number of Transactions* $503 $466$463 $438 Average/Median Selling Price (,000s)* Average Selling Price MedianSelling Price 33 21 1 0 0 0 Number of New Listings* 67% 52% 0% 0% 0% 0% Sales-to-New Listings Ratio* 28 21 Average Days on Market* 98% 102% Average Sale Price to List Price Ratio* Toronto C03: Oakwood-Vaughan
  • 21. First Quarter 2013 Toronto Real Estate Board *The source for all slides is the Toronto Real Estate Board. Some statistics are not reported when the number of transactions is two (2) or less. Statistics are updated on a monthly basis. Quarterly community statistics in this report may not match quarterly sums calculated from past TREB publications. 20 11 0 0 3 6 1 Number of Transactions* $2,156 $665 $400 $2,100 $460 $395 Average/Median Selling Price (,000s)* Average Selling Price MedianSelling Price 51 2 0 6 17 3 Number of New Listings* 22% 0% 0% 50% 35% 33% Sales-to-New Listings Ratio* 48 23 28 Average Days on Market* 95% 93% 100% Average Sale Price to List Price Ratio* Toronto C03: Forest Hill South
  • 22. First Quarter 2013 Toronto Real Estate Board *The source for all slides is the Toronto Real Estate Board. Some statistics are not reported when the number of transactions is two (2) or less. Statistics are updated on a monthly basis. Quarterly community statistics in this report may not match quarterly sums calculated from past TREB publications. 21 13 7 0 0 1 0 Number of Transactions* $1,111 $851 $1,170 $880 Average/Median Selling Price (,000s)* Average Selling Price MedianSelling Price 20 10 2 2 4 0 Number of New Listings* 65% 70% 0% 0% 25% 0% Sales-to-New Listings Ratio* 8 15 Average Days on Market* 103% 103% Average Sale Price to List Price Ratio* Toronto C03: Yonge-Eglinton
  • 23. First Quarter 2013 Toronto Real Estate Board *The source for all slides is the Toronto Real Estate Board. Some statistics are not reported when the number of transactions is two (2) or less. Statistics are updated on a monthly basis. Quarterly community statistics in this report may not match quarterly sums calculated from past TREB publications. 22 ALL HOME TYPES, FIRST QUARTER 2013 TORONTO C04 COMMUNITY BREAKDOWN Sales Dollar Volume Average Price Median Price New Listings Active Listings Avg. SP/LP Avg. DOM Toronto C04 214 $236,222,665 $1,103,844 $1,049,658 471 213 99% 22 Englemount-Lawrence 33 $21,889,000 $663,303 $675,000 66 38 98% 30 Bedford Park-Nortown 85 $105,850,928 $1,245,305 $1,200,000 212 94 99% 26 Lawrence Park North 42 $45,695,019 $1,087,977 $1,009,500 73 23 100% 13 Lawrence Park South 36 $43,776,300 $1,216,008 $1,062,450 78 36 98% 16 Forest Hill North 18 $19,011,418 $1,056,190 $1,199,509 42 22 97% 23 SUMMARY OF EXISTING HOME TRANSACTIONS Toronto C04 Community Breakdown
  • 24. First Quarter 2013 Toronto Real Estate Board *The source for all slides is the Toronto Real Estate Board. Some statistics are not reported when the number of transactions is two (2) or less. Statistics are updated on a monthly basis. Quarterly community statistics in this report may not match quarterly sums calculated from past TREB publications. 23 19 0 0 2 12 0 Number of Transactions* $858 $397 $812 $352 Average/Median Selling Price (,000s)* Average Selling Price MedianSelling Price 34 0 1 4 24 3 Number of New Listings* 56% 0% 0% 50% 50% 0% Sales-to-New Listings Ratio* 20 44 Average Days on Market* 98% 97% Average Sale Price to List Price Ratio* Toronto C04: Englemount-Lawrence
  • 25. First Quarter 2013 Toronto Real Estate Board *The source for all slides is the Toronto Real Estate Board. Some statistics are not reported when the number of transactions is two (2) or less. Statistics are updated on a monthly basis. Quarterly community statistics in this report may not match quarterly sums calculated from past TREB publications. 24 63 1 0 0 21 0 Number of Transactions* $1,490 $531 $1,485 $475 Average/Median Selling Price (,000s)* Average Selling Price MedianSelling Price 169 2 4 0 37 0 Number of New Listings* 37% 50% 0% 0% 57% 0% Sales-to-New Listings Ratio* 22 37 Average Days on Market* 100% 98% Average Sale Price to List Price Ratio* Toronto C04: Bedford Park-Nortown
  • 26. First Quarter 2013 Toronto Real Estate Board *The source for all slides is the Toronto Real Estate Board. Some statistics are not reported when the number of transactions is two (2) or less. Statistics are updated on a monthly basis. Quarterly community statistics in this report may not match quarterly sums calculated from past TREB publications. 25 31 8 0 1 2 0 Number of Transactions* $1,222 $796 $1,150 $771 Average/Median Selling Price (,000s)* Average Selling Price MedianSelling Price 55 10 2 2 4 0 Number of New Listings* 56% 80% 0% 50% 50% 0% Sales-to-New Listings Ratio* 14 5 Average Days on Market* 99% 104% Average Sale Price to List Price Ratio* Toronto C04: Lawrence Park North
  • 27. First Quarter 2013 Toronto Real Estate Board *The source for all slides is the Toronto Real Estate Board. Some statistics are not reported when the number of transactions is two (2) or less. Statistics are updated on a monthly basis. Quarterly community statistics in this report may not match quarterly sums calculated from past TREB publications. 26 26 2 0 0 8 0 Number of Transactions* $1,476 $482 $1,363 $473 Average/Median Selling Price (,000s)* Average Selling Price MedianSelling Price 55 5 0 0 18 0 Number of New Listings* 47% 40% 0% 0% 44% 0% Sales-to-New Listings Ratio* 15 22 Average Days on Market* 97% 99% Average Sale Price to List Price Ratio* Toronto C04: Lawrence Park South
  • 28. First Quarter 2013 Toronto Real Estate Board *The source for all slides is the Toronto Real Estate Board. Some statistics are not reported when the number of transactions is two (2) or less. Statistics are updated on a monthly basis. Quarterly community statistics in this report may not match quarterly sums calculated from past TREB publications. 27 13 0 1 0 1 3 Number of Transactions* $1,332 $286 $1,295 $273 Average/Median Selling Price (,000s)* Average Selling Price MedianSelling Price 22 0 3 0 7 10 Number of New Listings* 59% 0% 33% 0% 14% 30% Sales-to-New Listings Ratio* 16 53 Average Days on Market* 96% 104% Average Sale Price to List Price Ratio* Toronto C04: Forest Hill North
  • 29. First Quarter 2013 Toronto Real Estate Board *The source for all slides is the Toronto Real Estate Board. Some statistics are not reported when the number of transactions is two (2) or less. Statistics are updated on a monthly basis. Quarterly community statistics in this report may not match quarterly sums calculated from past TREB publications. 28 ALL HOME TYPES, FIRST QUARTER 2013 TORONTO C06 COMMUNITY BREAKDOWN Sales Dollar Volume Average Price Median Price New Listings Active Listings Avg. SP/LP Avg. DOM Toronto C06 62 $39,312,089 $634,066 $668,000 164 101 97% 30 Bathurst Manor 24 $14,804,671 $616,861 $647,500 55 31 98% 24 Clanton Park 38 $24,507,418 $644,932 $699,500 109 70 97% 33 SUMMARY OF EXISTING HOME TRANSACTIONS Toronto C06 Community Breakdown
  • 30. First Quarter 2013 Toronto Real Estate Board *The source for all slides is the Toronto Real Estate Board. Some statistics are not reported when the number of transactions is two (2) or less. Statistics are updated on a monthly basis. Quarterly community statistics in this report may not match quarterly sums calculated from past TREB publications. 29 16 1 0 1 6 0 Number of Transactions* $734 $357 $675 $360 Average/Median Selling Price (,000s)* Average Selling Price MedianSelling Price 34 1 0 2 18 0 Number of New Listings* 47% 100% 0% 50% 33% 0% Sales-to-New Listings Ratio* 24 29 Average Days on Market* 98% 98% Average Sale Price to List Price Ratio* Toronto C06: Bathurst Manor
  • 31. First Quarter 2013 Toronto Real Estate Board *The source for all slides is the Toronto Real Estate Board. Some statistics are not reported when the number of transactions is two (2) or less. Statistics are updated on a monthly basis. Quarterly community statistics in this report may not match quarterly sums calculated from past TREB publications. 30 22 0 0 0 16 0 Number of Transactions* $892 $305 $813 $294 Average/Median Selling Price (,000s)* Average Selling Price MedianSelling Price 42 0 0 0 67 0 Number of New Listings* 52% 0% 0% 0% 24% 0% Sales-to-New Listings Ratio* 25 45 Average Days on Market* 97% 97% Average Sale Price to List Price Ratio* Toronto C06: Clanton Park
  • 32. First Quarter 2013 Toronto Real Estate Board *The source for all slides is the Toronto Real Estate Board. Some statistics are not reported when the number of transactions is two (2) or less. Statistics are updated on a monthly basis. Quarterly community statistics in this report may not match quarterly sums calculated from past TREB publications. 31 ALL HOME TYPES, FIRST QUARTER 2013 TORONTO C07 COMMUNITY BREAKDOWN Sales Dollar Volume Average Price Median Price New Listings Active Listings Avg. SP/LP Avg. DOM Toronto C07 221 $119,952,523 $542,772 $406,000 538 296 98% 32 Westminster-Branson 49 $19,734,135 $402,737 $342,000 110 61 98% 30 Newtonbrook West 63 $34,339,200 $545,067 $499,900 137 69 98% 31 Willowdale West 66 $36,988,638 $560,434 $402,375 176 97 97% 32 Lansing-Westgate 43 $28,890,550 $671,873 $449,000 115 69 99% 36 SUMMARY OF EXISTING HOME TRANSACTIONS Toronto C07 Community Breakdown
  • 33. First Quarter 2013 Toronto Real Estate Board *The source for all slides is the Toronto Real Estate Board. Some statistics are not reported when the number of transactions is two (2) or less. Statistics are updated on a monthly basis. Quarterly community statistics in this report may not match quarterly sums calculated from past TREB publications. 32 $747 $537 $386 $296 $780 $535 $402 $295 Average/Median Selling Price (,000s)* Average Selling Price MedianSelling Price 16 8 0 11 74 1 Number of New Listings* 38% 88% 0% 64% 38% 100% Sales-to-New Listings Ratio* 8 18 37 36 Average Days on Market* 100% 101% 98% 97% Average Sale Price to List Price Ratio* Toronto C07: Westminster-Branson 6 7 0 7 28 1 Number of Transactions*
  • 34. First Quarter 2013 Toronto Real Estate Board *The source for all slides is the Toronto Real Estate Board. Some statistics are not reported when the number of transactions is two (2) or less. Statistics are updated on a monthly basis. Quarterly community statistics in this report may not match quarterly sums calculated from past TREB publications. 33 23 6 2 3 28 1 Number of Transactions* $792 $509 $381 $358 $739 $500 $388 $346 Average/Median Selling Price (,000s)* Average Selling Price MedianSelling Price 57 6 6 7 60 1 Number of New Listings* 40% 100% 33% 43% 47% 100% Sales-to-New Listings Ratio* 33 37 40 29 Average Days on Market* 98% 98% 98% 97% Average Sale Price to List Price Ratio* Toronto C07: Newtonbrook West
  • 35. First Quarter 2013 Toronto Real Estate Board *The source for all slides is the Toronto Real Estate Board. Some statistics are not reported when the number of transactions is two (2) or less. Statistics are updated on a monthly basis. Quarterly community statistics in this report may not match quarterly sums calculated from past TREB publications. 34 19 0 6 1 40 0 Number of Transactions* $937 $694 $356 $795 $682 $356 Average/Median Selling Price (,000s)* Average Selling Price MedianSelling Price 61 0 8 3 104 0 Number of New Listings* 31% 0% 75% 33% 38% 0% Sales-to-New Listings Ratio* 27 54 31 Average Days on Market* 97% 99% 97% Average Sale Price to List Price Ratio* Toronto C07: Willowdale West
  • 36. First Quarter 2013 Toronto Real Estate Board *The source for all slides is the Toronto Real Estate Board. Some statistics are not reported when the number of transactions is two (2) or less. Statistics are updated on a monthly basis. Quarterly community statistics in this report may not match quarterly sums calculated from past TREB publications. 35 17 0 0 0 26 0 Number of Transactions* $1,140 $366 $1,020 $345 Average/Median Selling Price (,000s)* Average Selling Price MedianSelling Price 63 0 0 0 51 1 Number of New Listings* 27% 0% 0% 0% 51% 0% Sales-to-New Listings Ratio* 16 49 Average Days on Market* 100% 98% Average Sale Price to List Price Ratio* Toronto C07: Lansing-Westgate
  • 37. First Quarter 2013 Toronto Real Estate Board *The source for all slides is the Toronto Real Estate Board. Some statistics are not reported when the number of transactions is two (2) or less. Statistics are updated on a monthly basis. Quarterly community statistics in this report may not match quarterly sums calculated from past TREB publications. 36 Toronto C08 Community Breakdown ALL HOME TYPES, FIRST QUARTER 2013 TORONTO C08 COMMUNITY BREAKDOWN Sales Dollar Volume Average Price Median Price New Listings Active Listings Avg. SP/LP Avg. DOM Toronto C08 300 $135,431,494 $451,438 $387,000 671 338 99% 29 Church-Yonge Corridor 112 $47,429,926 $423,481 $393,500 239 122 98% 33 North St. James Town 6 $2,160,800 $360,133 $344,400 30 19 99% 58 Cabbagetown-South St. James Town49 $27,738,060 $566,083 $405,000 86 33 101% 21 Regent Park 20 $8,504,190 $425,210 $347,500 53 30 99% 27 Moss Park 69 $30,730,318 $445,367 $403,000 164 84 99% 26 Waterfront Communities C8 45 $18,868,200 $419,293 $370,000 99 50 98% 27 SUMMARY OF EXISTING HOME TRANSACTIONS
  • 38. First Quarter 2013 Toronto Real Estate Board *The source for all slides is the Toronto Real Estate Board. Some statistics are not reported when the number of transactions is two (2) or less. Statistics are updated on a monthly basis. Quarterly community statistics in this report may not match quarterly sums calculated from past TREB publications. 37 0 2 1 3 104 2 Number of Transactions* $671 $406 $730 $391 Average/Median Selling Price (,000s)* Average Selling Price MedianSelling Price 1 3 3 8 221 3 Number of New Listings* 0% 67% 33% 38% 47% 67% Sales-to-New Listings Ratio* 31 33 Average Days on Market* 97% 98% Average Sale Price to List Price Ratio* Toronto C08: Church-Yonge Corridor
  • 39. First Quarter 2013 Toronto Real Estate Board *The source for all slides is the Toronto Real Estate Board. Some statistics are not reported when the number of transactions is two (2) or less. Statistics are updated on a monthly basis. Quarterly community statistics in this report may not match quarterly sums calculated from past TREB publications. 38 0 0 0 0 6 0 Number of Transactions* $360 $344 Average/Median Selling Price (,000s)* Average Selling Price MedianSelling Price 0 0 0 1 29 0 Number of New Listings* 0% 0% 0% 0% 21% 0% Sales-to-New Listings Ratio* 58 Average Days on Market* 99% Average Sale Price to List Price Ratio* Toronto C08: North St. James Town
  • 40. First Quarter 2013 Toronto Real Estate Board *The source for all slides is the Toronto Real Estate Board. Some statistics are not reported when the number of transactions is two (2) or less. Statistics are updated on a monthly basis. Quarterly community statistics in this report may not match quarterly sums calculated from past TREB publications. 39 2 7 10 6 24 0 Number of Transactions* $957 $867 $339 $345 $940 $765 $360 $320 Average/Median Selling Price (,000s)* Average Selling Price MedianSelling Price 4 14 15 14 39 0 Number of New Listings* 50% 50% 67% 43% 62% 0% Sales-to-New Listings Ratio* 7 11 15 32 Average Days on Market* 101% 100% 99% 98% Average Sale Price to List Price Ratio* Toronto C08: Cabbagetown-South St. James Town
  • 41. First Quarter 2013 Toronto Real Estate Board *The source for all slides is the Toronto Real Estate Board. Some statistics are not reported when the number of transactions is two (2) or less. Statistics are updated on a monthly basis. Quarterly community statistics in this report may not match quarterly sums calculated from past TREB publications. 40 0 2 1 2 15 0 Number of Transactions* $362 $330 Average/Median Selling Price (,000s)* Average Selling Price MedianSelling Price 0 2 2 3 46 0 Number of New Listings* 0% 100% 50% 67% 33% 0% Sales-to-New Listings Ratio* 25 Average Days on Market* 99% Average Sale Price to List Price Ratio* Toronto C08: Regent Park
  • 42. First Quarter 2013 Toronto Real Estate Board *The source for all slides is the Toronto Real Estate Board. Some statistics are not reported when the number of transactions is two (2) or less. Statistics are updated on a monthly basis. Quarterly community statistics in this report may not match quarterly sums calculated from past TREB publications. 41 0 7 1 1 60 0 Number of Transactions* $722 $405 $675 $377 Average/Median Selling Price (,000s)* Average Selling Price MedianSelling Price 2 9 2 3 148 0 Number of New Listings* 0% 78% 50% 33% 41% 0% Sales-to-New Listings Ratio* 25 26 Average Days on Market* 99% 99% Average Sale Price to List Price Ratio* Toronto C08: Moss Park
  • 43. First Quarter 2013 Toronto Real Estate Board *The source for all slides is the Toronto Real Estate Board. Some statistics are not reported when the number of transactions is two (2) or less. Statistics are updated on a monthly basis. Quarterly community statistics in this report may not match quarterly sums calculated from past TREB publications. 42 0 0 1 0 44 0 Number of Transactions* $423 $370 Average/Median Selling Price (,000s)* Average Selling Price MedianSelling Price 0 0 1 0 98 0 Number of New Listings* 0% 0% 100% 0% 45% 0% Sales-to-New Listings Ratio* 31 Average Days on Market* 98% Average Sale Price to List Price Ratio* Toronto C08: Waterfront Communities C8
  • 44. First Quarter 2013 Toronto Real Estate Board *The source for all slides is the Toronto Real Estate Board. Some statistics are not reported when the number of transactions is two (2) or less. Statistics are updated on a monthly basis. Quarterly community statistics in this report may not match quarterly sums calculated from past TREB publications. 43 ALL HOME TYPES, FIRST QUARTER 2013 TORONTO C09 COMMUNITY BREAKDOWN Sales Dollar Volume Average Price Median Price New Listings Active Listings Avg. SP/LP Avg. DOM Toronto C09 54 $72,088,400 $1,334,970 $972,500 124 66 98% 25 Rosedale-Moore Park 54 $72,088,400 $1,334,970 $972,500 124 66 98% 25 SUMMARY OF EXISTING HOME TRANSACTIONS Toronto C09 Community Breakdown
  • 45. First Quarter 2013 Toronto Real Estate Board *The source for all slides is the Toronto Real Estate Board. Some statistics are not reported when the number of transactions is two (2) or less. Statistics are updated on a monthly basis. Quarterly community statistics in this report may not match quarterly sums calculated from past TREB publications. 44 22 5 0 4 15 8 Number of Transactions* $2,122 $1,802 $858 $596 $502 $1,868 $1,695 $873 $590 $468 Average/Median Selling Price (,000s)* Average Selling Price MedianSelling Price 47 7 3 6 42 19 Number of New Listings* 47% 71% 0% 67% 36% 42% Sales-to-New Listings Ratio* 21 18 13 29 41 Average Days on Market* 98% 100% 97% 97% 98% Average Sale Price to List Price Ratio* Toronto C09: Rosedale-Moore Park
  • 46. First Quarter 2013 Toronto Real Estate Board *The source for all slides is the Toronto Real Estate Board. Some statistics are not reported when the number of transactions is two (2) or less. Statistics are updated on a monthly basis. Quarterly community statistics in this report may not match quarterly sums calculated from past TREB publications. 45 ALL HOME TYPES, FIRST QUARTER 2013 TORONTO C10 COMMUNITY BREAKDOWN Sales Dollar Volume Average Price Median Price New Listings Active Listings Avg. SP/LP Avg. DOM Toronto C10 130 $77,652,144 $597,324 $487,450 275 123 101% 22 Mount Pleasant West 87 $44,532,444 $511,867 $423,000 179 80 100% 23 Mount Pleasant East 43 $33,119,700 $770,226 $741,000 96 43 102% 21 SUMMARY OF EXISTING HOME TRANSACTIONS Toronto C10 Community Breakdown
  • 47. First Quarter 2013 Toronto Real Estate Board *The source for all slides is the Toronto Real Estate Board. Some statistics are not reported when the number of transactions is two (2) or less. Statistics are updated on a monthly basis. Quarterly community statistics in this report may not match quarterly sums calculated from past TREB publications. 46 6 0 1 8 72 0 Number of Transactions* $1,339 $513 $436 $1,308 $441 $417 Average/Median Selling Price (,000s)* Average Selling Price MedianSelling Price 9 1 2 19 147 1 Number of New Listings* 67% 0% 50% 42% 49% 0% Sales-to-New Listings Ratio* 16 11 25 Average Days on Market* 106% 102% 98% Average Sale Price to List Price Ratio* Toronto C10: Mount Pleasant West
  • 48. First Quarter 2013 Toronto Real Estate Board *The source for all slides is the Toronto Real Estate Board. Some statistics are not reported when the number of transactions is two (2) or less. Statistics are updated on a monthly basis. Quarterly community statistics in this report may not match quarterly sums calculated from past TREB publications. 47 15 15 1 2 10 0 Number of Transactions* $1,023 $735 $409 $956 $704 $318 Average/Median Selling Price (,000s)* Average Selling Price MedianSelling Price 41 26 1 4 23 1 Number of New Listings* 37% 58% 100% 50% 43% 0% Sales-to-New Listings Ratio* 21 6 37 Average Days on Market* 102% 105% 100% Average Sale Price to List Price Ratio* Toronto C10: Mount Pleasant East
  • 49. First Quarter 2013 Toronto Real Estate Board *The source for all slides is the Toronto Real Estate Board. Some statistics are not reported when the number of transactions is two (2) or less. Statistics are updated on a monthly basis. Quarterly community statistics in this report may not match quarterly sums calculated from past TREB publications. 48 ALL HOME TYPES, FIRST QUARTER 2013 TORONTO C11 COMMUNITY BREAKDOWN Sales Dollar Volume Average Price Median Price New Listings Active Listings Avg. SP/LP Avg. DOM Toronto C11 104 $70,983,210 $682,531 $361,250 170 73 99% 34 Leaside 52 $59,594,797 $1,146,054 $1,135,500 75 15 100% 20 Thorncliffe Park 8 $1,900,000 $237,500 $230,750 12 6 97% 73 Flemingdon Park 44 $9,488,413 $215,646 $191,500 83 52 97% 44 SUMMARY OF EXISTING HOME TRANSACTIONS Toronto C11 Community Breakdown
  • 50. First Quarter 2013 Toronto Real Estate Board *The source for all slides is the Toronto Real Estate Board. Some statistics are not reported when the number of transactions is two (2) or less. Statistics are updated on a monthly basis. Quarterly community statistics in this report may not match quarterly sums calculated from past TREB publications. 49 34 10 1 0 7 0 Number of Transactions* $1,417 $764 $405 $1,394 $762 $402 Average/Median Selling Price (,000s)* Average Selling Price MedianSelling Price 57 10 1 0 7 0 Number of New Listings* 60% 100% 100% 0% 100% 0% Sales-to-New Listings Ratio* 20 6 44 Average Days on Market* 99% 103% 98% Average Sale Price to List Price Ratio* Toronto C11: Leaside
  • 51. First Quarter 2013 Toronto Real Estate Board *The source for all slides is the Toronto Real Estate Board. Some statistics are not reported when the number of transactions is two (2) or less. Statistics are updated on a monthly basis. Quarterly community statistics in this report may not match quarterly sums calculated from past TREB publications. 50 0 0 0 0 8 0 Number of Transactions* $238 $231 Average/Median Selling Price (,000s)* Average Selling Price MedianSelling Price 0 0 0 0 12 0 Number of New Listings* 0% 0% 0% 0% 67% 0% Sales-to-New Listings Ratio* 73 Average Days on Market* 97% Average Sale Price to List Price Ratio* Toronto C11: Thorncliffe Park
  • 52. First Quarter 2013 Toronto Real Estate Board *The source for all slides is the Toronto Real Estate Board. Some statistics are not reported when the number of transactions is two (2) or less. Statistics are updated on a monthly basis. Quarterly community statistics in this report may not match quarterly sums calculated from past TREB publications. 51 0 1 0 2 41 0 Number of Transactions* $208 $195 Average/Median Selling Price (,000s)* Average Selling Price MedianSelling Price 0 4 0 3 76 0 Number of New Listings* 0% 25% 0% 67% 54% 0% Sales-to-New Listings Ratio* 44 Average Days on Market* 96% Average Sale Price to List Price Ratio* Toronto C11: Flemingdon Park
  • 53. First Quarter 2013 Toronto Real Estate Board *The source for all slides is the Toronto Real Estate Board. Some statistics are not reported when the number of transactions is two (2) or less. Statistics are updated on a monthly basis. Quarterly community statistics in this report may not match quarterly sums calculated from past TREB publications. 52 ALL HOME TYPES, FIRST QUARTER 2013 TORONTO C12 COMMUNITY BREAKDOWN Sales Dollar Volume Average Price Median Price New Listings Active Listings Avg. SP/LP Avg. DOM Toronto C12 83 $161,456,788 $1,945,263 $1,842,000 231 147 97% 29 St. Andrew-Windfields 55 $98,011,888 $1,782,034 $1,825,000 139 75 97% 28 Bridle Path-Sunnybrook-York Mills 28 $63,444,900 $2,265,889 $1,965,000 92 72 96% 33 SUMMARY OF EXISTING HOME TRANSACTIONS Toronto C12 Community Breakdown
  • 54. First Quarter 2013 Toronto Real Estate Board *The source for all slides is the Toronto Real Estate Board. Some statistics are not reported when the number of transactions is two (2) or less. Statistics are updated on a monthly basis. Quarterly community statistics in this report may not match quarterly sums calculated from past TREB publications. 53 44 1 0 4 6 0 Number of Transactions* $2,079 $726 $508 $1,996 $735 $494 Average/Median Selling Price (,000s)* Average Selling Price MedianSelling Price 96 1 0 17 25 0 Number of New Listings* 46% 100% 0% 24% 24% 0% Sales-to-New Listings Ratio* 26 21 46 Average Days on Market* 97% 99% 97% Average Sale Price to List Price Ratio* Toronto C12: St. Andrew-Windfields
  • 55. First Quarter 2013 Toronto Real Estate Board *The source for all slides is the Toronto Real Estate Board. Some statistics are not reported when the number of transactions is two (2) or less. Statistics are updated on a monthly basis. Quarterly community statistics in this report may not match quarterly sums calculated from past TREB publications. 54 21 0 0 1 6 0 Number of Transactions* $2,633 $1,206 $2,500 $931 Average/Median Selling Price (,000s)* Average Selling Price MedianSelling Price 74 0 1 0 17 0 Number of New Listings* 28% 0% 0% 0% 35% 0% Sales-to-New Listings Ratio* 33 35 Average Days on Market* 96% 94% Average Sale Price to List Price Ratio* Toronto C12: Bridle Path-Sunnybrook-York Mills
  • 56. First Quarter 2013 Toronto Real Estate Board *The source for all slides is the Toronto Real Estate Board. Some statistics are not reported when the number of transactions is two (2) or less. Statistics are updated on a monthly basis. Quarterly community statistics in this report may not match quarterly sums calculated from past TREB publications. 55 ALL HOME TYPES, FIRST QUARTER 2013 TORONTO C13 COMMUNITY BREAKDOWN Sales Dollar Volume Average Price Median Price New Listings Active Listings Avg. SP/LP Avg. DOM Toronto C13 153 $94,022,590 $614,527 $445,000 290 133 99% 28 Parkwoods-Donalda 47 $26,746,600 $569,077 $505,000 77 29 100% 26 Banbury-Don Mills 78 $57,713,190 $739,913 $454,000 157 76 99% 28 Victoria Village 28 $9,562,800 $341,529 $258,000 56 28 98% 30 SUMMARY OF EXISTING HOME TRANSACTIONS Toronto C13 Community Breakdown
  • 57. First Quarter 2013 Toronto Real Estate Board *The source for all slides is the Toronto Real Estate Board. Some statistics are not reported when the number of transactions is two (2) or less. Statistics are updated on a monthly basis. Quarterly community statistics in this report may not match quarterly sums calculated from past TREB publications. 56 19 13 0 5 10 0 Number of Transactions* $870 $478 $355 $223 $830 $480 $348 $210 Average/Median Selling Price (,000s)* Average Selling Price MedianSelling Price 29 17 0 5 26 0 Number of New Listings* 66% 76% 0% 100% 38% 0% Sales-to-New Listings Ratio* 24 15 37 38 Average Days on Market* 101% 99% 97% 98% Average Sale Price to List Price Ratio* Toronto C13: Parkwoods-Donalda
  • 58. First Quarter 2013 Toronto Real Estate Board *The source for all slides is the Toronto Real Estate Board. Some statistics are not reported when the number of transactions is two (2) or less. Statistics are updated on a monthly basis. Quarterly community statistics in this report may not match quarterly sums calculated from past TREB publications. 57 27 1 1 4 45 0 Number of Transactions* $1,414 $564 $351 $1,308 $559 $332 Average/Median Selling Price (,000s)* Average Selling Price MedianSelling Price 48 1 3 4 101 0 Number of New Listings* 56% 100% 33% 100% 45% 0% Sales-to-New Listings Ratio* 19 15 34 Average Days on Market* 99% 100% 98% Average Sale Price to List Price Ratio* Toronto C13: Banbury-Don Mills
  • 59. First Quarter 2013 Toronto Real Estate Board *The source for all slides is the Toronto Real Estate Board. Some statistics are not reported when the number of transactions is two (2) or less. Statistics are updated on a monthly basis. Quarterly community statistics in this report may not match quarterly sums calculated from past TREB publications. 58 4 4 2 2 14 2 Number of Transactions* $617 $479 $223 $612 $463 $227 Average/Median Selling Price (,000s)* Average Selling Price MedianSelling Price 8 3 7 5 31 2 Number of New Listings* 50% 133% 29% 40% 45% 100% Sales-to-New Listings Ratio* 29 24 28 Average Days on Market* 99% 98% 98% Average Sale Price to List Price Ratio* Toronto C13: Victoria Village
  • 60. First Quarter 2013 Toronto Real Estate Board *The source for all slides is the Toronto Real Estate Board. Some statistics are not reported when the number of transactions is two (2) or less. Statistics are updated on a monthly basis. Quarterly community statistics in this report may not match quarterly sums calculated from past TREB publications. 59 ALL HOME TYPES, FIRST QUARTER 2013 TORONTO C14 COMMUNITY BREAKDOWN Sales Dollar Volume Average Price Median Price New Listings Active Listings Avg. SP/LP Avg. DOM Toronto C14 387 $230,999,375 $596,898 $430,000 838 432 98% 33 Newtonbrook East 76 $54,373,800 $715,445 $746,000 158 74 98% 31 Willowdale East 311 $176,625,575 $567,928 $420,000 680 358 97% 34 SUMMARY OF EXISTING HOME TRANSACTIONS Toronto C14 Community Breakdown
  • 61. First Quarter 2013 Toronto Real Estate Board *The source for all slides is the Toronto Real Estate Board. Some statistics are not reported when the number of transactions is two (2) or less. Statistics are updated on a monthly basis. Quarterly community statistics in this report may not match quarterly sums calculated from past TREB publications. 60 46 0 0 0 30 0 Number of Transactions* $973 $320 $897 $317 Average/Median Selling Price (,000s)* Average Selling Price MedianSelling Price 91 0 0 0 62 5 Number of New Listings* 51% 0% 0% 0% 48% 0% Sales-to-New Listings Ratio* 26 40 Average Days on Market* 98% 98% Average Sale Price to List Price Ratio* Toronto C14: Newtonbrook East
  • 62. First Quarter 2013 Toronto Real Estate Board *The source for all slides is the Toronto Real Estate Board. Some statistics are not reported when the number of transactions is two (2) or less. Statistics are updated on a monthly basis. Quarterly community statistics in this report may not match quarterly sums calculated from past TREB publications. 61 53 2 7 24 225 0 Number of Transactions* $1,269 $783 $603 $392 $1,180 $766 $621 $357 Average/Median Selling Price (,000s)* Average Selling Price MedianSelling Price 124 2 12 45 497 0 Number of New Listings* 43% 100% 58% 53% 45% 0% Sales-to-New Listings Ratio* 18 78 35 37 Average Days on Market* 97% 97% 98% 98% Average Sale Price to List Price Ratio* Toronto C14: Willowdale East
  • 63. First Quarter 2013 Toronto Real Estate Board *The source for all slides is the Toronto Real Estate Board. Some statistics are not reported when the number of transactions is two (2) or less. Statistics are updated on a monthly basis. Quarterly community statistics in this report may not match quarterly sums calculated from past TREB publications. 62 ALL HOME TYPES, FIRST QUARTER 2013 TORONTO C15 COMMUNITY BREAKDOWN Sales Dollar Volume Average Price Median Price New Listings Active Listings Avg. SP/LP Avg. DOM Toronto C15 282 $157,402,386 $558,164 $462,250 628 312 98% 30 Bayview Woods-Steeles 26 $19,664,400 $756,323 $776,950 61 34 97% 26 Hillcrest Village 56 $32,685,746 $583,674 $504,500 86 33 98% 23 Pleasant View 34 $15,882,994 $467,147 $504,900 44 9 100% 17 Don Valley Village 50 $27,857,988 $557,160 $563,750 114 47 98% 21 Bayview Village 92 $52,842,395 $574,374 $365,000 280 167 96% 46 Henry Farm 24 $8,468,863 $352,869 $296,000 43 22 99% 22 SUMMARY OF EXISTING HOME TRANSACTIONS Toronto C15 Community Breakdown
  • 64. First Quarter 2013 Toronto Real Estate Board *The source for all slides is the Toronto Real Estate Board. Some statistics are not reported when the number of transactions is two (2) or less. Statistics are updated on a monthly basis. Quarterly community statistics in this report may not match quarterly sums calculated from past TREB publications. 63 12 7 0 2 5 0 Number of Transactions* $924 $549 $778 $864 $565 $754 Average/Median Selling Price (,000s)* Average Selling Price MedianSelling Price 36 10 0 2 13 0 Number of New Listings* 33% 70% 0% 100% 38% 0% Sales-to-New Listings Ratio* 19 16 58 Average Days on Market* 97% 96% 97% Average Sale Price to List Price Ratio* Toronto C15: Bayview Woods-Steeles
  • 65. First Quarter 2013 Toronto Real Estate Board *The source for all slides is the Toronto Real Estate Board. Some statistics are not reported when the number of transactions is two (2) or less. Statistics are updated on a monthly basis. Quarterly community statistics in this report may not match quarterly sums calculated from past TREB publications. 64 24 11 0 12 9 0 Number of Transactions* $818 $482 $353 $392 $798 $480 $371 $420 Average/Median Selling Price (,000s)* Average Selling Price MedianSelling Price 31 20 0 21 13 1 Number of New Listings* 77% 55% 0% 57% 69% 0% Sales-to-New Listings Ratio* 16 32 15 41 Average Days on Market* 99% 98% 98% 96% Average Sale Price to List Price Ratio* Toronto C15: Hillcrest Village
  • 66. First Quarter 2013 Toronto Real Estate Board *The source for all slides is the Toronto Real Estate Board. Some statistics are not reported when the number of transactions is two (2) or less. Statistics are updated on a monthly basis. Quarterly community statistics in this report may not match quarterly sums calculated from past TREB publications. 65 6 12 0 3 11 2 Number of Transactions* $751 $533 $409 $235 $731 $549 $406 $240 Average/Median Selling Price (,000s)* Average Selling Price MedianSelling Price 7 15 0 4 15 3 Number of New Listings* 86% 80% 0% 75% 73% 67% Sales-to-New Listings Ratio* 23 9 5 27 Average Days on Market* 100% 101% 100% 97% Average Sale Price to List Price Ratio* Toronto C15: Pleasant View
  • 67. First Quarter 2013 Toronto Real Estate Board *The source for all slides is the Toronto Real Estate Board. Some statistics are not reported when the number of transactions is two (2) or less. Statistics are updated on a monthly basis. Quarterly community statistics in this report may not match quarterly sums calculated from past TREB publications. 66 22 3 0 3 21 1 Number of Transactions* $778 $585 $381 $347 $734 $577 $359 $334 Average/Median Selling Price (,000s)* Average Selling Price MedianSelling Price 32 6 0 14 61 1 Number of New Listings* 69% 50% 0% 21% 34% 100% Sales-to-New Listings Ratio* 16 19 23 23 Average Days on Market* 99% 102% 97% 97% Average Sale Price to List Price Ratio* Toronto C15: Don Valley Village
  • 68. First Quarter 2013 Toronto Real Estate Board *The source for all slides is the Toronto Real Estate Board. Some statistics are not reported when the number of transactions is two (2) or less. Statistics are updated on a monthly basis. Quarterly community statistics in this report may not match quarterly sums calculated from past TREB publications. 67 19 0 0 7 66 0 Number of Transactions* $1,352 $532 $355 $1,050 $488 $334 Average/Median Selling Price (,000s)* Average Selling Price MedianSelling Price 47 0 0 19 214 0 Number of New Listings* 40% 0% 0% 37% 31% 0% Sales-to-New Listings Ratio* 36 50 48 Average Days on Market* 95% 96% 97% Average Sale Price to List Price Ratio* Toronto C15: Bayview Village
  • 69. First Quarter 2013 Toronto Real Estate Board *The source for all slides is the Toronto Real Estate Board. Some statistics are not reported when the number of transactions is two (2) or less. Statistics are updated on a monthly basis. Quarterly community statistics in this report may not match quarterly sums calculated from past TREB publications. 68 3 0 0 3 18 0 Number of Transactions* $809 $334 $280 $806 $330 $272 Average/Median Selling Price (,000s)* Average Selling Price MedianSelling Price 4 0 0 3 36 0 Number of New Listings* 75% 0% 0% 100% 50% 0% Sales-to-New Listings Ratio* 8 39 21 Average Days on Market* 98% 100% 99% Average Sale Price to List Price Ratio* Toronto C15: Henry Farm