Stock Research Report for BAC as of 8/17/11 - Chaikin Power Tools
•
1 j'aime•194 vues

To order a free Chaikin Power Gauge stock research report for BAC go to http://www.chaikinpowertools.com/reports

Recommandé
Contenu connexe
En vedette
En vedette (16)
Plus de Dan Oconnor
Plus de Dan Oconnor (10)
Dernier
Dernier (20)
Stock Research Report for BAC as of 8/17/11 - Chaikin Power Tools
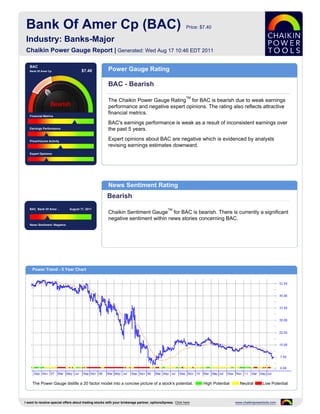
- 1. Bank Of Amer Cp (BAC) Price: $7.40 Industry: Banks-Major Chaikin Power Gauge Report | Generated: Wed Aug 17 10:46 EDT 2011 BAC Bank Of Amer Cp $7.40 Power Gauge Rating BAC - Bearish TM The Chaikin Power Gauge Rating for BAC is bearish due to weak earnings performance and negative expert opinions. The rating also reflects attractive financial metrics. Financial Metrics BAC's earnings performance is weak as a result of inconsistent earnings over Earnings Performance the past 5 years. Price/Volume Activity Expert opinions about BAC are negative which is evidenced by analysts revising earnings estimates downward. Expert Opinions News Sentiment Rating Bearish BAC Bank Of Amer .. August 17, 2011 TM Chaikin Sentiment Gauge for BAC is bearish. There is currently a significant negative sentiment within news stories concerning BAC. News Sentiment :Negative Power Trend - 5 Year Chart The Power Gauge distills a 20 factor model into a concise picture of a stock's potential. High Potential Neutral Low Potential I want to receive special offers about trading stocks with your brokerage partner, optionsXpress. Click here www.chaikinpowertools.com
- 2. Financials & Earnings Financial Metrics Financial Metrics Rating LT Debt/Equity Ratio Bullish Price to Book Value BAC's financial metrics are very good. The company may be undervalued and generates high free cash flow relative to market capitalization. Return on Equity The rank is based on a high long term debt to equity ratio, low price to book value, low return on equity, high price to sales ratio and relatively high cash flow. Price to Sales Ratio Business Value Assets and Liabilities Valuation Returns Ratio TTM Ratio TTM Ratio TTM Current Ratio 1.02 Price/Book 0.36 Return on Invest -0.4% LT Debt/Equity 2.12 Price/Sales 0.56 Return on Equity -1.4% Earnings Performance Earnings Performance Rating Earnings Growth Bearish Earnings Surprise BAC's earnings performance has been weak. The company has an erratic 5 year earnings trend and has not met analysts' earnings estimates. Earnings Trend The rank is based on worse than expected earnings in recent quarters, a relatively low projected P/E ratio and inconsistent earnings over the past 5 years. Projected P/E Ratio Earnings Consistency 5 Year Revenue and Earnings Growth EPS Estimates 12/06 12/07 12/08 12/09 12/10 Factor Actual EPS Prev EST EPS Current Change Revenue(M) 117,017.00 66,319.00 72,782.00 150,450.00 134,194.00 Quarterly EPS $-0.77 $0.23 +1.00 Rev % Growth - -43.33% 9.75% 106.71% -10.80% Yearly EPS $-0.37 $-0.23 +0.14 EPS $4.66 $3.35 $0.56 $-0.28 $-0.37 Factor Actual EPS Growth Est EPS Growth Change EPS % Growth 10.69% -28.11% -83.28% -150.00% -32.14% 3-5 year EPS 15.58% 7.80% -7.78 EPS Surprise EPS Quarterly Results Estimate Actual Difference % Difference FY Qtr 1 Qtr 2 Qtr 3 Qtr 4 Total Latest Qtr $-0.91 $-0.90 $0.01 1.10 12/09 $0.44 $0.33 $-0.26 $-0.60 $-0.09 1 Qtr Ago $0.27 $0.17 $-0.10 -37.04 12/10 $0.28 $0.28 $-0.77 $-0.16 $-0.37 2 Qtr Ago $0.19 $0.04 $-0.15 -78.95 12/11 $0.17 $-0.90 - - - 3 Qtr Ago $0.16 $0.27 $0.11 68.75 Fiscal Year End Month is December. I want to receive special offers about trading stocks with your brokerage partner, optionsXpress. Click here www.chaikinpowertools.com
- 3. Price Trend & Expert Opinions Price/Volume Activity Price/Volume Activity Rating Relative Strength vs Market Neutral Chaikin Money Flow Price and volume activity for BAC is neutral. BAC is in an accelerating price trend compared to 4 months ago and has underperformed the S&P 500 over 26 weeks. Price Trend The rank for BAC is based on its relative weakness versus the market, negative Price Trend ROC Chaikin money flow, a negative Chaikin price trend, a positive Chaikin price trend ROC and an increasing volume trend. Volume Trend Relative Strength vs S&P500 Index Chaikin Money Flow Chart shows whether BAC is performing better or worse than the market. Chaikin Money Flow analyzes supply and demand for a company's stock. Price Activity Price Activity Volume Activity Factor Value Factor Value Factor Value 52 Week High 15.25 % Change Price - 4 Weeks -22.68% Average Volume 20 Days 277,432,896 52 Week Low 6.51 % Change Price - 24 Weeks -46.88% Average Volume 90 Days 176,090,955 % Change YTD Rel S&P 500 -42.50% % Change Price - 4 Wks Rel to S&P -13.99% Chaikin Money Flow Persistency 9% % Change Price - 24 Wks Rel to S&P -41.82% Expert Opinions Expert Opinions Earnings Estimate Revisions Bearish Short Interest Expert opinions about BAC are negative. Analysts are lowering their EPS estimates for BAC and analysts's opinions on BAC have been more negative Insider Activity recently. The rank for BAC is based on analysts revising earnings estimates downward, a Analyst Opinions low short interest ratio, insiders purchasing stock, pessimistic analyst opinions and relative weakness of the stock versus the Banks-Major industry group. Relative Strength vs Industry Earnings Estimate Revisions Analyst Recommendations EPS Estimates Revision Summary Current 7 Days Ago % Change Factor Value Last Week Last 4 Weeks Current Qtr 0.23 0.23 0.00% Mean this Week Buy Up Down Up Down Next Qtr 0.27 0.28 -3.57% Mean Last Week Buy Curr Qtr 0 3 1 12 Curr Yr 0 4 0 11 Current 30 Days Ago % Change Change 0.00 Next Qtr 0 4 1 13 Current FY -0.23 -0.16 -0.07 Mean 5 Weeks Ago Buy Next Yr 0 4 0 18 I want to receive special offers about trading stocks with your brokerage partner, optionsXpress. Click here www.chaikinpowertools.com
- 4. The Company & Its Competitors BAC's Competitors in Banks-Major News Headlines for BAC Company Power Historic EPS Projected EPS Profit Margin PEG PE Revenue(M) DealBook: With Bank Failures Mounting, Some Gauge growth growth Complain of Harsh Exams - Aug 16, 2011 BAC 15.58% 7.80% -14.72% - - 134,194 DealBook: With Bank Failures Mounting, Some WFC 22.35% 8.33% 15.97% 1.05 9.52 93,249 Complain of Harsh Exams - Aug 16, 2011 Foxwoods Close to Restructuring $2 Billion USB 4.55% 6.25% 19.73% 1.53 10.87 20,518 Debt, Wall Street Journal Reports - Aug 16, BBT 7.47% 6.75% 9.05% 1.75 15.30 11,072 2011 Foxwoods Close to Restructuring $2 Billion JPM 22.29% 6.75% 19.85% 1.07 7.70 102,694 Debt, Wall Street Journal Reports - Aug 16, PNC 31.49% 6.67% 23.24% 1.15 7.35 17,096 2011 C 2.80% 7.66% 12.35% 0.95 9.10 86,601 BofA to sell one of its credit card units - Aug 16, 2011 BK 14.72% 7.00% 18.14% 1.31 9.13 13,875 Company Details Company Profile BANK OF AMER CP Bank of America Corp. is one of the world's leading financial services companies. Bank of BANK OF AMERICA CORPORATE America provides individuals, small businesses and commercial, corporate and CENTER 100 N TRYON ST institutional clients across the United States and around the world new and better ways to CHARLOTTE, NC 28255 manage their financial lives. The company enables customers to do their banking and USA investing whenever, wherever and however they choose. Phone: 7043868486 Fax: 704-386-6699 Website: http://http://www.bankofamerica.co m Full Time Employees: 288,000 Sector: Finance Power Gauge Ratings are created using a relative ranking system that assigns a rank of 0 to 100 (100 being the highest) to each stock in the universe. Rank is calculated by evaluating each of the stocks factors and combining them into a single number using a weighting formula. A stock's rank ranges from 100-0, where 100 is the strongest, and a rank of 95 indicates the stock is better than 95% of the stocks in the universe. Chaikin Stock Research(CSR) is not registered as a securities broker dealer or investment advisor with either the U.S. Securities and Exchange Commission or with any state securities regulatory authority. CSR is not responsible for trades executed by users of this research report, our web site or mobile app based on the information included herein. The information presented in this report does not represent a recommendation to buy or sell stocks or any financial instrument nor is it intended as an endorsement of any security or investment. The information in this report is generic by nature and is not personalized to the specific financial situation of any individual. The user bears complete responsibility for their own investment research and should seek the advice of a qualified investment professional before making any investment decisions. Copyright (c) 1978-(Present) by ZACKS Investment Research, Inc ("ZACKS"). The information, data, analyses and opinions contained herein (1) includes the confidential and proprietary information of ZACKS, (2) may not be copied or redistributed, for any purpose, (3) does not constitute investment advice offered by ZACKS, (4) are provided solely for informational purposes, and (5) are not warranted or represented to be correct, complete, accurate or timely. ZACKS shall not be responsible for investment decisions, damages or other losses resulting from, or related to, use of this information, data, analyses or opinions. Past performance is no guarantee of future performance. ZACKS is not affiliated with Chaikin Power Tools. This report from Chaikin Power Tools is for informational purposes only and is not a recommendation to buy or sell securities. LM 2.3 DS 3.0 LS 2.1 Data Provided by ZACKS Investment Research, Inc., www.zacks.com Special offers to trade stocks from optionsXpress: www.chaikinpowertools.com