Stock Research Report for NFLX as of 9/8/11 - Chaikin Power Tools
•
0 likes•122 views

To order a free Chaikin Power Gauge stock research report for NFLX go to http://www.chaikinpowertools.com/reports

Recommended
Recommended
More Related Content
More from Dan Oconnor
More from Dan Oconnor (7)
Recently uploaded
Recently uploaded (20)
Stock Research Report for NFLX as of 9/8/11 - Chaikin Power Tools
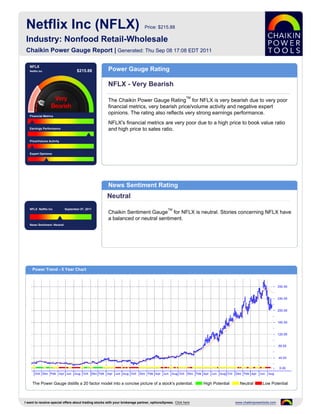
- 1. Netflix Inc (NFLX) Price: $215.88 Industry: Nonfood Retail-Wholesale Chaikin Power Gauge Report | Generated: Thu Sep 08 17:08 EDT 2011 NFLX Netflix Inc $215.88 Power Gauge Rating NFLX - Very Bearish TM The Chaikin Power Gauge Rating for NFLX is very bearish due to very poor financial metrics, very bearish price/volume activity and negative expert opinions. The rating also reflects very strong earnings performance. Financial Metrics NFLX's financial metrics are very poor due to a high price to book value ratio Earnings Performance and high price to sales ratio. Price/Volume Activity Expert Opinions News Sentiment Rating Neutral NFLX Netflix Inc September 07, 2011 TM Chaikin Sentiment Gauge for NFLX is neutral. Stories concerning NFLX have a balanced or neutral sentiment. News Sentiment :Neutral Power Trend - 5 Year Chart The Power Gauge distills a 20 factor model into a concise picture of a stock's potential. High Potential Neutral Low Potential I want to receive special offers about trading stocks with your brokerage partner, optionsXpress. Click here www.chaikinpowertools.com
- 2. Financials & Earnings Financial Metrics Financial Metrics Rating LT Debt/Equity Ratio Very Bearish Price to Book Value NFLX's financial metrics are very poor. The company may be overvalued and has relatively low revenue per share. Return on Equity The rank is based on a high price to book value ratio, high return on equity, high price to sales ratio and relatively low cash flow. Price to Sales Ratio Business Value Assets and Liabilities Valuation Returns Ratio TTM Ratio TTM Ratio TTM Current Ratio 1.33 Price/Book 33.94 Return on Invest 42.1% LT Debt/Equity 0.81 Price/Sales 5.25 Return on Equity 78.2% Earnings Performance Earnings Performance Rating Earnings Growth Very Bullish Earnings Surprise NFLX's earnings performance has been very strong. The company has a history of strong earnings growth and has a stable 5 year earnings trend. Earnings Trend The rank is based on high earnings growth over the past 3-5 years, better than expected earnings in recent quarters, an upward trend in earnings this year, a Projected P/E Ratio relatively high projected P/E ratio and consistent earnings over the past 5 years. Earnings Consistency 5 Year Revenue and Earnings Growth EPS Estimates 12/06 12/07 12/08 12/09 12/10 Factor Actual EPS Prev EST EPS Current Change Revenue(M) 996.66 786.17 1,364.66 1,670.27 2,162.62 Quarterly EPS $0.73 $1.01 +0.28 Rev % Growth 44.86% -21.12% 73.58% 22.39% 29.48% Yearly EPS $3.06 $4.64 +1.58 EPS $0.78 $1.00 $1.36 $2.05 $3.06 Factor Actual EPS Growth Est EPS Growth Change EPS % Growth 0.00% 28.21% 36.00% 50.74% 49.27% 3-5 year EPS 29.84% 31.25% +1.41 EPS Surprise EPS Quarterly Results Estimate Actual Difference % Difference FY Qtr 1 Qtr 2 Qtr 3 Qtr 4 Total Latest Qtr $1.11 $1.26 $0.15 13.51 12/09 $0.38 $0.56 $0.54 $0.58 $2.06 1 Qtr Ago $1.07 $1.11 $0.04 3.74 12/10 $0.61 $0.83 $0.73 $0.90 $3.07 2 Qtr Ago $0.71 $0.87 $0.16 22.54 12/11 $1.14 $1.30 - - - 3 Qtr Ago $0.72 $0.70 $-0.02 -2.78 Fiscal Year End Month is December. I want to receive special offers about trading stocks with your brokerage partner, optionsXpress. Click here www.chaikinpowertools.com
- 3. Price Trend & Expert Opinions Price/Volume Activity Price/Volume Activity Rating Relative Strength vs Market Very Bearish Chaikin Money Flow Price and volume activity for NFLX is very bearish. NFLX is trading on lower volume than its 90 day average volume and has a declining price trend. Price Trend The rank for NFLX is based on its price strength versus the market, positive Price Trend ROC Chaikin money flow, a negative Chaikin price trend, a negative Chaikin price trend ROC and a decreasing volume trend. Volume Trend Relative Strength vs S&P500 Index Chaikin Money Flow Chart shows whether NFLX is performing better or worse than the market. Chaikin Money Flow analyzes supply and demand for a company's stock. Price Activity Price Activity Volume Activity Factor Value Factor Value Factor Value 52 Week High 298.73 % Change Price - 4 Weeks -7.06% Average Volume 20 Days 3,811,420 52 Week Low 138.48 % Change Price - 24 Weeks -5.70% Average Volume 90 Days 4,418,324 % Change YTD Rel S&P 500 29.94% % Change Price - 4 Wks Rel to S&P -13.10% Chaikin Money Flow Persistency 79% % Change Price - 24 Wks Rel to S&P 2.08% Expert Opinions Expert Opinions Earnings Estimate Revisions Bearish Short Interest Expert opinions about NFLX are negative. Short interest in NFLX is high and insiders are not net buyers of NFLX's stock. Insider Activity The rank for NFLX is based on analysts revising earnings estimates upward, a high short interest ratio, insiders not purchasing significant amounts of stock and Analyst Opinions optimistic analyst opinions. Relative Strength vs Industry Earnings Estimate Revisions Analyst Recommendations EPS Estimates Revision Summary Current 7 Days Ago % Change Factor Value Last Week Last 4 Weeks Current Qtr 1.01 1.01 0.00% Mean this Week Hold Up Down Up Down Next Qtr 1.21 1.21 0.00% Mean Last Week Hold Curr Qtr 0 0 0 1 Curr Yr 0 0 1 1 Current 30 Days Ago % Change Change 0.00 Next Qtr 0 0 0 2 Current FY 4.64 4.67 -0.03 Mean 5 Weeks Ago Hold Next Yr 1 0 1 1 I want to receive special offers about trading stocks with your brokerage partner, optionsXpress. Click here www.chaikinpowertools.com
- 4. The Company & Its Competitors NFLX's Competitors in Nonfood Retail-Wholesale News Headlines for NFLX Company Power Historic EPS Projected EPS Profit Margin PEG PE Revenue(M) Time Warner shares rise after Barclays upgrade Gauge growth growth - Sep 7, 2011 NFLX 29.84% 31.25% 8.04% 1.49 54.82 2,163 Netflix unveils Latin America service in Brazil - OWW -3.75% 23.00% -8.47% 3.83 52.80 757 Sep 5, 2011 Netflix unveils Latin America service in Brazil - IACI -10.50% 27.00% 9.07% 1.06 43.60 1,637 Sep 5, 2011 PCLN 26.38% 22.60% 19.75% 1.11 34.58 3,085 Netflix Unveils "Just for Kids" Experience - Aug 16, 2011 AMZN 32.26% 25.67% 2.58% 4.44 98.17 34,204 Viacom fiscal 3Q earnings grow 37 percent - OSTK 6.71% 20.00% 0.30% 4.74 94.73 1,090 Aug 5, 2011 EBAY 15.61% 11.43% 17.42% 1.55 18.59 9,156 Company Details Company Profile NETFLIX INC Netflix Inc. is the largest online movie rental subscription service in the United States 100 WINCHESTER CIRCLE providing subscribers access to a comprehensive library of more than 18,000 movie, LOS GATOS, CA 95032-7606 television and other filmed entertainment titles. The standard subscription plan allows USA subscribers to have three titles out at the same time with no due dates, late fees or Phone: 408-540-3700 shipping charges for a monthly fee. Fax: 408-540-3737 Website: http://http://www.netflix.com Full Time Employees: 2,180 Sector: Retail/Wholesale Power Gauge Ratings are created using a relative ranking system that assigns a rank of 0 to 100 (100 being the highest) to each stock in the universe. Rank is calculated by evaluating each of the stocks factors and combining them into a single number using a weighting formula. A stock's rank ranges from 100-0, where 100 is the strongest, and a rank of 95 indicates the stock is better than 95% of the stocks in the universe. Chaikin Stock Research(CSR) is not registered as a securities broker dealer or investment advisor with either the U.S. Securities and Exchange Commission or with any state securities regulatory authority. CSR is not responsible for trades executed by users of this research report, our web site or mobile app based on the information included herein. The information presented in this report does not represent a recommendation to buy or sell stocks or any financial instrument nor is it intended as an endorsement of any security or investment. The information in this report is generic by nature and is not personalized to the specific financial situation of any individual. The user bears complete responsibility for their own investment research and should seek the advice of a qualified investment professional before making any investment decisions. Copyright (c) 1978-(Present) by ZACKS Investment Research, Inc ("ZACKS"). The information, data, analyses and opinions contained herein (1) includes the confidential and proprietary information of ZACKS, (2) may not be copied or redistributed, for any purpose, (3) does not constitute investment advice offered by ZACKS, (4) are provided solely for informational purposes, and (5) are not warranted or represented to be correct, complete, accurate or timely. ZACKS shall not be responsible for investment decisions, damages or other losses resulting from, or related to, use of this information, data, analyses or opinions. Past performance is no guarantee of future performance. ZACKS is not affiliated with Chaikin Power Tools. This report from Chaikin Power Tools is for informational purposes only and is not a recommendation to buy or sell securities. LM 2.3 DS 3.0 LS 2.1 Data Provided by ZACKS Investment Research, Inc., www.zacks.com Special offers to trade stocks from optionsXpress: www.chaikinpowertools.com