Stock Research Report for OPEN as of 7/8/11 - Chaikin Power Tools
•
0 likes•129 views

To order a free Chaikin Power Gauge stock research report for OPEN go to http://www.chaikinpowertools.com/reports

Recommended
Recommended
More Related Content
Recently uploaded
Recently uploaded (20)
Featured
Featured (20)
Stock Research Report for OPEN as of 7/8/11 - Chaikin Power Tools
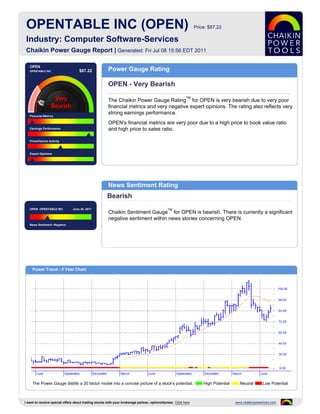
- 1. OPENTABLE INC (OPEN) Price: $87.22 Industry: Computer Software-Services Chaikin Power Gauge Report | Generated: Fri Jul 08 15:56 EDT 2011 OPEN OPENTABLE INC $87.22 Power Gauge Rating OPEN - Very Bearish TM The Chaikin Power Gauge Rating for OPEN is very bearish due to very poor financial metrics and very negative expert opinions. The rating also reflects very strong earnings performance. Financial Metrics OPEN's financial metrics are very poor due to a high price to book value ratio Earnings Performance and high price to sales ratio. Price/Volume Activity Expert Opinions News Sentiment Rating Bearish OPEN OPENTABLE INC June 30, 2011 TM Chaikin Sentiment Gauge for OPEN is bearish. There is currently a significant negative sentiment within news stories concerning OPEN. News Sentiment :Negative Power Trend - 5 Year Chart The Power Gauge distills a 20 factor model into a concise picture of a stock's potential. High Potential Neutral Low Potential I want to receive special offers about trading stocks with your brokerage partner, optionsXpress. Click here www.chaikinpowertools.com
- 2. Financials & Earnings Financial Metrics Financial Metrics Rating LT Debt/Equity Ratio Very Bearish Price to Book Value OPEN's financial metrics are very poor. The company may be overvalued and has relatively low revenue per share. Return on Equity The rank is based on a low long term debt to equity ratio, high price to book value ratio, high return on equity, high price to sales ratio and relatively low cash flow. Price to Sales Ratio Business Value Assets and Liabilities Valuation Returns Ratio TTM Ratio TTM Ratio TTM Current Ratio 2.63 Price/Book 17.86 Return on Invest 18.4% LT Debt/Equity - Price/Sales 20.73 Return on Equity 18.4% Earnings Performance Earnings Performance Rating Earnings Growth Very Bullish Earnings Surprise OPEN's earnings performance has been very strong. The company has outperformed analysts' earnings estimates and experienced superior earnings growth in the past 12 months. Earnings Trend The rank is based on better than expected earnings in recent quarters, an upward Projected P/E Ratio trend in earnings this year, a relatively high projected P/E ratio and consistent earnings over the past 5 years. Earnings Consistency 5 Year Revenue and Earnings Growth EPS Estimates 12/06 12/07 12/08 12/09 12/10 Factor Actual EPS Prev EST EPS Current Change Revenue(M) - - 55.84 68.60 98.99 Quarterly EPS $0.17 $0.23 +0.06 Rev % Growth - - - 22.84% 44.31% Yearly EPS $0.62 $0.94 +0.32 EPS - - $-0.10 $0.28 $0.62 Factor Actual EPS Growth Est EPS Growth Change EPS % Growth - - - 380.00% 121.43% 3-5 year EPS 33.57% 37.84% +4.27 EPS Surprise EPS Quarterly Results Estimate Actual Difference % Difference FY Qtr 1 Qtr 2 Qtr 3 Qtr 4 Total Latest Qtr $0.16 $0.20 $0.04 25.00 12/09 $0.03 $0.05 $0.04 $0.14 $0.26 1 Qtr Ago $0.16 $0.26 $0.10 62.50 12/10 $0.11 $0.11 $0.17 $0.22 $0.61 2 Qtr Ago $0.10 $0.19 $0.09 90.00 12/11 $0.18 - - - - 3 Qtr Ago $0.05 $0.11 $0.06 120.00 Fiscal Year End Month is December. I want to receive special offers about trading stocks with your brokerage partner, optionsXpress. Click here www.chaikinpowertools.com
- 3. Price Trend & Expert Opinions Price/Volume Activity Price/Volume Activity Rating Relative Strength vs Market Neutral Chaikin Money Flow Price and volume activity for OPEN is neutral. OPEN is experiencing sustained buying and has a declining price trend. Price Trend The rank for OPEN is based on its price strength versus the market, positive Price Trend ROC Chaikin money flow, a negative Chaikin price trend, a positive Chaikin price trend ROC and a decreasing volume trend. Volume Trend Relative Strength vs S&P500 Index Chaikin Money Flow Chart shows whether OPEN is performing better or worse than the market. Chaikin Money Flow analyzes supply and demand for a company's stock. Price Activity Price Activity Volume Activity Factor Value Factor Value Factor Value 52 Week High 115.62 % Change Price - 4 Weeks 6.39% Average Volume 20 Days 1,100,148 52 Week Low 40.84 % Change Price - 24 Weeks 14.53% Average Volume 90 Days 1,286,932 % Change YTD Rel S&P 500 9.97% % Change Price - 4 Wks Rel to S&P 1.35% Chaikin Money Flow Persistency 72% % Change Price - 24 Wks Rel to S&P 8.35% Expert Opinions Expert Opinions Earnings Estimate Revisions Very Bearish Short Interest Expert opinions about OPEN are very negative. Short interest in OPEN is high and insiders are not net buyers of OPEN's stock. Insider Activity The rank for OPEN is based on analysts revising earnings estimates upward, a high short interest ratio, insiders not purchasing significant amounts of stock, Analyst Opinions optimistic analyst opinions and relative weakness of the stock versus the Computer Software-Services industry group. Relative Strength vs Industry Earnings Estimate Revisions Analyst Recommendations EPS Estimates Revision Summary Current 7 Days Ago % Change Factor Value Last Week Last 4 Weeks Current Qtr 0.20 0.20 0.00% Mean this Week Buy Up Down Up Down Next Qtr 0.23 0.23 0.00% Mean Last Week Buy Curr Qtr 0 1 0 1 Curr Yr 0 1 0 1 Current 30 Days Ago % Change Change -0.11 Next Qtr 0 1 0 1 Current FY 0.94 0.94 0.00 Mean 5 Weeks Ago Buy Next Yr 0 1 0 1 I want to receive special offers about trading stocks with your brokerage partner, optionsXpress. Click here www.chaikinpowertools.com
- 4. The Company & Its Competitors OPEN's Competitors in Computer Software-Services News Headlines for OPEN Company Power Historic EPS Projected EPS Profit Margin PEG PE Revenue(M) No significant news stories at this time. Gauge growth growth OPEN 33.57% 37.84% 14.12% 2.45 114.71 99 TSYS 31.25% 10.50% 3.52% 1.27 14.46 389 BBBB 27.11% 20.75% 1.77% 1.46 42.53 447 ARBA 2.43% 17.50% 13.03% 8.81 137.58 361 KGJI 108.83% - 3.25% - - 523 SXCI 235.87% 20.80% 2.63% 1.90 54.38 1,948 RNWK 7.23% 10.00% -3.47% - - 402 FFIV 26.52% 23.20% 19.39% 1.78 47.82 882 Company Details Company Profile OPENTABLE INC OpenTable is the leading supplier of reservation, table management and guest 799 MARKET STREET management software for restaurants. In addition, the company operates SAN FRANCISCO, CA 94103 www.opentable.com, the world's most popular website for making restaurant reservations USA online. With customers throughout the United States, Canada, Mexico, United Kingdom, Phone: (415) 344-4200 Germany, France, Spain and Japan, the OpenTable hardware and software system Fax: 415-267-0944 replaces pen-and-paper at the host stand. It automates the process of taking reservations Website: and managing tables, while allowing restaurants to build robust diner databases for http://http://www.opentable.com superior guest recognition and targeted e-mail marketing. For diners, concierges and Sector: Computer and Technology administrative professionals, the website provides a fast, efficient way to find available tables that meet desired criteria for cuisine, price and location at a specified time. The company is headquartered in San Francisco, California. Power Gauge Ratings are created using a relative ranking system that assigns a rank of 0 to 100 (100 being the highest) to each stock in the universe. Rank is calculated by evaluating each of the stocks factors and combining them into a single number using a weighting formula. A stock's rank ranges from 100-0, where 100 is the strongest, and a rank of 95 indicates the stock is better than 95% of the stocks in the universe. Chaikin Stock Research(CSR) is not registered as a securities broker dealer or investment advisor with either the U.S. Securities and Exchange Commission or with any state securities regulatory authority. CSR is not responsible for trades executed by users of this research report, our web site or mobile app based on the information included herein. The information presented in this report does not represent a recommendation to buy or sell stocks or any financial instrument nor is it intended as an endorsement of any security or investment. The information in this report is generic by nature and is not personalized to the specific financial situation of any individual. The user bears complete responsibility for their own investment research and should seek the advice of a qualified investment professional before making any investment decisions. Copyright (c) 1978-(Present) by ZACKS Investment Research, Inc ("ZACKS"). The information, data, analyses and opinions contained herein (1) includes the confidential and proprietary information of ZACKS, (2) may not be copied or redistributed, for any purpose, (3) does not constitute investment advice offered by ZACKS, (4) are provided solely for informational purposes, and (5) are not warranted or represented to be correct, complete, accurate or timely. ZACKS shall not be responsible for investment decisions, damages or other losses resulting from, or related to, use of this information, data, analyses or opinions. Past performance is no guarantee of future performance. ZACKS is not affiliated with Chaikin Power Tools. This report from Chaikin Power Tools is for informational purposes only and is not a recommendation to buy or sell securities. LM 2.3 DS 3.0 LS 2.1 Data Provided by ZACKS Investment Research, Inc., www.zacks.com Special offers to trade stocks from optionsXpress: www.chaikinpowertools.com