SlideShare a Scribd company logo
Towers Watson (TW)                                                                         Price: $63.18

 Industry: Business Service
 Chaikin Power Gauge Report | Generated: Wed Jul 27 11:30 EDT 2011

   TW
   Towers Watson                    $63.18            Power Gauge Rating

                                                      TW - Neutral
                                                                                                         TM
                                                      The Chaikin Power Gauge Rating for TW is neutral with attractive financial
                                                      metrics, very strong earnings performance, bullish price/volume activity and
                                                      very positive expert opinions.
   Financial Metrics

                                                      TW's earnings performance is very strong as a result of high earnings growth
   Earnings Performance                               over the past 3-5 years.

   Price/Volume Activity
                                                      TW's financial metrics are very good due to a high price to book value ratio.
                                                      Despite these bullish factors, Chaikin Power Tools has identified a negative
   Expert Opinions
                                                      trend resulting in a neutral rating.


                                                      News Sentiment Rating
                                                      Neutral
   TW Towers Watson             July 21, 2011                                                TM
                                                      Chaikin Sentiment Gauge for TW is neutral. Stories concerning TW have a
                                                      balanced or neutral sentiment.
   News Sentiment :Neutral


     Power Trend - 5 Year Chart


     The Power Gauge distills a 20 factor model into a concise picture of a stock's potential.                 High Potential     Neutral       Low Potential


I want to receive special offers about trading stocks with your brokerage partner, optionsXpress. Click here                    www.chaikinpowertools.com
Financials & Earnings


    Financial Metrics
                                                              Financial Metrics Rating

    LT Debt/Equity Ratio
                                                              Bullish

    Price to Book Value                                       TW's financial metrics are very good. The company does not hold much long term
                                                              debt and generates high free cash flow relative to market capitalization.
    Return on Equity
                                                              The rank is based on a low long term debt to equity ratio and relatively high cash
                                                              flow.
    Price to Sales Ratio


    Business Value


    Assets and Liabilities                                                  Valuation                                                   Returns


    Ratio                                                TTM                Ratio                                       TTM             Ratio                                         TTM

    Current Ratio                                        1.45               Price/Book                                  1.36            Return on Invest                             12.0%

    LT Debt/Equity                                       0.00               Price/Sales                                 1.96            Return on Equity                             12.0%


    Earnings Performance
                                                              Earnings Performance Rating

    Earnings Growth
                                                              Very Bullish

    Earnings Surprise                                         TW's earnings performance has been very strong. The company has a history of
                                                              strong earnings growth and has outperformed analysts' earnings estimates.
    Earnings Trend                                            The rank is based on high earnings growth over the past 3-5 years, better than
                                                              expected earnings in recent quarters, a relatively low projected P/E ratio and
    Projected P/E Ratio                                       consistent earnings over the past 5 years.

    Earnings Consistency


   5 Year Revenue and Earnings Growth                                                                  EPS Estimates


                             06/06          06/07             06/08            06/09           06/10   Factor                       Actual EPS Prev        EST EPS Current          Change

   Revenue(M)              1,271.81       1,486.52       1,760.06          1,676.03         2,387.83   Quarterly EPS                            $0.45                 $0.96          +0.51

   Rev % Growth                   -        16.88%         18.40%             -4.77%          42.47%    Yearly EPS                               $2.04                 $4.64          +2.60

   EPS                       $2.11          $2.74             $3.65            $3.43           $2.04   Factor                  Actual EPS Growth            Est EPS Growth          Change

   EPS % Growth                   -        29.86%         33.21%             -6.03%         -40.52%    3-5 year EPS                         18.24%                   12.00%           -6.24


    EPS Surprise                                                                                       EPS Quarterly Results


                               Estimate              Actual           Difference       % Difference    FY                   Qtr 1           Qtr 2            Qtr 3        Qtr 4       Total

    Latest Qtr                    $0.94              $1.26                $0.32              34.04     06/08                $0.82           $0.93           $0.95         $0.73      $3.43

    1 Qtr Ago                     $0.84              $0.91                $0.07               8.33     06/09                $0.70           $0.57           $0.12         $0.77      $2.16

    2 Qtr Ago                     $0.90              $0.71               $-0.19              -21.11    06/10                $0.45           $0.65           $0.94             -      $2.04

    3 Qtr Ago                     $0.80              $0.69               $-0.11              -13.75    Fiscal Year End Month is June.


 I want to receive special offers about trading stocks with your brokerage partner, optionsXpress. Click here                                           www.chaikinpowertools.com
Price Trend & Expert Opinions

    Price/Volume Activity
                                                     Price/Volume Activity Rating

    Relative Strength vs Market                      Bullish

    Chaikin Money Flow
                                                     Price and volume activity for TW is bullish. TW is experiencing sustained buying
                                                     and has outperformed the S&P 500 over 26 weeks.
    Price Trend
                                                     The rank for TW is based on its price strength versus the market, positive Chaikin
    Price Trend ROC
                                                     money flow, a positive Chaikin price trend and a negative Chaikin price trend
                                                     ROC.
    Volume Trend


   Relative Strength vs S&P500 Index                                                          Chaikin Money Flow


   Chart shows whether TW is performing better or worse than the market.                       Chaikin Money Flow analyzes supply and demand for a company's stock.


    Price Activity                                               Price Activity                                           Volume Activity

    Factor                                         Value        Factor                                           Value   Factor                                           Value

    52 Week High                                   66.38        % Change Price - 4 Weeks                        0.21%    Average Volume 20 Days                         275,667

    52 Week Low                                    41.13        % Change Price - 24 Weeks                       11.16%   Average Volume 90 Days                         327,438

    % Change YTD Rel S&P 500                     13.24%         % Change Price - 4 Wks Rel to S&P               -4.57%   Chaikin Money Flow Persistency                    83%

                                                                % Change Price - 24 Wks Rel to S&P              9.40%


    Expert Opinions
                                                     Expert Opinions

    Earnings Estimate Revisions                      Very Bullish
    Short Interest                                   Expert opinions about TW are very positive. Analysts are raising their EPS
                                                     estimates for TW and shorting of TW is low.
    Insider Activity
                                                     The rank for TW is based on analysts revising earnings estimates upward, a low
                                                     short interest ratio, insiders not purchasing significant amounts of stock, optimistic
    Analyst Opinions
                                                     analyst opinions and price strength of the stock versus the Business Service
                                                     industry group.
    Relative Strength vs Industry


    Earnings Estimate Revisions                                  Analyst Recommendations                                  EPS Estimates Revision Summary

                       Current      7 Days Ago % Change         Factor                                           Value                            Last Week    Last 4 Weeks

   Current Qtr           0.90             0.90    0.00%         Mean this Week                                     Buy                         Up     Down         Up     Down

   Next Qtr              0.96             0.96    0.00%         Mean Last Week                                     Buy   Curr Qtr                 0       0         0         0

                                                                                                                         Curr Yr                  0       0         0         0
                       Current      30 Days Ago % Change        Change                                            0.00
                                                                                                                         Next Qtr                 0       0         0         0
   Current FY            3.77             3.77      0.00        Mean 5 Weeks Ago                                   Buy
                                                                                                                         Next Yr                  0       0         0         0


 I want to receive special offers about trading stocks with your brokerage partner, optionsXpress. Click here                          www.chaikinpowertools.com
The Company & Its Competitors


   TW's Competitors in Business Service                                                                            News Headlines for TW

   Company     Power   Historic EPS   Projected EPS    Profit Margin       PEG           PE    Revenue(M)           Towers Watson Launches Executive
               Gauge         growth           growth                                                                Compensation Blog - Jul 18, 2011
   TW                       18.24%          12.00%           6.61%         1.14        17.69             -          Towers Watson Introduces Updated Version of
   ACN                       6.70%          13.25%           8.12%         1.37        19.47        23,094
                                                                                                                    MoSes Financial Modeling Solutions for U.S.
                                                                                                                    Life Insurers - May 11, 2011
   CBZ                       5.61%          12.50%           3.61%         1.00        12.63          733
                                                                                                                    Towers Watson Launches New iPad Application
   FCN                      22.03%          16.25%           5.63%         0.98        17.80         1,401          - Mar 23, 2011
                                                                                                                    Managers Critical to Successful M&A, but
   NCI                       4.68%          13.50%           3.67%         1.14        17.55          704
                                                                                                                    Underleveraged, Towers Watson Study Finds -
   STN                      23.80%          12.00%           7.33%         1.10        14.05         1,190          Feb 8, 2011

   IT                        5.82%          20.67%           8.02%         1.28        32.64         1,288
                                                                                                                    Towers Watson Completes Acquisition of EMB -
                                                                                                                    Feb 1, 2011
   CLGX                    -19.80%           8.50%          -4.62%         1.79        13.24         1,623


        Company Details                                            Company Profile

        TOWERS WATSON                                              Towers Watson & Co. is a global professional services company that helps organizations
        901 N. GLEBE ROAD                                          improve performance through effective people, risk and financial management. It offers
        ARLINGTON, VA 22203                                        solutions in the areas of employee benefits, talent management, rewards, and risk and
        USA                                                        capital management. The Company's benefits solutions cover health and group benefits,
        Phone: (703) 258-8000                                      mergers and acquisitions, retirement, and technology and administration. Its risk and
        Fax: 703-258-8585                                          financial services solutions include financial modeling software, investment, reinsurance,
        Website:                                                   insurance consulting, mergers and acquisitions, and risk management. Its talent and
        http://http://www.watsonwyatt.com/                         rewards solutions cover communication and change, employee surveys, HR function
        Full Time Employees: 7,700                                 effectiveness, rewards, talent management, data services, executive compensation,
        Sector: Business Services                                  mergers and acquisitions, and sales effectiveness and compensation. Towers Watson &
                                                                   Co. was formerly known as Watson Wyatt Worldwide, Inc. and is headquartered in New
                                                                   York.


  Power Gauge Ratings are created using a relative ranking system that assigns a rank of 0 to 100 (100 being the highest) to each stock in the universe. Rank is calculated
  by evaluating each of the stocks factors and combining them into a single number using a weighting formula. A stock's rank ranges from 100-0, where 100 is the
  strongest, and a rank of 95 indicates the stock is better than 95% of the stocks in the universe.

  Chaikin Stock Research(CSR) is not registered as a securities broker dealer or investment advisor with either the U.S. Securities and Exchange Commission or with any
  state securities regulatory authority. CSR is not responsible for trades executed by users of this research report, our web site or mobile app based on the information
  included herein. The information presented in this report does not represent a recommendation to buy or sell stocks or any financial instrument nor is it intended as an
  endorsement of any security or investment. The information in this report is generic by nature and is not personalized to the specific financial situation of any individual.
  The user bears complete responsibility for their own investment research and should seek the advice of a qualified investment professional before making any investment
  decisions.

  Copyright (c) 1978-(Present) by ZACKS Investment Research, Inc ("ZACKS"). The information, data, analyses and opinions contained herein (1) includes the
  confidential and proprietary information of ZACKS, (2) may not be copied or redistributed, for any purpose, (3) does not constitute investment advice offered by
  ZACKS, (4) are provided solely for informational purposes, and (5) are not warranted or represented to be correct, complete, accurate or timely. ZACKS shall not be
  responsible for investment decisions, damages or other losses resulting from, or related to, use of this information, data, analyses or opinions. Past performance is no
  guarantee of future performance. ZACKS is not affiliated with Chaikin Power Tools.

  This report from Chaikin Power Tools is for informational purposes only and is not a recommendation to buy or sell securities.


                                                                                                                                                                     LM 2.3 DS 3.0 LS 2.1


 Data Provided by ZACKS Investment Research, Inc., www.zacks.com                     Special offers to trade stocks from optionsXpress: www.chaikinpowertools.com

More Related Content

Viewers also liked

Trabajo grupal pdi
Trabajo grupal pdiTrabajo grupal pdi
Trabajo grupal pdi
monrroe8
ย 
Tspbug 2 24_2014_final
Tspbug 2 24_2014_finalTspbug 2 24_2014_final
Tspbug 2 24_2014_final
Ed Senez
ย 
efectos del ecuador sobre la expulsion de la embajadora de ee.uu
efectos del ecuador sobre la expulsion de la embajadora de ee.uuefectos del ecuador sobre la expulsion de la embajadora de ee.uu
efectos del ecuador sobre la expulsion de la embajadora de ee.uu
kikinpm
ย 
Innovation hp final v.
Innovation hp final v.Innovation hp final v.
Innovation hp final v.
guyg68
ย 
Beagle temperament
Beagle temperamentBeagle temperament
Beagle temperament
karenturner123
ย 
Richard Motroni
Richard MotroniRichard Motroni
Richard Motroni
richmotroni
ย 
Workshop 2 - PowerPoint Presentation v10
Workshop 2 - PowerPoint Presentation v10Workshop 2 - PowerPoint Presentation v10
Workshop 2 - PowerPoint Presentation v10
E-Mediat
ย 
Presentaciรณn 2 miรฉrcoles 5 febrero
Presentaciรณn 2 miรฉrcoles 5 febreroPresentaciรณn 2 miรฉrcoles 5 febrero
Presentaciรณn 2 miรฉrcoles 5 febrero
Thara-R
ย 
C:\fakepath\super eyes!
C:\fakepath\super eyes!C:\fakepath\super eyes!
C:\fakepath\super eyes!
guest1dc7f5
ย 

Viewers also liked (12)

Trabajo grupal pdi
Trabajo grupal pdiTrabajo grupal pdi
Trabajo grupal pdi
ย 
Tspbug 2 24_2014_final
Tspbug 2 24_2014_finalTspbug 2 24_2014_final
Tspbug 2 24_2014_final
ย 
Calendario vacunacion
Calendario vacunacionCalendario vacunacion
Calendario vacunacion
ย 
efectos del ecuador sobre la expulsion de la embajadora de ee.uu
efectos del ecuador sobre la expulsion de la embajadora de ee.uuefectos del ecuador sobre la expulsion de la embajadora de ee.uu
efectos del ecuador sobre la expulsion de la embajadora de ee.uu
ย 
Innovation hp final v.
Innovation hp final v.Innovation hp final v.
Innovation hp final v.
ย 
Riesgos Internet_Charla para padres_AMPA Liceo Castilla
Riesgos Internet_Charla para padres_AMPA Liceo CastillaRiesgos Internet_Charla para padres_AMPA Liceo Castilla
Riesgos Internet_Charla para padres_AMPA Liceo Castilla
ย 
Beagle temperament
Beagle temperamentBeagle temperament
Beagle temperament
ย 
Richard Motroni
Richard MotroniRichard Motroni
Richard Motroni
ย 
Workshop 2 - PowerPoint Presentation v10
Workshop 2 - PowerPoint Presentation v10Workshop 2 - PowerPoint Presentation v10
Workshop 2 - PowerPoint Presentation v10
ย 
Presentaciรณn 2 miรฉrcoles 5 febrero
Presentaciรณn 2 miรฉrcoles 5 febreroPresentaciรณn 2 miรฉrcoles 5 febrero
Presentaciรณn 2 miรฉrcoles 5 febrero
ย 
Spandan : The Beat of Nation (Jan-Feb 2014)
Spandan : The Beat of Nation (Jan-Feb 2014)Spandan : The Beat of Nation (Jan-Feb 2014)
Spandan : The Beat of Nation (Jan-Feb 2014)
ย 
C:\fakepath\super eyes!
C:\fakepath\super eyes!C:\fakepath\super eyes!
C:\fakepath\super eyes!
ย 

More from Dan Oconnor

Stock market tips from marc chaikin
Stock market tips from marc chaikinStock market tips from marc chaikin
Stock market tips from marc chaikin
Dan Oconnor
ย 

More from Dan Oconnor (10)

How to Find Winning Stocks in 2015
How to Find Winning Stocks in 2015How to Find Winning Stocks in 2015
How to Find Winning Stocks in 2015
ย 
How Chaikin Analytics Helps You Make More Money - Stock Analysis and Tips
How Chaikin Analytics Helps You Make More Money - Stock Analysis and TipsHow Chaikin Analytics Helps You Make More Money - Stock Analysis and Tips
How Chaikin Analytics Helps You Make More Money - Stock Analysis and Tips
ย 
Investing Tips for Beginners and Experts - Invest Smarter in 5 Simple Steps
Investing Tips for Beginners and Experts - Invest Smarter in 5 Simple StepsInvesting Tips for Beginners and Experts - Invest Smarter in 5 Simple Steps
Investing Tips for Beginners and Experts - Invest Smarter in 5 Simple Steps
ย 
Combining fundamental and technical analysis to increase trading profits
Combining fundamental and technical analysis to increase trading profitsCombining fundamental and technical analysis to increase trading profits
Combining fundamental and technical analysis to increase trading profits
ย 
Combining fundamental and technical analysis to increase trading profits
Combining fundamental and technical analysis to increase trading profitsCombining fundamental and technical analysis to increase trading profits
Combining fundamental and technical analysis to increase trading profits
ย 
How to start investing and trading in 5 simple steps
How to start investing and trading in 5 simple stepsHow to start investing and trading in 5 simple steps
How to start investing and trading in 5 simple steps
ย 
Stock market tips from marc chaikin
Stock market tips from marc chaikinStock market tips from marc chaikin
Stock market tips from marc chaikin
ย 
Find Stock Ideas, Manage Stock Portfolios and Tame Big Data with Chaikin
Find Stock Ideas, Manage Stock Portfolios and Tame Big Data with ChaikinFind Stock Ideas, Manage Stock Portfolios and Tame Big Data with Chaikin
Find Stock Ideas, Manage Stock Portfolios and Tame Big Data with Chaikin
ย 
Rachel Fox: Short-Term Trading Tips and Strategies with Chaikin Analytics
Rachel Fox: Short-Term Trading Tips and Strategies with Chaikin AnalyticsRachel Fox: Short-Term Trading Tips and Strategies with Chaikin Analytics
Rachel Fox: Short-Term Trading Tips and Strategies with Chaikin Analytics
ย 

Recently uploaded

Constitution of Company Article of Association
Constitution of Company Article of AssociationConstitution of Company Article of Association
Constitution of Company Article of Association
seri bangash
ย 
Memorandum Of Association Constitution of Company.ppt
Memorandum Of Association Constitution of Company.pptMemorandum Of Association Constitution of Company.ppt
Memorandum Of Association Constitution of Company.ppt
seri bangash
ย 

Recently uploaded (20)

Unleash Data Power with EnFuse Solutions' Comprehensive Data Management Servi...
Unleash Data Power with EnFuse Solutions' Comprehensive Data Management Servi...Unleash Data Power with EnFuse Solutions' Comprehensive Data Management Servi...
Unleash Data Power with EnFuse Solutions' Comprehensive Data Management Servi...
ย 
The Truth About Dinesh Bafna's Situation.pdf
The Truth About Dinesh Bafna's Situation.pdfThe Truth About Dinesh Bafna's Situation.pdf
The Truth About Dinesh Bafna's Situation.pdf
ย 
Constitution of Company Article of Association
Constitution of Company Article of AssociationConstitution of Company Article of Association
Constitution of Company Article of Association
ย 
sales plan presentation by mckinsey alum
sales plan presentation by mckinsey alumsales plan presentation by mckinsey alum
sales plan presentation by mckinsey alum
ย 
Salesforce in Life Sciences - Best Ways to Leverage The CRM for Clinical Trials
Salesforce in Life Sciences - Best Ways to Leverage The CRM for Clinical TrialsSalesforce in Life Sciences - Best Ways to Leverage The CRM for Clinical Trials
Salesforce in Life Sciences - Best Ways to Leverage The CRM for Clinical Trials
ย 
Unveiling the Dynamic Gemini_ Personality Traits and Sign Dates.pptx
Unveiling the Dynamic Gemini_ Personality Traits and Sign Dates.pptxUnveiling the Dynamic Gemini_ Personality Traits and Sign Dates.pptx
Unveiling the Dynamic Gemini_ Personality Traits and Sign Dates.pptx
ย 
Event Report - IBM Think 2024 - It is all about AI and hybrid
Event Report - IBM Think 2024 - It is all about AI and hybridEvent Report - IBM Think 2024 - It is all about AI and hybrid
Event Report - IBM Think 2024 - It is all about AI and hybrid
ย 
Team-Spandex-Northern University-CS1035.
Team-Spandex-Northern University-CS1035.Team-Spandex-Northern University-CS1035.
Team-Spandex-Northern University-CS1035.
ย 
State of D2C in India: A Logistics Update
State of D2C in India: A Logistics UpdateState of D2C in India: A Logistics Update
State of D2C in India: A Logistics Update
ย 
LinkedIn Masterclass Techweek 2024 v4.1.pptx
LinkedIn Masterclass Techweek 2024 v4.1.pptxLinkedIn Masterclass Techweek 2024 v4.1.pptx
LinkedIn Masterclass Techweek 2024 v4.1.pptx
ย 
USA classified ads posting โ€“ best classified sites in usa.pdf
USA classified ads posting โ€“ best classified sites in usa.pdfUSA classified ads posting โ€“ best classified sites in usa.pdf
USA classified ads posting โ€“ best classified sites in usa.pdf
ย 
Creative Ideas for Interactive Team Presentations
Creative Ideas for Interactive Team PresentationsCreative Ideas for Interactive Team Presentations
Creative Ideas for Interactive Team Presentations
ย 
Falcon Invoice Discounting Setup for Small Businesses
Falcon Invoice Discounting Setup for Small BusinessesFalcon Invoice Discounting Setup for Small Businesses
Falcon Invoice Discounting Setup for Small Businesses
ย 
Understanding UAE Labour Law: Key Points for Employers and Employees
Understanding UAE Labour Law: Key Points for Employers and EmployeesUnderstanding UAE Labour Law: Key Points for Employers and Employees
Understanding UAE Labour Law: Key Points for Employers and Employees
ย 
transform-your-business-with-cutting-edge-inventory-management-and-3pl-integr...
transform-your-business-with-cutting-edge-inventory-management-and-3pl-integr...transform-your-business-with-cutting-edge-inventory-management-and-3pl-integr...
transform-your-business-with-cutting-edge-inventory-management-and-3pl-integr...
ย 
12 Conversion Rate Optimization Strategies for Ecommerce Websites.pdf
12 Conversion Rate Optimization Strategies for Ecommerce Websites.pdf12 Conversion Rate Optimization Strategies for Ecommerce Websites.pdf
12 Conversion Rate Optimization Strategies for Ecommerce Websites.pdf
ย 
Indiaโ€™s Recommended Women Surgeons to Watch in 2024.pdf
Indiaโ€™s Recommended Women Surgeons to Watch in 2024.pdfIndiaโ€™s Recommended Women Surgeons to Watch in 2024.pdf
Indiaโ€™s Recommended Women Surgeons to Watch in 2024.pdf
ย 
What Does A 3-Band Wedding Band Mean?
What Does A 3-Band Wedding Band Mean?What Does A 3-Band Wedding Band Mean?
What Does A 3-Band Wedding Band Mean?
ย 
Did Paul Haggis Ever Win an Oscar for Best Filmmaker
Did Paul Haggis Ever Win an Oscar for Best FilmmakerDid Paul Haggis Ever Win an Oscar for Best Filmmaker
Did Paul Haggis Ever Win an Oscar for Best Filmmaker
ย 
Memorandum Of Association Constitution of Company.ppt
Memorandum Of Association Constitution of Company.pptMemorandum Of Association Constitution of Company.ppt
Memorandum Of Association Constitution of Company.ppt
ย 

Stock Research Report for TW as of 7/27/11 - Chaikin Power Tools

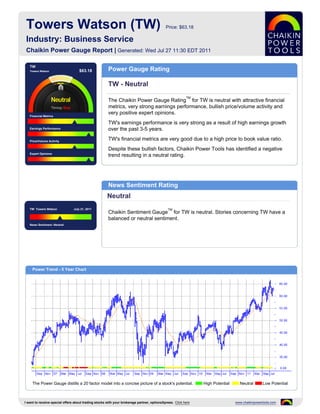
  • 1. Towers Watson (TW) Price: $63.18 Industry: Business Service Chaikin Power Gauge Report | Generated: Wed Jul 27 11:30 EDT 2011 TW Towers Watson $63.18 Power Gauge Rating TW - Neutral TM The Chaikin Power Gauge Rating for TW is neutral with attractive financial metrics, very strong earnings performance, bullish price/volume activity and very positive expert opinions. Financial Metrics TW's earnings performance is very strong as a result of high earnings growth Earnings Performance over the past 3-5 years. Price/Volume Activity TW's financial metrics are very good due to a high price to book value ratio. Despite these bullish factors, Chaikin Power Tools has identified a negative Expert Opinions trend resulting in a neutral rating. News Sentiment Rating Neutral TW Towers Watson July 21, 2011 TM Chaikin Sentiment Gauge for TW is neutral. Stories concerning TW have a balanced or neutral sentiment. News Sentiment :Neutral Power Trend - 5 Year Chart The Power Gauge distills a 20 factor model into a concise picture of a stock's potential. High Potential Neutral Low Potential I want to receive special offers about trading stocks with your brokerage partner, optionsXpress. Click here www.chaikinpowertools.com
  • 2. Financials & Earnings Financial Metrics Financial Metrics Rating LT Debt/Equity Ratio Bullish Price to Book Value TW's financial metrics are very good. The company does not hold much long term debt and generates high free cash flow relative to market capitalization. Return on Equity The rank is based on a low long term debt to equity ratio and relatively high cash flow. Price to Sales Ratio Business Value Assets and Liabilities Valuation Returns Ratio TTM Ratio TTM Ratio TTM Current Ratio 1.45 Price/Book 1.36 Return on Invest 12.0% LT Debt/Equity 0.00 Price/Sales 1.96 Return on Equity 12.0% Earnings Performance Earnings Performance Rating Earnings Growth Very Bullish Earnings Surprise TW's earnings performance has been very strong. The company has a history of strong earnings growth and has outperformed analysts' earnings estimates. Earnings Trend The rank is based on high earnings growth over the past 3-5 years, better than expected earnings in recent quarters, a relatively low projected P/E ratio and Projected P/E Ratio consistent earnings over the past 5 years. Earnings Consistency 5 Year Revenue and Earnings Growth EPS Estimates 06/06 06/07 06/08 06/09 06/10 Factor Actual EPS Prev EST EPS Current Change Revenue(M) 1,271.81 1,486.52 1,760.06 1,676.03 2,387.83 Quarterly EPS $0.45 $0.96 +0.51 Rev % Growth - 16.88% 18.40% -4.77% 42.47% Yearly EPS $2.04 $4.64 +2.60 EPS $2.11 $2.74 $3.65 $3.43 $2.04 Factor Actual EPS Growth Est EPS Growth Change EPS % Growth - 29.86% 33.21% -6.03% -40.52% 3-5 year EPS 18.24% 12.00% -6.24 EPS Surprise EPS Quarterly Results Estimate Actual Difference % Difference FY Qtr 1 Qtr 2 Qtr 3 Qtr 4 Total Latest Qtr $0.94 $1.26 $0.32 34.04 06/08 $0.82 $0.93 $0.95 $0.73 $3.43 1 Qtr Ago $0.84 $0.91 $0.07 8.33 06/09 $0.70 $0.57 $0.12 $0.77 $2.16 2 Qtr Ago $0.90 $0.71 $-0.19 -21.11 06/10 $0.45 $0.65 $0.94 - $2.04 3 Qtr Ago $0.80 $0.69 $-0.11 -13.75 Fiscal Year End Month is June. I want to receive special offers about trading stocks with your brokerage partner, optionsXpress. Click here www.chaikinpowertools.com
  • 3. Price Trend & Expert Opinions Price/Volume Activity Price/Volume Activity Rating Relative Strength vs Market Bullish Chaikin Money Flow Price and volume activity for TW is bullish. TW is experiencing sustained buying and has outperformed the S&P 500 over 26 weeks. Price Trend The rank for TW is based on its price strength versus the market, positive Chaikin Price Trend ROC money flow, a positive Chaikin price trend and a negative Chaikin price trend ROC. Volume Trend Relative Strength vs S&P500 Index Chaikin Money Flow Chart shows whether TW is performing better or worse than the market. Chaikin Money Flow analyzes supply and demand for a company's stock. Price Activity Price Activity Volume Activity Factor Value Factor Value Factor Value 52 Week High 66.38 % Change Price - 4 Weeks 0.21% Average Volume 20 Days 275,667 52 Week Low 41.13 % Change Price - 24 Weeks 11.16% Average Volume 90 Days 327,438 % Change YTD Rel S&P 500 13.24% % Change Price - 4 Wks Rel to S&P -4.57% Chaikin Money Flow Persistency 83% % Change Price - 24 Wks Rel to S&P 9.40% Expert Opinions Expert Opinions Earnings Estimate Revisions Very Bullish Short Interest Expert opinions about TW are very positive. Analysts are raising their EPS estimates for TW and shorting of TW is low. Insider Activity The rank for TW is based on analysts revising earnings estimates upward, a low short interest ratio, insiders not purchasing significant amounts of stock, optimistic Analyst Opinions analyst opinions and price strength of the stock versus the Business Service industry group. Relative Strength vs Industry Earnings Estimate Revisions Analyst Recommendations EPS Estimates Revision Summary Current 7 Days Ago % Change Factor Value Last Week Last 4 Weeks Current Qtr 0.90 0.90 0.00% Mean this Week Buy Up Down Up Down Next Qtr 0.96 0.96 0.00% Mean Last Week Buy Curr Qtr 0 0 0 0 Curr Yr 0 0 0 0 Current 30 Days Ago % Change Change 0.00 Next Qtr 0 0 0 0 Current FY 3.77 3.77 0.00 Mean 5 Weeks Ago Buy Next Yr 0 0 0 0 I want to receive special offers about trading stocks with your brokerage partner, optionsXpress. Click here www.chaikinpowertools.com
  • 4. The Company & Its Competitors TW's Competitors in Business Service News Headlines for TW Company Power Historic EPS Projected EPS Profit Margin PEG PE Revenue(M) Towers Watson Launches Executive Gauge growth growth Compensation Blog - Jul 18, 2011 TW 18.24% 12.00% 6.61% 1.14 17.69 - Towers Watson Introduces Updated Version of ACN 6.70% 13.25% 8.12% 1.37 19.47 23,094 MoSes Financial Modeling Solutions for U.S. Life Insurers - May 11, 2011 CBZ 5.61% 12.50% 3.61% 1.00 12.63 733 Towers Watson Launches New iPad Application FCN 22.03% 16.25% 5.63% 0.98 17.80 1,401 - Mar 23, 2011 Managers Critical to Successful M&A, but NCI 4.68% 13.50% 3.67% 1.14 17.55 704 Underleveraged, Towers Watson Study Finds - STN 23.80% 12.00% 7.33% 1.10 14.05 1,190 Feb 8, 2011 IT 5.82% 20.67% 8.02% 1.28 32.64 1,288 Towers Watson Completes Acquisition of EMB - Feb 1, 2011 CLGX -19.80% 8.50% -4.62% 1.79 13.24 1,623 Company Details Company Profile TOWERS WATSON Towers Watson & Co. is a global professional services company that helps organizations 901 N. GLEBE ROAD improve performance through effective people, risk and financial management. It offers ARLINGTON, VA 22203 solutions in the areas of employee benefits, talent management, rewards, and risk and USA capital management. The Company's benefits solutions cover health and group benefits, Phone: (703) 258-8000 mergers and acquisitions, retirement, and technology and administration. Its risk and Fax: 703-258-8585 financial services solutions include financial modeling software, investment, reinsurance, Website: insurance consulting, mergers and acquisitions, and risk management. Its talent and http://http://www.watsonwyatt.com/ rewards solutions cover communication and change, employee surveys, HR function Full Time Employees: 7,700 effectiveness, rewards, talent management, data services, executive compensation, Sector: Business Services mergers and acquisitions, and sales effectiveness and compensation. Towers Watson & Co. was formerly known as Watson Wyatt Worldwide, Inc. and is headquartered in New York. Power Gauge Ratings are created using a relative ranking system that assigns a rank of 0 to 100 (100 being the highest) to each stock in the universe. Rank is calculated by evaluating each of the stocks factors and combining them into a single number using a weighting formula. A stock's rank ranges from 100-0, where 100 is the strongest, and a rank of 95 indicates the stock is better than 95% of the stocks in the universe. Chaikin Stock Research(CSR) is not registered as a securities broker dealer or investment advisor with either the U.S. Securities and Exchange Commission or with any state securities regulatory authority. CSR is not responsible for trades executed by users of this research report, our web site or mobile app based on the information included herein. The information presented in this report does not represent a recommendation to buy or sell stocks or any financial instrument nor is it intended as an endorsement of any security or investment. The information in this report is generic by nature and is not personalized to the specific financial situation of any individual. The user bears complete responsibility for their own investment research and should seek the advice of a qualified investment professional before making any investment decisions. Copyright (c) 1978-(Present) by ZACKS Investment Research, Inc ("ZACKS"). The information, data, analyses and opinions contained herein (1) includes the confidential and proprietary information of ZACKS, (2) may not be copied or redistributed, for any purpose, (3) does not constitute investment advice offered by ZACKS, (4) are provided solely for informational purposes, and (5) are not warranted or represented to be correct, complete, accurate or timely. ZACKS shall not be responsible for investment decisions, damages or other losses resulting from, or related to, use of this information, data, analyses or opinions. Past performance is no guarantee of future performance. ZACKS is not affiliated with Chaikin Power Tools. This report from Chaikin Power Tools is for informational purposes only and is not a recommendation to buy or sell securities. LM 2.3 DS 3.0 LS 2.1 Data Provided by ZACKS Investment Research, Inc., www.zacks.com Special offers to trade stocks from optionsXpress: www.chaikinpowertools.com