SlideShare une entreprise Scribd logo
1  sur  30
Télécharger pour lire hors ligne
A. L. Wagner Appraisal Group Presents
                                            The Chicagoland Monthly Housing Market Pulse
                                            Detached Properties - January 1, 2010 Report
                                     The monthly analysis of inventory levels by price range

  Sponsored by:
  Alvin "Chip" Wagner III, SRA, SCRP
  A. L. Wagner Appraisal Group, Inc.                                                 Specializing in Relocation, Litigation & Lending Appraisals
  1807 Washington Street, Suite 110, Naperville, IL 60565                            Serving the Chicagoland Area since 1970
  (630) 416-6556 ~ www.wagnerappraisal.com ~ chip@rac.net                            Offices in Naperville, Plainfield, Chicago, Flossmoor


                                    as of November 1, 2009                    as of December 1, 2009                      as of January 1, 2010
                                # Actives    DOM       Months Supply     # Actives      DOM       Months Supply     # Actives    DOM         Months Supply
  Addison - 101
  $         0 $ 299,999           112         220           6.62            110         221           6.23            104         229           5.97
  $ 300,000 $ 499,999             62          250           28.62           57          248           24.43           50          264           22.22
  $ 500,000 $ 999,999             23          328           30.67           23          334           34.50           20          349           26.67
  $ 1,000,000 $ 1,999,999          1          478           12.00            1          508           12.00            1          539           12.00
  $ 2,000,000 and up               0           0            0.00             0           0             0.00            0           0             0.00
            ALL                   198         243           9.94            191         244           9.20            175         255           8.54

  Algonquin - 102
  $         0 $ 299,999           94          170           6.23            91          184           5.97            94          192            6.10
  $ 300,000 $ 499,999             117         263          22.65            102         274          19.74            96          286           20.95
  $ 500,000 $ 999,999             13          284          39.00            14          256          42.00            12          309           36.00
  $ 1,000,000 $ 1,999,999          1          562         No Sales           1          592         No Sales           1          623          No Sales
  $ 2,000,000 and up               0           0            0.00             0           0            0.00             0           0             0.00
            ALL                   225         227          10.93            208         235          10.02            203         246            9.98

  Arlington Heights - 5
  $         0 $ 299,999           59          256           4.92            59          269           5.02            60          279            4.93
  $ 300,000 $ 499,999             170         201           8.64            154         183           7.60            139         200            6.84
  $ 500,000 $ 999,999             107         263          21.76            89          265          18.74            78          280           15.10
  $ 1,000,000 $ 1,999,999         15          470          90.00            16          470          96.00            15          517           90.00
  $ 2,000,000 and up               1          101         No Sales           1          131         No Sales           1          162          No Sales
            ALL                   352         240           9.58            319         236           8.64            293         254            7.74


Data Source: MRED LLC                               (C) Copyright 2010, A.L. Wagner Appraisal Group, Inc.
Midwest Real Estate Data, LLC                            (630) 416-6556 www.WagnerAppraisal.com                                                         Page 1
as of November 1, 2009                  as of December 1, 2009                     as of January 1, 2010
                                # Actives   DOM      Months Supply     # Actives     DOM       Months Supply   # Actives    DOM     Months Supply
  Aurora - 507
  $         0 $ 299,999           789       189           7.88            763        200            7.52         740         198        7.18
  $ 300,000 $ 499,999             110       222           8.46            86         249            6.62         69          263        5.31
  $ 500,000 $ 999,999             22        237          20.31            18         270           18.00         16          306       17.45
  $ 1,000,000 $ 1,999,999          2        292          24.00             1         166           12.00          1          197       12.00
  $ 2,000,000 and up               1        173         No Sales           1         203          No Sales        1          234      No Sales
            ALL                   924       194           8.09            869        207            7.52         827         205        7.06

  Barrington Area - 10
  $         0 $ 299,999           37        226           6.94            34         199            5.51          33         187        5.28
  $ 300,000 $ 499,999             106       228          10.60            97         261            9.86         92          267        9.28
  $ 500,000 $ 999,999             278       266          24.17            253        274           20.94         235         300       19.05
  $ 1,000,000 $ 1,999,999         117       328          45.29            122        336           47.23         113         363       42.38
  $ 2,000,000 and up              69        425          207.00           65         436           260.00        64          443       153.60
            ALL                   607       287          20.40            571        299           18.47         537         318       17.00

  Bannockburn - 7115
  $         0 $ 299,999            0         0            0.00            0           0             0.00           0          0         0.00
  $ 300,000 $ 499,999              0         0            0.00            0           0             0.00           0          0         0.00
  $ 500,000 $ 999,999              6        174          72.00            4          193           48.00          4          224       48.00
  $ 1,000,000 $ 1,999,999          7        214          84.00            8          260           96.00          7          245       84.00
  $ 2,000,000 and up               5        473         No Sales          7          550          No Sales        4          520      No Sales
            ALL                    18       273          108.00           19         353           114.00         15         312       90.00

  Bartlett - 104
  $         0 $ 299,999           69        207           4.65            75         226            5.33         78          221        5.74
  $ 300,000 $ 499,999             96        173          11.18            84         189           10.08         83          199       10.83
  $ 500,000 $ 999,999             27        287          54.00            27         295           81.00         27          321       81.00
  $ 1,000,000 $ 1,999,999          1        278         No Sales           1         308          No Sales        1          339      No Sales
  $ 2,000,000 and up               0         0            0.00             0          0             0.00          0           0         0.00
             ALL                  193       202           8.07            187        220            8.22         189         226        8.76

  Batavia - 510
  $         0 $ 299,999           85        195           8.72            83         196            8.51         80          212        7.80
  $ 300,000 $ 499,999             69        218          16.24            54         237           11.37         46          256        9.05
  $ 500,000 $ 999,999             34        274          16.32            31         294           15.50         32          308       16.00
  $ 1,000,000 $ 1,999,999          7        200         No Sales           8         205          No Sales        8          236      No Sales
  $ 2,000,000 and up               0         0            0.00             0          0             0.00          0           0         0.00
            ALL                   195       217          12.12            176        226           10.67         166         244        9.58


Data Source: MRED LLC                             (C) Copyright 2010, A.L. Wagner Appraisal Group, Inc.
Midwest Real Estate Data, LLC                          (630) 416-6556 www.WagnerAppraisal.com                                                   Page 2
as of November 1, 2009                  as of December 1, 2009                     as of January 1, 2010
                                # Actives   DOM      Months Supply     # Actives     DOM       Months Supply   # Actives    DOM     Months Supply
  Bensenville - 106
  $         0 $ 299,999           88        230           8.12            84         220           7.75          83          235        7.32
  $ 300,000 $ 499,999             39        371           78.00           38         382           57.00         31          427        41.33
  $ 500,000 $ 999,999              6        131           72.00            5         90            30.00          5          121        30.00
  $ 1,000,000 $ 1,999,999          0         0            0.00             0          0             0.00          0           0          0.00
  $ 2,000,000 and up               0         0            0.00             0          0             0.00          0           0          0.00
            ALL                   133       267           11.65           127        263           10.89         119         281        9.71

  Bloomingdale - 108
  $         0 $ 299,999            20       190           4.53            16         198           3.31           17         213        3.71
  $ 300,000 $ 499,999              45       184           11.02           47         178           11.75          43         223       10.98
  $ 500,000 $ 999,999              29       298           24.86           28         267           30.55          26         273       34.67
  $ 1,000,000 $ 1,999,999          5        546           60.00           4          656           48.00          4          687      No Sales
  $ 2,000,000 and up               0         0            0.00            0           0             0.00           0          0         0.00
            ALL                    99       237           10.15           95         228           9.66           90         256        9.73

  Bolingbrook - 440
  $         0 $ 299,999           253       191           5.40            246        193           5.19          242         190        5.17
  $ 300,000 $ 499,999             104       208           21.89           93         224           18.60         84          238        17.38
  $ 500,000 $ 999,999             12        301           72.00           11         305           66.00         12          301        48.00
  $ 1,000,000 $ 1,999,999          0         0            0.00             0          0             0.00          0           0          0.00
  $ 2,000,000 and up               0         0            0.00             0          0             0.00          0           0          0.00
            ALL                   369       199           7.13            350        205           6.66          338         206        6.51

  Buffalo Grove - 89
  $         0 $ 299,999           37        248           4.19            40         236            4.40         36          242        4.04
  $ 300,000 $ 499,999             74        223           9.55            63         207            7.88         56          222        6.86
  $ 500,000 $ 999,999             42        178          10.50            37         203            9.25         32          251        8.53
  $ 1,000,000 $ 1,999,999          1        202         No Sales           1         232          No Sales        0           0         0.00
  $ 2,000,000 and up               0         0            0.00             0          0             0.00          0           0         0.00
            ALL                   154       216           7.48            141        214            6.69         124         235        5.95

  Burr Ridge - 522
  $         0 $ 499,999           34        229          14.07            35         219           15.00         28          221        10.84
  $ 500,000 $ 999,999             54        297          15.07            49         333           15.89         46          329        14.15
  $ 1,000,000 $ 1,999,999         66        309          37.71            50         326           30.00         49          351        29.40
  $ 2,000,000 $ 2,999,999         22        343          264.00           18         400           108.00        17          428        68.00
  $ 3,000,000 and up              11        376           66.00            9         456           108.00         6          332        24.00
            ALL                   187       299          23.38            161        320           21.95         146         327        18.25


Data Source: MRED LLC                             (C) Copyright 2010, A.L. Wagner Appraisal Group, Inc.
Midwest Real Estate Data, LLC                          (630) 416-6556 www.WagnerAppraisal.com                                                   Page 3
as of November 1, 2009                  as of December 1, 2009                     as of January 1, 2010
                                # Actives   DOM      Months Supply     # Actives     DOM       Months Supply   # Actives    DOM     Months Supply
  Carol Stream - 188
  $         0 $ 299,999           87        186           8.16            82         194            8.00         79          191        7.77
  $ 300,000 $ 499,999             33        216           12.38           35         216           13.13         32          247       12.80
  $ 500,000 $ 999,999              5        268           60.00            5         298          No Sales        5          329      No Sales
  $ 1,000,000 $ 1,999,999          0         0            0.00             0          0             0.00          0           0         0.00
  $ 2,000,000 and up               0         0            0.00             0          0             0.00          0           0         0.00
            ALL                   125       197           9.32            122        204            9.45         116         213        9.16

  Carpentersville,Lake Marion - 110
  $         0 $ 299,999    229      222                   8.81            229        222            8.89         222         222        8.59
  $ 300,000 $ 499,999      31       264                  26.57            25         249           21.43         26          239       34.67
  $ 500,000 $ 999,999       3       671                 No Sales           3         702          No Sales        2          294      No Sales
  $ 1,000,000 $ 1,999,999   0        0                    0.00             0          0             0.00          0           0         0.00
  $ 2,000,000 and up        0        0                    0.00             0          0             0.00          0           0         0.00
            ALL            263      232                   9.68            257        230            9.55         250         224        9.40

  Cary, Oakwood Hills - 13
  $         0 $ 299,999           102       209           7.85            89         200           6.76          86          206        6.88
  $ 300,000 $ 499,999             73        262           24.33           59         298           20.82         51          305        17.00
  $ 500,000 $ 999,999             27        293           81.00           22         356           66.00         20          396        48.00
  $ 1,000,000 $ 1,999,999          2        67            24.00            2         97            24.00          2          128        24.00
  $ 2,000,000 and up               0         0            0.00             0          0             0.00          0           0          0.00
            ALL                   204       238           12.43           172        252           10.48         159         261        9.94

  Channahon - 410
  $         0 $ 299,999            63       232           7.64            57         250            6.91          68         252        8.59
  $ 300,000 $ 499,999              23       313          25.09            23         314           25.09          24         344       36.00
  $ 500,000 $ 999,999              2        416         No Sales          2          440          No Sales        2          471      No Sales
  $ 1,000,000 $ 1,999,999          0         0            0.00            0           0             0.00           0          0         0.00
  $ 2,000,000 and up               1        579         No Sales          1          609          No Sales        1          640      No Sales
            ALL                    89       261           9.71            83         277            9.05          95         284       11.07

  Clarendon Hills - 514
  $         0 $ 299,999            9        390           4.32            9          334            4.50          7          417        3.23
  $ 300,000 $ 499,999              29       231          14.50            29         248           16.57          25         248       13.04
  $ 500,000 $ 999,999              20       237           7.27            20         274            7.27          15         233        5.29
  $ 1,000,000 $ 1,999,999          25       266          25.00            19         253           22.80          17         293       20.40
  $ 2,000,000 and up                2        99         No Sales           2         129          No Sales         1         213      No Sales
            ALL                    85       256          10.85            79         263           10.77          65         274        8.39


Data Source: MRED LLC                             (C) Copyright 2010, A.L. Wagner Appraisal Group, Inc.
Midwest Real Estate Data, LLC                          (630) 416-6556 www.WagnerAppraisal.com                                                   Page 4
as of November 1, 2009                    as of December 1, 2009                     as of January 1, 2010
                                # Actives   DOM        Months Supply     # Actives     DOM       Months Supply   # Actives    DOM     Months Supply
  Countryside - 527
  $         0 $ 299,999            8        150             8.00            7          222           8.40           7          239        7.64
  $ 300,000 $ 499,999              17       335             51.00           15         391           45.00          14         441        42.00
  $ 500,000 $ 999,999              8        392             19.20           6          523           18.00          2          664        6.00
  $ 1,000,000 $ 1,999,999          0         0              0.00            0           0             0.00           0          0          0.00
  $ 2,000,000 and up               0         0              0.00            0           0             0.00           0          0          0.00
            ALL                    33       304             18.86           28         377           18.67          23         399        14.53

  Crystal Lake, Lakewood         - 14
  $         0 $ 299,999            240      219             7.74            228        223           7.18          215         235        6.40
  $ 300,000 $ 499,999              160      282             14.77           137        311           11.91         133         316       11.48
  $ 500,000 $ 999,999              75       272             39.13           68         284           34.00         63          335       39.79
  $ 1,000,000 $ 1,999,999          11       305             66.00           14         250           84.00         14          281       168.00
  $ 2,000,000 and up                0        0              0.00             0          0             0.00          0           0         0.00
            ALL                    486      250             11.07           447        260           9.84          425         277        9.07

  Darien - 562
  $         0 $ 299,999            31       277             6.41            27         265           5.68           20         312        4.29
  $ 300,000 $ 499,999              42       195             11.45           34         199           9.49           28         235        8.00
  $ 500,000 $ 999,999              24       182             28.80           22         215           29.33          20         229        24.00
  $ 1,000,000 $ 1,999,999          0         0              0.00            0           0             0.00           0          0          0.00
  $ 2,000,000 and up               0         0              0.00            0           0             0.00           0          0          0.00
            ALL                    97       218             10.39           83         225           9.14           68         256        7.56

  Deerfield - 15
  $         0 $ 299,999            7         469            3.36             7         427            3.11          7          458        3.11
  $ 300,000 $ 499,999             46         252            9.86            41         256            8.95         36          227        8.15
  $ 500,000 $ 999,999             67         243           12.56            68         246           13.38         58          255       10.71
  $ 1,000,000 $ 1,999,999         17         482           17.00            18         533           21.60         16          523       21.33
  $ 2,000,000 and up               1        1,431         No Sales           2        1,246         No Sales        2         1,270     No Sales
            ALL                   138        295           10.55            136        311           10.67         119         312        9.27

  Des Plaines - 16
  $         0 $ 299,999           192       226             6.92            183        235            6.48         175         236        6.33
  $ 300,000 $ 499,999             98        235            21.78            84         222           20.16         70          246       16.80
  $ 500,000 $ 999,999             31        316            23.25            30         338           24.00         27          339       23.14
  $ 1,000,000 $ 1,999,999          1        349           No Sales           3         138          No Sales        3          169      No Sales
  $ 2,000,000 and up               3         98           No Sales           3         128          No Sales        3          159      No Sales
            ALL                   325       236             9.68            303        240            9.00         278         247        8.42


Data Source: MRED LLC                               (C) Copyright 2010, A.L. Wagner Appraisal Group, Inc.
Midwest Real Estate Data, LLC                            (630) 416-6556 www.WagnerAppraisal.com                                                   Page 5
as of November 1, 2009                  as of December 1, 2009                  as of January 1, 2010
                                # Actives   DOM      Months Supply     # Actives     DOM       Months Supply   # Actives   DOM   Months Supply
  Downers Grove - 515
  $         0 $ 299,999           102       252           7.51            88         290            6.40         85        313       5.96
  $ 300,000 $ 499,999             110       222           9.57            102        224            8.74         101       232       8.78
  $ 500,000 $ 999,999             110       343          19.13            90         359           15.00         80        377      14.55
  $ 1,000,000 $ 1,999,999         19        377          32.57            19         410           32.57         18        451      36.00
  $ 2,000,000 and up               3        229         No Sales           2         304          No Sales        3        284     No Sales
            ALL                   344       278          10.95            301        296            9.41         287       311       9.04

  East & West Dundee,Sleepy Hollow - 118
  $         0 $ 299,999   45      201                     7.83            43         193            7.37         45        222       7.71
  $ 300,000 $ 499,999     59      279                    18.15            50         325           13.95         45        317      13.17
  $ 500,000 $ 999,999     15      380                    180.00           12         383          No Sales       12        414     No Sales
  $ 1,000,000 $ 1,999,999  1      898                   No Sales           1         928          No Sales        1        959     No Sales
  $ 2,000,000 and up       0       0                      0.00             0          0             0.00          0         0        0.00
            ALL           120     268                    13.21            106        284           11.26         103       293      11.14

  Elburn - 119
  $         0 $ 299,999           42        296          11.20            39         318            9.96         39        346       9.55
  $ 300,000 $ 499,999             61        342          22.18            53         317           17.67         49        325      16.33
  $ 500,000 $ 999,999             23        388          27.60            21         372           28.00         19        420      28.50
  $ 1,000,000 $ 1,999,999          4        253         No Sales           5         266          No Sales        4        323     No Sales
  $ 2,000,000 and up               2        70          No Sales           2         100          No Sales        2        131     No Sales
            ALL                   132       329          18.00            120        321           15.65         113       344      14.58

  Elgin - 123
  $         0 $ 299,999           607       240           9.19            561        248            8.51         533       254       7.84
  $ 300,000 $ 499,999             176       392          26.40            164        387           24.00         153       409      22.12
  $ 500,000 $ 999,999             74        392          88.80            68         433           90.67         67        432      89.33
  $ 1,000,000 $ 1,999,999          6        288         No Sales           3         245          No Sales        3        276     No Sales
  $ 2,000,000 and up               0         0            0.00             0          0             0.00          0         0        0.00
            ALL                   863       284          11.73            796        293           10.83         756       301       9.99

  Elk Grove Village - 7
  $         0 $ 299,999           70        241           8.32            66         233           7.62          71        239       8.35
  $ 300,000 $ 499,999             53        240           12.72           47         239           12.00         41        272       10.70
  $ 500,000 $ 999,999             10        260           40.00            9         309           36.00          9        325       36.00
  $ 1,000,000 $ 1,999,999          0         0            0.00             0          0             0.00          0         0         0.00
  $ 2,000,000 and up               0         0             0.00            0          0             0.00          0         0         0.00
            ALL                   133       242           10.36           122        241           9.51          121       257       9.62


Data Source: MRED LLC                             (C) Copyright 2010, A.L. Wagner Appraisal Group, Inc.
Midwest Real Estate Data, LLC                          (630) 416-6556 www.WagnerAppraisal.com                                                Page 6
as of November 1, 2009                  as of December 1, 2009                  as of January 1, 2010
                                # Actives   DOM      Months Supply     # Actives     DOM       Months Supply   # Actives   DOM   Months Supply
  Elmhurst - 126
  $         0 $ 299,999           80        171           6.04            69         171            5.11         61        208       4.55
  $ 300,000 $ 499,999             93        187           8.72            84         201            8.40         75        185       7.44
  $ 500,000 $ 999,999             99        313          12.00            90         324           11.02         80        357      10.21
  $ 1,000,000 $ 1,999,999         35        316          26.25            32         342           22.59         25        413      16.67
  $ 2,000,000 and up               2        27          No Sales           2         57           No Sales        2        88      No Sales
            ALL                   309       237           9.22            277        249            8.37         243       270       7.40

  Elmwood Park - 635
  $         0 $ 299,999           79        213           6.32            84         216            6.46         73        221       5.73
  $ 300,000 $ 499,999             44        308          22.96            41         291           21.39         35        323      19.09
  $ 500,000 $ 999,999              8        289         No Sales           5         279          No Sales        5        310     No Sales
  $ 1,000,000 $ 1,999,999          0         0            0.00             0          0             0.00          0         0        0.00
  $ 2,000,000 and up               0         0            0.00             0          0             0.00          0         0        0.00
            ALL                   131       250           9.09            130        242            8.72         113       257       7.75

  Evanston - 201
  $         0 $ 299,999           45        305           5.09            47         293            5.48         42        285       4.54
  $ 300,000 $ 499,999             67        153           6.70            61         172            6.20         51        199       5.19
  $ 500,000 $ 999,999             94        194           9.98            82         224            8.63         75        249       7.96
  $ 1,000,000 $ 1,999,999         19        297           9.50            20         278           12.00         20        347       12.63
  $ 2,000,000 and up              12        351          144.00           11         392           132.00        10        434       60.00
            ALL                   237       219           7.81            221        238            7.45         198       263       6.55

  Flossmoor - 422
  $         0 $ 299,999           75        261           8.41            66         283            7.62         61        304       6.91
  $ 300,000 $ 499,999             30        277          15.65            29         260           19.33         29        285      19.33
  $ 500,000 $ 999,999             27        371          46.29            23         387           46.00         20        291      40.00
  $ 1,000,000 $ 1,999,999          2        192         No Sales           2         222          No Sales        2        253     No Sales
  $ 2,000,000 and up               0         0            0.00             0          0             0.00          0         0        0.00
            ALL                   134       286          11.74            120        296           11.25         112       296      10.34

  Frankfort,Green Garden - 423
  $         0 $ 299,999     63              190           8.49            59         185            7.78         53        204       6.56
  $ 300,000 $ 499,999      133              251           13.19           128        250           13.02         113       241      10.94
  $ 500,000 $ 999,999       77              318           30.80           66         315           22.63         58        350      20.47
  $ 1,000,000 $ 1,999,999   6               498           72.00            5         462           60.00          6        577     No Sales
  $ 2,000,000 and up        0                0            0.00             1          9           No Sales        1         40     No Sales
            ALL            279              261           13.89           259        255           12.69         231       268      10.87


Data Source: MRED LLC                             (C) Copyright 2010, A.L. Wagner Appraisal Group, Inc.
Midwest Real Estate Data, LLC                          (630) 416-6556 www.WagnerAppraisal.com                                                Page 7
as of November 1, 2009                  as of December 1, 2009                     as of January 1, 2010
                                # Actives   DOM      Months Supply     # Actives     DOM       Months Supply   # Actives    DOM     Months Supply
  Franklin Park - 131
  $         0 $ 299,999           113       204           7.84            107        211            7.55         109         207        7.35
  $ 300,000 $ 499,999             12        238          144.00            9         265           108.00        10          223       120.00
  $ 500,000 $ 999,999              0         0            0.00             0          0             0.00          0           0         0.00
  $ 1,000,000 $ 1,999,999          0         0            0.00             0          0             0.00          0           0         0.00
  $ 2,000,000 and up               0         0            0.00             0          0             0.00          0           0         0.00
            ALL                   125       207           8.62            116        215            8.14         119         208        7.98

  Geneva - 134
  $         0 $ 299,999           55        190           5.89            50         169           5.41          47          200        5.22
  $ 300,000 $ 499,999             100       217           8.16            101        213           8.36          89          212        7.27
  $ 500,000 $ 999,999             32        257           12.00           30         252           12.41         35          226        14.48
  $ 1,000,000 $ 1,999,999          7        480           84.00            8         470           96.00          8          434        48.00
  $ 2,000,000 and up               0         0            0.00             0          0             0.00          0           0          0.00
            ALL                   194       226           7.95            189        218           7.90          179         221        7.48

  Glen Ellyn - 137
  $         0 $ 299,999           51        210           5.51            59         188            6.16         53          231        5.39
  $ 300,000 $ 499,999             87        225           9.24            76         218            8.29         67          251        7.73
  $ 500,000 $ 999,999             91        307          15.83            81         337           13.89         76          358       13.41
  $ 1,000,000 $ 1,999,999         32        537          54.86            28         585           42.00         23          627       30.67
  $ 2,000,000 and up               6        365         No Sales           6         395          No Sales        6          426      No Sales
            ALL                   267       291          10.68            250        295            9.90         225         326        9.03

  Glencoe - 22
  $         0 $ 499,999            9        230           7.20            8          194           6.40           6          236        4.24
  $ 500,000 $ 999,999             35        186           8.24            36         185           8.64           31         194        7.02
  $ 1,000,000 $ 1,999,999         36        287           11.68           33         299           9.90           38         306        13.03
  $ 2,000,000 $ 2,999,999          7        366           7.64            5          257           5.00           4          283        4.80
  $ 3,000,000 and up              17        367           51.00           17         368           40.80          17         341        34.00
            ALL                   104       266           10.58           99         259           9.74           96         271        9.52

  Glendale Heights - 139
  $         0 $ 299,999           125       231           6.91            119        246            6.46         107         237        5.66
  $ 300,000 $ 499,999              8        217          24.00             8         204           19.20          6          251       14.40
  $ 500,000 $ 999,999              1        173         No Sales           1         202          No Sales        1          233      No Sales
  $ 1,000,000 $ 1,999,999          0         0            0.00             0          0             0.00          0           0         0.00
  $ 2,000,000 and up               0         0            0.00             0          0             0.00          0           0         0.00
            ALL                   134       229           7.28            128        243            6.80         114         238        5.90


Data Source: MRED LLC                             (C) Copyright 2010, A.L. Wagner Appraisal Group, Inc.
Midwest Real Estate Data, LLC                          (630) 416-6556 www.WagnerAppraisal.com                                                   Page 8
as of November 1, 2009                  as of December 1, 2009                  as of January 1, 2010
                                # Actives   DOM      Months Supply     # Actives     DOM       Months Supply   # Actives   DOM   Months Supply
  Glenview,Golf - 25
  $         0 $ 299,999           31        275           5.24            27         241           4.38           28       249        4.67
  $ 300,000 $ 499,999             117       231           11.70           102        267           10.37         90        292       9.15
  $ 500,000 $ 999,999             168       233           14.30           153        248           13.11         137       270       11.50
  $ 1,000,000 $ 1,999,999         89        291           31.41           78         297           27.53         69        310       23.00
  $ 2,000,000 and up              10        342           60.00            9         352           54.00          5        485       30.00
            ALL                   415       251           13.53           369        266           12.03         329       286       10.64

  Grayslake,Hainesville - 30
  $         0 $ 299,999     188             203           8.58            175        204           8.08          174       215       8.06
  $ 300,000 $ 499,999       104             231           29.02           90         254           29.19         75        270       23.68
  $ 500,000 $ 999,999        21             226           42.00           16         268           64.00         10        314       40.00
  $ 1,000,000 $ 1,999,999    0               0            0.00             0          0             0.00          0         0         0.00
  $ 2,000,000 and up         0               0            0.00             0          0             0.00          0         0         0.00
            ALL             313             214           12.04           281        224           11.24         259       235       10.36

  Gurnee - 31
  $         0 $ 299,999           110       211           7.42            108        209           7.24          97        207       6.40
  $ 300,000 $ 499,999             87        246           11.47           91         281           13.16         82        274       12.00
  $ 500,000 $ 999,999             41        224           32.80           36         254           30.86         38        273       38.00
  $ 1,000,000 $ 1,999,999          1        548           12.00            1         578           12.00          1        609       12.00
  $ 2,000,000 and up               0         0            0.00             0          0             0.00          0         0         0.00
            ALL                   239       227           10.06           236        245           10.22         218       245       9.44

  Hanover Park - 103
  $         0 $ 299,999           128       211           6.95            114        208            6.11         117       211       6.59
  $ 300,000 $ 499,999              1        223         No Sales           0          0             0.00          0         0        0.00
  $ 500,000 $ 999,999              1        388         No Sales           1         418          No Sales        1        449     No Sales
  $ 1,000,000 $ 1,999,999          0         0            0.00             0          0             0.00          0         0        0.00
  $ 2,000,000 and up               0         0            0.00             0          0             0.00          0         0        0.00
            ALL                   130       212           7.06            115        210            6.16         118       213       6.65

  Highland Park - 35
  $         0 $ 299,999           21        229           5.36            20         247            5.00          18       269       4.41
  $ 300,000 $ 499,999             92        185          16.48            81         202           13.50         78        212      13.18
  $ 500,000 $ 999,999             151       251          18.49            135        244           16.36         114       270      14.55
  $ 1,000,000 $ 1,999,999          72       415          25.41             68        423           25.50          61       454      22.18
  $ 2,000,000 and up               36       366          144.00            34        400           204.00         29       423      174.00
            ALL                   372       276          17.93            338        286           16.03         300       307      14.46


Data Source: MRED LLC                             (C) Copyright 2010, A.L. Wagner Appraisal Group, Inc.
Midwest Real Estate Data, LLC                          (630) 416-6556 www.WagnerAppraisal.com                                                Page 9
as of November 1, 2009                    as of December 1, 2009                     as of January 1, 2010
                                # Actives   DOM        Months Supply     # Actives     DOM       Months Supply   # Actives    DOM     Months Supply
  Hinsdale - 521
  $         0 $ 499,999           46        293             6.65            42         311           6.00          48          317        7.29
  $ 500,000 $ 999,999             89        235             12.71           71         250           9.79          61          218        8.41
  $ 1,000,000 $ 1,999,999         94        311             16.35           75         310           13.24         72          315        12.52
  $ 2,000,000 $ 2,999,999         33        157             28.29           29         208           26.77         29          239        29.00
  $ 3,000,000 and up              21        369             31.50           13         346           26.00         11          332        16.50
            ALL                   283       270             13.16           230        281           10.70         221         279        10.40

  Hoffman Estates - 194
  $         0 $ 299,999           76        213             5.36            79         197            5.75         82          195        6.11
  $ 300,000 $ 499,999             90        226            10.69            70         238            8.16         69          258        8.28
  $ 500,000 $ 999,999             23        226            46.00            14         243           33.60         13          194       26.00
  $ 1,000,000 $ 1,999,999          1        95            No Sales           1         125          No Sales        1          156      No Sales
  $ 2,000,000 and up               0         0              0.00             0          0             0.00          0           0         0.00
            ALL                   190       220             8.23            164        218            7.21         165         221        7.42

  Homer Glen - 500
  $         0 $ 299,999           32         229            5.82            30         233            5.90         34          215        6.80
  $ 300,000 $ 499,999             109        266           19.82            100        283           17.39         91          315        15.17
  $ 500,000 $ 999,999             53         319           48.92            44         341           44.00         39          285        39.00
  $ 1,000,000 $ 1,999,999         13         413           156.00           10         422           120.00         8          400        96.00
  $ 2,000,000 and up               1        1,261         No Sales           0          0             0.00          0           0          0.00
            ALL                   208        288           17.10            184        296           15.44         172         293        14.23

  Homewood - 430
  $         0 $ 299,999           125       179             7.28            105        176            6.03          96         192        5.67
  $ 300,000 $ 499,999              5        299             8.57             4         316            8.00          3          333        7.20
  $ 500,000 $ 999,999              0         0              0.00             0          0             0.00           0          0         0.00
  $ 1,000,000 $ 1,999,999          0         0              0.00             0          0             0.00           0          0         0.00
  $ 2,000,000 and up               0         0              0.00             0          0             0.00           0          0         0.00
            ALL                   130       183             7.32            109        181            6.08          99         196        5.71

  Indian Head Park - 531
   $         0 $ 299,999           1        160           No Sales          0           0            0.00           0           0         0.00
   $ 300,000 $ 499,999             7        253            28.00            4          186           16.00          5          177        20.00
   $ 500,000 $ 999,999             6        169            72.00            7          173           84.00          7          201        84.00
   $ 1,000,000 $ 1,999,999         0         0              0.00            0           0            0.00           0           0          0.00
   $ 2,000,000 and up              0         0              0.00            0           0             0.00           0          0          0.00
             ALL                   14       210            42.00            11         178           26.40          12         191        28.80


Data Source: MRED LLC                               (C) Copyright 2010, A.L. Wagner Appraisal Group, Inc.
Midwest Real Estate Data, LLC                            (630) 416-6556 www.WagnerAppraisal.com                                                   Page 10
as of November 1, 2009                  as of December 1, 2009                     as of January 1, 2010
                                # Actives   DOM      Months Supply     # Actives     DOM       Months Supply   # Actives    DOM     Months Supply
  Inverness - 7167
   $         0 $ 299,999           2        377         No Sales           1         726           12.00          1          757       12.00
   $ 300,000 $ 499,999            19        365          17.54            18         432           16.62          14         366       11.20
   $ 500,000 $ 999,999            59        326          24.41            56         320           24.89          50         331       22.22
   $ 1,000,000 $ 1,999,999        22        280          66.00            19         262           38.00          18         239       36.00
   $ 2,000,000 and up              8        599         No Sales           7         641          No Sales        7          672      No Sales
             ALL                  110       344          28.70            101        355           25.79          90         349       22.04

  Itasca - 143
   $         0 $ 299,999           21       209           8.13            20         224           7.50           16         274        5.33
   $ 300,000 $ 499,999             22       271           33.00           14         304           15.27          15         304        16.36
   $ 500,000 $ 999,999             20       562           40.00           17         653           29.14          17         683        29.14
   $ 1,000,000 $ 1,999,999         2        113           24.00           2          95            24.00          2          128        24.00
   $ 2,000,000 and up              0         0            0.00            0           0             0.00           0          0          0.00
             ALL                   65       335           16.96           53         378           12.47          50         416        10.91

  Joliet - 499
  $         0 $ 299,999           677       187           8.75            637        187            8.11         606         196        7.99
  $ 300,000 $ 499,999             20        242          24.00            20         260           21.82         17          282       25.50
  $ 500,000 $ 999,999              9        326         No Sales           8         292          No Sales        7          402      No Sales
  $ 1,000,000 $ 1,999,999          0         0            0.00             0          0             0.00          0           0         0.00
  $ 2,000,000 and up               0         0            0.00             0          0             0.00          0           0         0.00
             ALL                  706       191           9.03            665        191            8.36         630         201        8.24

  Kenilworth - 43
  $         0 $ 299,999            0         0            0.00            0           0             0.00           0          0          0.00
  $ 300,000 $ 499,999              1        157           4.00            1          187           4.00           0           0          0.00
  $ 500,000 $ 999,999              14       231           28.00           8          209           16.00          6          236        10.29
  $ 1,000,000 $ 1,999,999          15       344           22.50           12         320           16.00          9          363        9.82
  $ 2,000,000 and up               24       382           36.00           18         384           36.00          16         411        24.00
            ALL                    54       328           25.92           39         324           19.50          31         363        12.40

  LaGrange - 525
  $         0 $ 299,999           26        275           8.00            22         270           6.14           22         269        5.74
  $ 300,000 $ 499,999             27        164           5.68            21         170           4.06           16         196        3.20
  $ 500,000 $ 999,999             56        211           14.30           50         232           12.77          42         283        9.88
  $ 1,000,000 $ 1,999,999          3        693           18.00           3          723           36.00          2          634        24.00
  $ 2,000,000 and up               0         0             0.00            0          0             0.00           0          0          0.00
            ALL                   112       227            9.27           96         243            7.53          82         271         6.23


Data Source: MRED LLC                             (C) Copyright 2010, A.L. Wagner Appraisal Group, Inc.
Midwest Real Estate Data, LLC                          (630) 416-6556 www.WagnerAppraisal.com                                                   Page 11
as of November 1, 2009                  as of December 1, 2009                     as of January 1, 2010
                                # Actives   DOM      Months Supply     # Actives     DOM       Months Supply   # Actives    DOM     Months Supply
  LaGrange Highlands - 528
  $         0 $ 299,999    5                228           8.57            4          226            6.00          4          315        6.86
  $ 300,000 $ 499,999      9                89           13.50            8          129           13.71          7          171        14.00
  $ 500,000 $ 999,999      3                73          No Sales          3          103          No Sales        3          110        36.00
  $ 1,000,000 $ 1,999,999  0                 0            0.00            0           0             0.00           0          0          0.00
  $ 2,000,000 and up       0                 0            0.00            0           0             0.00           0          0          0.00
            ALL            17               127          13.60            15         150           12.00          14         199        12.00

  LaGrange Park - 526
  $         0 $ 299,999            21       234           5.04            16         290            3.56          16         280        3.84
  $ 300,000 $ 499,999              30       191           9.00            27         249            9.00          23         293        8.36
  $ 500,000 $ 999,999              11       286           10.15           10         317            9.23          8          369        7.38
  $ 1,000,000 $ 1,999,999          0         0            0.00            0           0             0.00          0           0         0.00
  $ 2,000,000 and up               0         0            0.00            0           0             0.00          0           0         0.00
            ALL                    62       222           7.22            53         274            6.17          47         302        5.88

  Lake Bluff - 44
  $         0 $ 299,999            6        98           14.40             6         103           10.29           7         103       12.00
  $ 300,000 $ 499,999             29        253          11.60            25         274           10.71          24         260        9.29
  $ 500,000 $ 999,999             44        328          24.00            40         314           20.87          36         360       18.78
  $ 1,000,000 $ 1,999,999         24        197          24.00            22         216           20.31          20         244       17.14
  $ 2,000,000 and up               8        608         No Sales           9         573          No Sales        9          604      No Sales
            ALL                   111       288          19.30            102        294           17.24          96         315       15.36

  Lake Forest - 45
  $         0 $ 499,999           32        168           11.64           35         181           12.35         34          229        11.33
  $ 500,000 $ 999,999             116       238           17.62           97         268           14.55         86          293        12.90
  $ 1,000,000 $ 1,999,999         106       321           30.29           97         352           24.25         89          374        23.73
  $ 2,000,000 $ 2,999,999         39        263           58.50           34         290           40.80         30          311        36.00
  $ 3,000,000 and up              53        424           48.92           50         444           60.00         47          482        56.40
            ALL                   346       288           23.73           313        315           20.64         286         344        18.96

  Lake Villa, Lindenhurst - 46
  $         0 $ 299,999      151            224           8.05            143        217            7.94         136         228        7.42
  $ 300,000 $ 499,999        68             252          10.88            64         247           11.13         62          263       10.78
  $ 500,000 $ 999,999        17             312          102.00           13         410           78.00         11          477       66.00
  $ 1,000,000 $ 1,999,999     2              43         No Sales           2          73          No Sales        1           65      No Sales
  $ 2,000,000 and up          0              0            0.00             0          0             0.00          0            0        0.00
            ALL              238            237           9.46            222        236            9.28         210         250        8.66


Data Source: MRED LLC                             (C) Copyright 2010, A.L. Wagner Appraisal Group, Inc.
Midwest Real Estate Data, LLC                          (630) 416-6556 www.WagnerAppraisal.com                                                   Page 12
as of November 1, 2009                  as of December 1, 2009                     as of January 1, 2010
                                # Actives   DOM      Months Supply     # Actives     DOM       Months Supply   # Actives    DOM     Months Supply
  Lemont - 439
  $         0 $ 299,999           29        178           6.69            32         172            8.00         33          225        8.61
  $ 300,000 $ 499,999             53        264          10.26            52         254           10.95         53          269       12.00
  $ 500,000 $ 999,999             78        324          28.36            74         280           27.75         69          285       25.09
  $ 1,000,000 $ 1,999,999         17        261          204.00           15         280           180.00        13          342       156.00
  $ 2,000,000 and up               0         0            0.00             0          0             0.00          0           0         0.00
            ALL                   177       276          14.35            173        252           15.04         168         273       15.16

  Libertyville, Green Oaks - 48
  $         0 $ 299,999      35             195          10.77            33         221           10.70         31          252        9.30
  $ 300,000 $ 499,999        71             214           7.75            58         214            6.11         55          243        6.00
  $ 500,000 $ 999,999        133            320          21.28            106        297           16.31         98          306       15.08
  $ 1,000,000 $ 1,999,999    36             342          108.00           31         399           74.40         27          435       81.00
  $ 2,000,000 and up          3             431         No Sales           3         461          No Sales        3          492      No Sales
            ALL              278            281          14.63            231        281           11.85         214         301       11.07

  Lincolnshire - 69
  $         0 $ 299,999            1        214           2.00            2          152            4.00          1           91        1.71
  $ 300,000 $ 499,999              18       211           9.82            19         225            9.50          20         243       10.00
  $ 500,000 $ 999,999              45       161          16.36            39         184           13.37          39         196       13.37
  $ 1,000,000 $ 1,999,999          20       326          120.00           18         303           72.00          17         297       68.00
  $ 2,000,000 and up               1        560         No Sales          1          590          No Sales        1          621      No Sales
            ALL                    85       216          16.19            79         225           13.94          78         234       13.57

  Lincolnwood - 645
  $         0 $ 299,999            9        287           2.77            11         279            3.22          11         247        3.00
  $ 300,000 $ 499,999             38        177           8.77            34         226            8.00          33         233        7.92
  $ 500,000 $ 999,999             44        193          22.96            45         209           27.00          41         228       23.43
  $ 1,000,000 $ 1,999,999         15        470          45.00            15         405           60.00          12         377       36.00
  $ 2,000,000 and up               2        193         No Sales           2         223          No Sales        2          254      No Sales
            ALL                   108       234          10.98            107        249           11.17          99         250        9.98

  Lisle - 532
  $         0 $ 299,999           34        188           9.07            29         223           7.25           26         239        6.64
  $ 300,000 $ 499,999             46        255           9.20            37         273           7.28           36         289        7.08
  $ 500,000 $ 999,999             19        304           22.80           19         385           22.80          18         379        19.64
  $ 1,000,000 $ 1,999,999          7        289           42.00           7          318           42.00          7          349        42.00
  $ 2,000,000 and up               0         0             0.00            0          0             0.00           0          0          0.00
            ALL                   106       245           10.87           92         284            9.12          87         298         8.63


Data Source: MRED LLC                             (C) Copyright 2010, A.L. Wagner Appraisal Group, Inc.
Midwest Real Estate Data, LLC                          (630) 416-6556 www.WagnerAppraisal.com                                                   Page 13
as of November 1, 2009                  as of December 1, 2009                     as of January 1, 2010
                                # Actives   DOM      Months Supply     # Actives     DOM       Months Supply   # Actives    DOM     Months Supply
  Lockport,Homer Township - 495
  $         0 $ 299,999   181               246          11.68            161        263           10.44         151         260        9.79
  $ 300,000 $ 499,999     80                232          24.62            71         206           20.29         71          208       23.03
  $ 500,000 $ 999,999      5                247          20.00             5         277           30.00          6          262       36.00
  $ 1,000,000 $ 1,999,999  1                106         No Sales           1         136          No Sales        1          167      No Sales
  $ 2,000,000 and up       1                941         No Sales           1         971          No Sales        1         1,002     No Sales
            ALL           268               244          14.11            239        249           12.52         230         247       12.32

  Lombard - 148
  $         0 $ 299,999           131       201           6.29            124        215           6.00          112         210        5.44
  $ 300,000 $ 499,999             60        188           13.85           54         184           14.09         49          212        13.07
  $ 500,000 $ 999,999             33        393           24.75           31         428           26.57         26          432        22.29
  $ 1,000,000 $ 1,999,999          0         0            0.00             0          0             0.00          0           0          0.00
  $ 2,000,000 and up               0         0            0.00             0          0             0.00          0           0          0.00
            ALL                   224       226           8.45            209        238           8.14          187         242        7.33

  Long Grove,Lake Zurich,Hawthorn           Woods,Kildeer - 47
  $         0 $ 299,999   75                206        8.57               76         209            8.37          71         242        7.47
  $ 300,000 $ 499,999     118               240       10.04               116        256           10.24         98          287        8.40
  $ 500,000 $ 999,999     218               284       22.55               196        292           20.28         169         308       17.48
  $ 1,000,000 $ 1,999,999 68                386       35.48               61         388           34.86         53          376       37.41
  $ 2,000,000 and up      10                485      No Sales              8         494          No Sales        8          525      No Sales
            ALL           489               279       15.24               457        285           14.36         399         304       12.37

  Medinah - 157
  $         0 $ 299,999            9        285           9.82            6          158           5.14           9          248        8.31
  $ 300,000 $ 499,999              19       215           22.80           15         246           20.00          13         267        19.50
  $ 500,000 $ 999,999              8        197           24.00           8          210           24.00          9          260        54.00
  $ 1,000,000 $ 1,999,999          0         0            0.00            0           0             0.00           0          0          0.00
  $ 2,000,000 and up               0         0            0.00            0           0             0.00           0          0          0.00
            ALL                    36       228           17.28           29         218           12.89          31         259        16.17

  Minooka - 447
  $         0 $ 299,999           80        199          10.43            81         207           10.34          75         222        9.57
  $ 300,000 $ 499,999             28        603          48.00            26         655           44.57          9          247       15.43
  $ 500,000 $ 999,999              4        369         No Sales           4         399          No Sales        3          193      No Sales
  $ 1,000,000 $ 1,999,999          3        378         No Sales           3         408          No Sales        1          256      No Sales
  $ 2,000,000 and up               0         0            0.00             1         162          No Sales         1         193      No Sales
            ALL                   115       308          13.94            115        320           13.66          89         224       10.57


Data Source: MRED LLC                             (C) Copyright 2010, A.L. Wagner Appraisal Group, Inc.
Midwest Real Estate Data, LLC                          (630) 416-6556 www.WagnerAppraisal.com                                                   Page 14
as of November 1, 2009                  as of December 1, 2009                  as of January 1, 2010
                                # Actives   DOM      Months Supply     # Actives     DOM       Months Supply   # Actives   DOM   Months Supply
  Mokena - 448
  $         0 $ 299,999           31        191           6.10            35         163            6.89         31        185       6.00
  $ 300,000 $ 499,999             50        177          12.24            54         206           13.22         57        209      14.25
  $ 500,000 $ 999,999             44        329          29.33            37         331           26.12         34        363      31.38
  $ 1,000,000 $ 1,999,999          1        736          12.00             1         766           12.00          1        797      12.00
  $ 2,000,000 and up               1        194         No Sales           1         224          No Sales        1        255     No Sales
            ALL                   127       238          11.81            128        235           12.00         124       250      12.00

  Montgomery - 538
  $         0 $ 299,999           171       182           6.62            163        199            6.15         144       204       5.47
  $ 300,000 $ 499,999              8        190           96.00            6         261          No Sales        5        308     No Sales
  $ 500,000 $ 999,999              0         0            0.00             0          0             0.00          0         0        0.00
  $ 1,000,000 $ 1,999,999          0         0            0.00             0          0             0.00          0         0        0.00
  $ 2,000,000 and up               0         0            0.00             0          0             0.00          0         0        0.00
            ALL                   179       182           6.91            169        201            6.38         149       207       5.66

  Morton Grove - 53
  $         0 $ 299,999           49        218           5.11            41         230           4.17          37        213       3.61
  $ 300,000 $ 499,999             63        214           13.26           59         200           13.88         55        196       12.94
  $ 500,000 $ 999,999             30        268           32.73           22         276           22.00         20        300       18.46
  $ 1,000,000 $ 1,999,999          0         0            0.00             0          0             0.00          0         0         0.00
  $ 2,000,000 and up               0         0            0.00             0          0             0.00          0         0         0.00
            ALL                   142       227           9.31            122        224           8.09          112       220       7.19

  Mount Prospect - 56
  $         0 $ 299,999           65        230           4.59            56         236            3.93         63        231       4.40
  $ 300,000 $ 499,999             137       195          12.27            130        212           12.28         115       232      10.95
  $ 500,000 $ 999,999             16        307          13.71            12         332           11.08         11        384      11.00
  $ 1,000,000 $ 1,999,999          2        345         No Sales           2         375          No Sales        1        184     No Sales
  $ 2,000,000 and up               1        19          No Sales           1         49           No Sales        1         80     No Sales
            ALL                   221       214           8.34            201        227            7.76         191       240       7.39

  Mundelein - 60
  $         0 $ 299,999           145       205           8.37            126        212            7.17         122       237       7.04
  $ 300,000 $ 499,999             76        213          17.21            63         246           13.26         56        280      12.00
  $ 500,000 $ 999,999             33        343          20.84            30         348           20.00         27        347      18.00
  $ 1,000,000 $ 1,999,999          9        429          108.00           10         377           120.00        10        408      120.00
  $ 2,000,000 and up               1         21         No Sales           1          51          No Sales        1         82     No Sales
            ALL                   264       231          11.27            230        246            9.62         216       269       9.16


Data Source: MRED LLC                             (C) Copyright 2010, A.L. Wagner Appraisal Group, Inc.
Midwest Real Estate Data, LLC                          (630) 416-6556 www.WagnerAppraisal.com                                                Page 15
as of November 1, 2009                  as of December 1, 2009                     as of January 1, 2010
                                # Actives   DOM      Months Supply     # Actives     DOM       Months Supply   # Actives    DOM     Months Supply
  Naperville - 540
  $         0 $ 299,999           112       204           4.87            104        205            4.33         101         220        4.19
  $ 300,000 $ 499,999             328       191           6.22            285        214            5.46         242         243        4.73
  $ 500,000 $ 999,999             292       258          12.79            239        268           10.62         230         284       10.53
  $ 1,000,000 $ 1,999,999         114       492          33.37            98         494           24.00         81          552       20.25
  $ 2,000,000 and up              22        505          264.00           20         482           240.00        19          513       228.00
            ALL                   868       263           8.50            746        274            7.25         673         298        6.65

  New Lenox - 451
  $         0 $ 299,999           95        203           9.12            91         230            8.81         73          239        6.79
  $ 300,000 $ 499,999             81        253          14.29            70         280           12.35         66          298       11.48
  $ 500,000 $ 999,999             25        279          300.00           21         300           252.00        20          321       240.00
  $ 1,000,000 $ 1,999,999          1        132          12.00             1         162           12.00          1          193      No Sales
  $ 2,000,000 and up               2        233          24.00             2         263           24.00          2          294       24.00
            ALL                   204       232          12.49            185        257           11.38         162         273        9.72

  Niles - 648
  $         0 $ 299,999           45        244           5.00            39         261           4.22          37          283        4.00
  $ 300,000 $ 499,999             68        230           17.00           58         221           14.20         44          228        11.00
  $ 500,000 $ 999,999             22        313           16.50           24         316           19.20         20          357        16.00
  $ 1,000,000 $ 1,999,999          0         0            0.00             0          0             0.00          0           0          0.00
  $ 2,000,000 and up               0         0            0.00             0          0             0.00          0           0          0.00
            ALL                   135       248           9.36            121        253           8.25          101         274        6.93

  North Aurora - 542
  $         0 $ 299,999           77        199           10.38           69         191            8.63          65         192        8.21
  $ 300,000 $ 499,999             44        288           17.03           40         253           18.46          30         271       12.41
  $ 500,000 $ 999,999              0         0            0.00             2         104          No Sales        3          388      No Sales
  $ 1,000,000 $ 1,999,999          0         0            0.00             0          0             0.00           0          0         0.00
  $ 2,000,000 and up               0         0            0.00             0          0             0.00           0          0         0.00
            ALL                   121       231           12.10           111        212           10.92          98         222        9.48

  Northbrook - 62
  $         0 $ 299,999           33        290           8.61            36         278           8.64          32          324        6.98
  $ 300,000 $ 499,999             75        266           8.65            77         278           9.24          77          285        9.53
  $ 500,000 $ 999,999             121       242           11.52           104        266           9.98          81          316        7.53
  $ 1,000,000 $ 1,999,999         42        302           21.00           38         322           20.73         32          332        17.45
  $ 2,000,000 and up               13       323           52.00            14        321           56.00         13          367        52.00
            ALL                   284       267           11.25           269        282           10.76         235         312        9.22


Data Source: MRED LLC                             (C) Copyright 2010, A.L. Wagner Appraisal Group, Inc.
Midwest Real Estate Data, LLC                          (630) 416-6556 www.WagnerAppraisal.com                                                   Page 16
as of November 1, 2009                  as of December 1, 2009                     as of January 1, 2010
                                # Actives   DOM      Months Supply     # Actives     DOM       Months Supply   # Actives    DOM     Months Supply
  Northfield - 7193
  $         0 $ 299,999            5        243           30.00           4          274           24.00          3          359        18.00
  $ 300,000 $ 499,999              15       346           15.00           16         343           17.45          17         353        15.69
  $ 500,000 $ 999,999              36       322           28.80           29         346           17.40          23         370        14.53
  $ 1,000,000 $ 1,999,999          13       237           17.33           10         247           13.33          9          294        12.00
  $ 2,000,000 and up               5        203           20.00           4          175           16.00          5          171        30.00
            ALL                    74       298           21.66           63         314           16.80          57         335        15.20

  Northlake - 164
  $         0 $ 299,999            64       218           7.60            64         208           7.53           59         207        6.62
  $ 300,000 $ 499,999              5        465           20.00           5          495           30.00          4          459        16.00
  $ 500,000 $ 999,999              0         0            0.00            0           0            0.00           0           0          0.00
  $ 1,000,000 $ 1,999,999          0         0            0.00            0           0            0.00           0           0          0.00
  $ 2,000,000 and up               0         0            0.00            0           0            0.00           0           0          0.00
            ALL                    69       236           7.96            69         229           7.96           63         223        6.87

  Oak Brook - 523
  $         0 $ 499,999            2        134           8.00             2         164           6.00            1         106         2.40
  $ 500,000 $ 999,999             45        228           24.55           45         272           27.00          36         257        18.00
  $ 1,000,000 $ 1,999,999         36        260           22.74           32         251           20.21          32         220        20.21
  $ 2,000,000 $ 2,999,999         23        509           69.00           18         551           54.00          16         511        64.00
  $ 3,000,000 and up              14        404           84.00           11         463           44.00          11         494        44.00
            ALL                   120       310           28.80           108        330           25.92          96         313        21.33

  Oak Brook Terrace - 181
  $         0 $ 299,999   5                 244          10.00            5          274           10.00          6          255       12.00
  $ 300,000 $ 499,999     0                  0            0.00            0           0             0.00           0          0         0.00
  $ 500,000 $ 999,999     4                 278          48.00            4          308           48.00          3          214       36.00
  $ 1,000,000 $ 1,999,999 1                 26          No Sales          1          56           No Sales        1          87       No Sales
  $ 2,000,000 and up      0                  0            0.00            0           0             0.00           0          0         0.00
            ALL           10                236          12.00            10         266           12.00          10         226       12.00

  Oak Lawn - 453
  $         0 $ 299,999           174       208           6.42            156        203            5.71         140         215        4.96
  $ 300,000 $ 499,999             57        268          31.09            42         286           22.91         42          268       25.20
  $ 500,000 $ 999,999              5        262         No Sales           5         292          No Sales        2          190      No Sales
  $ 1,000,000 $ 1,999,999          0         0            0.00             0          0             0.00          0           0         0.00
  $ 2,000,000 and up               0         0            0.00             0          0             0.00          0           0         0.00
            ALL                   236       224           8.16            203        222            6.96         184         227        6.15


Data Source: MRED LLC                             (C) Copyright 2010, A.L. Wagner Appraisal Group, Inc.
Midwest Real Estate Data, LLC                          (630) 416-6556 www.WagnerAppraisal.com                                                   Page 17
as of November 1, 2009                  as of December 1, 2009                     as of January 1, 2010
                                # Actives   DOM      Months Supply     # Actives     DOM       Months Supply   # Actives    DOM     Months Supply
  Oak Park - 302
  $         0 $ 299,999           30        217           3.71            26         225            2.97         31          190        3.65
  $ 300,000 $ 499,999             92        182           6.20            80         188            5.25         61          221        4.00
  $ 500,000 $ 999,999             59        186           8.23            54         195            8.10         40          162        6.23
  $ 1,000,000 $ 1,999,999          9        150          27.00             6         204           18.00          6          235       18.00
  $ 2,000,000 and up               1        257         No Sales           1         287          No Sales        1          318      No Sales
            ALL                   191       188           6.28            167        197            5.39         139         198        4.56

  Olympia Fields - 461
  $         0 $ 299,999            34       195           6.38            32         252            6.10          32         264        6.40
  $ 300,000 $ 499,999              23       417          34.50            25         415           50.00          24         456       72.00
  $ 500,000 $ 999,999              4        400         No Sales          4          430          No Sales        4          461      No Sales
  $ 1,000,000 $ 1,999,999          0         0            0.00            0           0             0.00           0          0         0.00
  $ 2,000,000 and up               0         0            0.00            0           0             0.00           0          0         0.00
            ALL                    61       292          10.17            61         330           10.61          60         354       11.25

  Orland Park - 462
  $         0 $ 299,999           60        220           4.24            62         224            4.43         51          243        3.52
  $ 300,000 $ 499,999             105       191           11.56           88         207           10.06         76          233        9.12
  $ 500,000 $ 999,999             74        291           19.30           66         294           18.42         59          294       17.27
  $ 1,000,000 $ 1,999,999         11        319           33.00            6         365           18.00          5          256       12.00
  $ 2,000,000 and up               3        65            36.00            4         130          No Sales        4          161      No Sales
            ALL                   253       231           9.20            226        240            8.48         195         253        7.31

  Oswego - 543
  $         0 $ 299,999           141       284           6.11            138        294            5.94         117         326        4.89
  $ 300,000 $ 499,999             75        304          12.00            64         308           10.24         57          305        9.37
  $ 500,000 $ 999,999             15        371          90.00            13         384           156.00        12          433       144.00
  $ 1,000,000 $ 1,999,999          4        288          48.00             4         161           24.00          4          192       24.00
  $ 2,000,000 and up               1        123         No Sales           1         153          No Sales        1          184      No Sales
            ALL                   236       295           7.98            220        301            7.39         191         323        6.31

  Palatine - 67
  $         0 $ 299,999           69        219           5.83            63         229           5.01          69          248         5.52
  $ 300,000 $ 499,999             101       226           10.82           91         238           9.84          82          219        8.41
  $ 500,000 $ 999,999             113       277           19.10           109        296           18.17         92          330        15.12
  $ 1,000,000 $ 1,999,999          3        218           36.00            3         248           36.00          3          279        36.00
  $ 2,000,000 and up               0         0             0.00            0          0             0.00          0           0          0.00
            ALL                   286       244           10.53           266        260            9.53         246         269         8.66


Data Source: MRED LLC                             (C) Copyright 2010, A.L. Wagner Appraisal Group, Inc.
Midwest Real Estate Data, LLC                          (630) 416-6556 www.WagnerAppraisal.com                                                   Page 18
as of November 1, 2009                  as of December 1, 2009                     as of January 1, 2010
                                # Actives   DOM      Months Supply     # Actives     DOM       Months Supply   # Actives    DOM     Months Supply
  Palos Heights - 463
  $         0 $ 299,999            31       220           8.65            28         232            8.00          22         247        6.29
  $ 300,000 $ 499,999              29       122          16.57            29         145           16.57          22         188        13.20
  $ 500,000 $ 999,999              23       263          34.50            17         308           22.67          13         239        19.50
  $ 1,000,000 $ 1,999,999          4        219         No Sales          3          169          No Sales        0           0         0.00
  $ 2,000,000 and up               0         0            0.00            0           0             0.00           0          0          0.00
            ALL                    87       198          14.50            77         213           12.83          57         222        9.77

  Palos Hills - 465
  $         0 $ 299,999            30       220           6.55            28         192            6.72          23         245        5.31
  $ 300,000 $ 499,999              13       219          14.18            11         255           12.00          10         232        10.91
  $ 500,000 $ 999,999              2        251         No Sales          2          281          No Sales        0           0         0.00
  $ 1,000,000 $ 1,999,999          0         0            0.00            0           0             0.00           0          0          0.00
  $ 2,000,000 and up               0         0            0.00            0           0             0.00           0          0          0.00
            ALL                    45       221           8.18            41         213            8.07          33         241        6.29

  Palos Park - 464
  $         0 $ 299,999            6        448           5.54            4          467           3.20           4          405        2.82
  $ 300,000 $ 499,999              33       245           18.00           25         257           12.50          23         230       11.50
  $ 500,000 $ 999,999              29       234           49.71           29         279           58.00          21         300       42.00
  $ 1,000,000 $ 1,999,999          8        402           96.00           7          461           84.00          6          508      No Sales
  $ 2,000,000 and up               5        356           30.00           5          386           30.00          4          502       24.00
            ALL                    81       278           21.60           70         308           17.50          58         315       14.20

  Park Ridge - 68
  $         0 $ 299,999           30        191           4.39            35         217            5.06         29          218        3.70
  $ 300,000 $ 499,999             116       270          11.32            100        298            9.60         93          309        8.52
  $ 500,000 $ 999,999             127       238          17.12            106        233           13.98         91          262       12.13
  $ 1,000,000 $ 1,999,999         38        282          45.60            31         261           37.20         25          302       37.50
  $ 2,000,000 and up               2        402         No Sales           2         210          No Sales        2          241      No Sales
            ALL                   313       252          12.36            274        258           10.64         240         279        8.92

  Plainfield - 544
  $         0 $ 299,999           440       202           6.37            410        205           5.87          385         214        5.63
  $ 300,000 $ 499,999             199       279          11.16            183        284           10.61         177         284        10.46
  $ 500,000 $ 999,999             68        342          48.00            55         376           55.00         52          385        44.57
  $ 1,000,000 $ 1,999,999          1        148         No Sales           0          0            0.00           0           0          0.00
  $ 2,000,000 and up               0         0            0.00             0          0             0.00          0           0          0.00
            ALL                   708       237           8.02            648        242            7.36         614         248         7.10


Data Source: MRED LLC                             (C) Copyright 2010, A.L. Wagner Appraisal Group, Inc.
Midwest Real Estate Data, LLC                          (630) 416-6556 www.WagnerAppraisal.com                                                   Page 19
as of November 1, 2009                  as of December 1, 2009                     as of January 1, 2010
                                # Actives   DOM      Months Supply     # Actives     DOM       Months Supply   # Actives    DOM     Months Supply
  Prospect Heights - 70
  $         0 $ 299,999            5        103           2.73            6          144            3.27          6          175        3.43
  $ 300,000 $ 499,999              23       291          14.53            22         239           16.50          17         286       11.33
  $ 500,000 $ 999,999              22       234          22.00            21         221           21.00          18         228       19.64
  $ 1,000,000 $ 1,999,999          2        365         No Sales          2          395          No Sales        2          426      No Sales
  $ 2,000,000 and up               0         0            0.00            0           0             0.00           0          0         0.00
            ALL                    52       252          11.77            51         226           12.24          43         253       10.32

  River Forest - 305
  $         0 $ 299,999            2        314           24.00           1          189           6.00           0           0          0.00
  $ 300,000 $ 499,999              11       241           6.95            11         272           7.33           8          252        5.05
  $ 500,000 $ 999,999              44       228           12.00           34         243           9.07           25         281        6.38
  $ 1,000,000 $ 1,999,999          16       397           14.77           16         306           21.33          12         358        14.40
  $ 2,000,000 and up               3        286           18.00           4          241           48.00          2          89         24.00
            ALL                    76       270           11.54           66         262           10.56          47         287        7.14

  Riverside - 546
  $         0 $ 299,999            17       223          15.69            16         248           12.00          17         264       12.75
  $ 300,000 $ 499,999              41       327          14.06            41         332           14.47          35         372       12.35
  $ 500,000 $ 999,999              31       285          31.00            30         299           25.71          23         300       21.23
  $ 1,000,000 $ 1,999,999          4        447          48.00            3          540           36.00          4          433       48.00
  $ 2,000,000 and up               1        983         No Sales          1         1,013         No Sales        1         1,044     No Sales
            ALL                    94       306          18.49            91         321           16.80          80         340       15.00

  Riverwoods - 7215
  $         0 $ 299,999            2        71            24.00           1          168           6.00           1          199        6.00
  $ 300,000 $ 499,999              9        331           13.50           7          341           9.33           6          288        7.20
  $ 500,000 $ 999,999              38       243           30.40           30         251           22.50          33         298        23.29
  $ 1,000,000 $ 1,999,999          16       365           48.00           10         454           24.00          9          508        21.60
  $ 2,000,000 and up               5        403           20.00           4          412           16.00          2          627        8.00
            ALL                    70       289           27.10           52         313           17.83          51         345        16.54

  Rolling Meadows - 8
  $         0 $ 299,999            48       165           5.94            50         178           6.32           46         218        5.81
  $ 300,000 $ 499,999              19       166           9.91            20         160           10.43          14         194        7.00
  $ 500,000 $ 999,999              6        214           18.00           4          246           12.00          4          277        12.00
  $ 1,000,000 $ 1,999,999          0         0            0.00            0           0            0.00           0           0          0.00
  $ 2,000,000 and up                0        0             0.00            0          0             0.00           0          0          0.00
            ALL                    73       169            7.06           74         176            7.28          64         217         6.24


Data Source: MRED LLC                             (C) Copyright 2010, A.L. Wagner Appraisal Group, Inc.
Midwest Real Estate Data, LLC                          (630) 416-6556 www.WagnerAppraisal.com                                                   Page 20
Chicagoland Housing Market Pulse Report

Contenu connexe

Tendances

DENVER MARKET WATCH YEAR END 2009
DENVER MARKET WATCH YEAR END 2009DENVER MARKET WATCH YEAR END 2009
DENVER MARKET WATCH YEAR END 2009Tom Cryer
 
Student Loan Calculator
Student Loan CalculatorStudent Loan Calculator
Student Loan Calculatorfpcksc
 
Asta data spots_howmanytravelagents&agenciesarethere_slideshow
Asta data spots_howmanytravelagents&agenciesarethere_slideshowAsta data spots_howmanytravelagents&agenciesarethere_slideshow
Asta data spots_howmanytravelagents&agenciesarethere_slideshowAmerican Society of Travel Agents
 
Austin Market Update January 2008
Austin Market Update January 2008Austin Market Update January 2008
Austin Market Update January 2008Dee Patience
 
Tax Deferred Investing
Tax Deferred InvestingTax Deferred Investing
Tax Deferred Investinghlazarus
 
39348363 google-earnings-slides-q3-2010
39348363 google-earnings-slides-q3-201039348363 google-earnings-slides-q3-2010
39348363 google-earnings-slides-q3-2010Pranav Bhatnagar
 
Math in the News: 11/21/11
Math in the News: 11/21/11Math in the News: 11/21/11
Math in the News: 11/21/11Media4math
 
Grand Lake OK 2005 2011 full year real estate market analysis
Grand Lake OK 2005   2011 full year real estate market analysisGrand Lake OK 2005   2011 full year real estate market analysis
Grand Lake OK 2005 2011 full year real estate market analysisRE/MAX Grand Lake
 
Profundización excel jeisson murillo
Profundización excel jeisson murilloProfundización excel jeisson murillo
Profundización excel jeisson murilloJeisson Murillo
 
Kickstarter and Games - December 2012
Kickstarter and Games - December 2012Kickstarter and Games - December 2012
Kickstarter and Games - December 2012ICO Partners
 
Kickstarter - General data
Kickstarter - General dataKickstarter - General data
Kickstarter - General dataICO Partners
 

Tendances (17)

DENVER MARKET WATCH YEAR END 2009
DENVER MARKET WATCH YEAR END 2009DENVER MARKET WATCH YEAR END 2009
DENVER MARKET WATCH YEAR END 2009
 
Student Loan Calculator
Student Loan CalculatorStudent Loan Calculator
Student Loan Calculator
 
Asta data spots_howmanytravelagents&agenciesarethere_slideshow
Asta data spots_howmanytravelagents&agenciesarethere_slideshowAsta data spots_howmanytravelagents&agenciesarethere_slideshow
Asta data spots_howmanytravelagents&agenciesarethere_slideshow
 
Austin Market Update January 2008
Austin Market Update January 2008Austin Market Update January 2008
Austin Market Update January 2008
 
Tax Deferred Investing
Tax Deferred InvestingTax Deferred Investing
Tax Deferred Investing
 
39348363 google-earnings-slides-q3-2010
39348363 google-earnings-slides-q3-201039348363 google-earnings-slides-q3-2010
39348363 google-earnings-slides-q3-2010
 
Toll_23Year
Toll_23YearToll_23Year
Toll_23Year
 
Math in the News: 11/21/11
Math in the News: 11/21/11Math in the News: 11/21/11
Math in the News: 11/21/11
 
Overview report to City of Temecula/Affiliate event 2/22/12
Overview report to City of Temecula/Affiliate event 2/22/12Overview report to City of Temecula/Affiliate event 2/22/12
Overview report to City of Temecula/Affiliate event 2/22/12
 
Eden Grove Hotel Projections
Eden Grove Hotel ProjectionsEden Grove Hotel Projections
Eden Grove Hotel Projections
 
Forecast
ForecastForecast
Forecast
 
Funciones
FuncionesFunciones
Funciones
 
Member tours closing %
Member tours closing %Member tours closing %
Member tours closing %
 
Grand Lake OK 2005 2011 full year real estate market analysis
Grand Lake OK 2005   2011 full year real estate market analysisGrand Lake OK 2005   2011 full year real estate market analysis
Grand Lake OK 2005 2011 full year real estate market analysis
 
Profundización excel jeisson murillo
Profundización excel jeisson murilloProfundización excel jeisson murillo
Profundización excel jeisson murillo
 
Kickstarter and Games - December 2012
Kickstarter and Games - December 2012Kickstarter and Games - December 2012
Kickstarter and Games - December 2012
 
Kickstarter - General data
Kickstarter - General dataKickstarter - General data
Kickstarter - General data
 

Similaire à Chicagoland Housing Market Pulse Report

Chicagoland Monthly Maket Pulse -Feb 2010 Attached
Chicagoland Monthly Maket Pulse -Feb 2010 AttachedChicagoland Monthly Maket Pulse -Feb 2010 Attached
Chicagoland Monthly Maket Pulse -Feb 2010 Attachedchipwags
 
H W 2010 07 At
H W 2010 07 AtH W 2010 07 At
H W 2010 07 Atchipwags
 
August 2011 Market Pulse - Attached Homes
August 2011 Market Pulse - Attached HomesAugust 2011 Market Pulse - Attached Homes
August 2011 Market Pulse - Attached Homeschipwags
 
Chicago Real Estate Market Data - Broken Down by City
Chicago Real Estate Market Data - Broken Down by CityChicago Real Estate Market Data - Broken Down by City
Chicago Real Estate Market Data - Broken Down by Citybethrepta
 
H W 2010 Q1 De 12 Mo
H W 2010 Q1 De 12 MoH W 2010 Q1 De 12 Mo
H W 2010 Q1 De 12 Mochipwags
 
H W 2010 Q3 De 12 Mo
H W 2010 Q3 De 12 MoH W 2010 Q3 De 12 Mo
H W 2010 Q3 De 12 Mochipwags
 
Chicagoland Quarterly Supply/Demand Report - 7/1/2011
Chicagoland Quarterly Supply/Demand Report - 7/1/2011Chicagoland Quarterly Supply/Demand Report - 7/1/2011
Chicagoland Quarterly Supply/Demand Report - 7/1/2011chipwags
 
Cottonwood Stats Report
Cottonwood Stats ReportCottonwood Stats Report
Cottonwood Stats ReportDamian Bruno
 
Cottonwood Stats Report for February
Cottonwood Stats Report for FebruaryCottonwood Stats Report for February
Cottonwood Stats Report for FebruaryDamian Bruno
 
Sedona August Stats Report
Sedona August Stats ReportSedona August Stats Report
Sedona August Stats ReportDamian Bruno
 
New automated techniques to validate and populate property valuations
New automated techniques to validate and populate property valuationsNew automated techniques to validate and populate property valuations
New automated techniques to validate and populate property valuationsRob Carroll
 
Cottonwood Stats Report for March
Cottonwood Stats Report for MarchCottonwood Stats Report for March
Cottonwood Stats Report for MarchDamian Bruno
 
Cottonwood Stats Report for May
Cottonwood Stats Report for MayCottonwood Stats Report for May
Cottonwood Stats Report for MayDamian Bruno
 
Cottonwood stats report
Cottonwood stats reportCottonwood stats report
Cottonwood stats reportDamian Bruno
 
Bnm comparativo de clasificaciones de riesgo nov01 - nov00
Bnm   comparativo de clasificaciones de riesgo nov01 - nov00Bnm   comparativo de clasificaciones de riesgo nov01 - nov00
Bnm comparativo de clasificaciones de riesgo nov01 - nov00gonzaloromani
 
Cottonwood Stats Report for October
Cottonwood Stats Report for OctoberCottonwood Stats Report for October
Cottonwood Stats Report for OctoberDamian Bruno
 
Bnm comparativo de provisiones oct t2001-nov2000
Bnm   comparativo de provisiones oct t2001-nov2000Bnm   comparativo de provisiones oct t2001-nov2000
Bnm comparativo de provisiones oct t2001-nov2000gonzaloromani
 
Cottonwood Stats Report for August
Cottonwood Stats Report for AugustCottonwood Stats Report for August
Cottonwood Stats Report for AugustDamian Bruno
 

Similaire à Chicagoland Housing Market Pulse Report (20)

Chicagoland Monthly Maket Pulse -Feb 2010 Attached
Chicagoland Monthly Maket Pulse -Feb 2010 AttachedChicagoland Monthly Maket Pulse -Feb 2010 Attached
Chicagoland Monthly Maket Pulse -Feb 2010 Attached
 
H W 2010 07 At
H W 2010 07 AtH W 2010 07 At
H W 2010 07 At
 
August 2011 Market Pulse - Attached Homes
August 2011 Market Pulse - Attached HomesAugust 2011 Market Pulse - Attached Homes
August 2011 Market Pulse - Attached Homes
 
Chicago Real Estate Market Data - Broken Down by City
Chicago Real Estate Market Data - Broken Down by CityChicago Real Estate Market Data - Broken Down by City
Chicago Real Estate Market Data - Broken Down by City
 
H W 2010 Q1 De 12 Mo
H W 2010 Q1 De 12 MoH W 2010 Q1 De 12 Mo
H W 2010 Q1 De 12 Mo
 
H W 2010 Q3 De 12 Mo
H W 2010 Q3 De 12 MoH W 2010 Q3 De 12 Mo
H W 2010 Q3 De 12 Mo
 
Chicagoland Quarterly Supply/Demand Report - 7/1/2011
Chicagoland Quarterly Supply/Demand Report - 7/1/2011Chicagoland Quarterly Supply/Demand Report - 7/1/2011
Chicagoland Quarterly Supply/Demand Report - 7/1/2011
 
Cottonwood Stats Report
Cottonwood Stats ReportCottonwood Stats Report
Cottonwood Stats Report
 
Cottonwood Stats Report for February
Cottonwood Stats Report for FebruaryCottonwood Stats Report for February
Cottonwood Stats Report for February
 
Sedona August Stats Report
Sedona August Stats ReportSedona August Stats Report
Sedona August Stats Report
 
New automated techniques to validate and populate property valuations
New automated techniques to validate and populate property valuationsNew automated techniques to validate and populate property valuations
New automated techniques to validate and populate property valuations
 
Cottonwood Stats Report for March
Cottonwood Stats Report for MarchCottonwood Stats Report for March
Cottonwood Stats Report for March
 
Cottonwood Stats Report for May
Cottonwood Stats Report for MayCottonwood Stats Report for May
Cottonwood Stats Report for May
 
Cottonwood stats report
Cottonwood stats reportCottonwood stats report
Cottonwood stats report
 
Bnm comparativo de clasificaciones de riesgo nov01 - nov00
Bnm   comparativo de clasificaciones de riesgo nov01 - nov00Bnm   comparativo de clasificaciones de riesgo nov01 - nov00
Bnm comparativo de clasificaciones de riesgo nov01 - nov00
 
Cottonwood Stats Report for October
Cottonwood Stats Report for OctoberCottonwood Stats Report for October
Cottonwood Stats Report for October
 
Bnm comparativo de provisiones oct t2001-nov2000
Bnm   comparativo de provisiones oct t2001-nov2000Bnm   comparativo de provisiones oct t2001-nov2000
Bnm comparativo de provisiones oct t2001-nov2000
 
Taller 13
Taller 13Taller 13
Taller 13
 
Cottonwood Stats Report for August
Cottonwood Stats Report for AugustCottonwood Stats Report for August
Cottonwood Stats Report for August
 
Monthly Market Watch - September 2012
Monthly Market Watch - September 2012Monthly Market Watch - September 2012
Monthly Market Watch - September 2012
 

Dernier

(Best) ENJOY Call Girls in Faridabad Ex | 8377087607
(Best) ENJOY Call Girls in Faridabad Ex | 8377087607(Best) ENJOY Call Girls in Faridabad Ex | 8377087607
(Best) ENJOY Call Girls in Faridabad Ex | 8377087607dollysharma2066
 
Cybersecurity Awareness Training Presentation v2024.03
Cybersecurity Awareness Training Presentation v2024.03Cybersecurity Awareness Training Presentation v2024.03
Cybersecurity Awareness Training Presentation v2024.03DallasHaselhorst
 
Market Sizes Sample Report - 2024 Edition
Market Sizes Sample Report - 2024 EditionMarket Sizes Sample Report - 2024 Edition
Market Sizes Sample Report - 2024 EditionMintel Group
 
8447779800, Low rate Call girls in Tughlakabad Delhi NCR
8447779800, Low rate Call girls in Tughlakabad Delhi NCR8447779800, Low rate Call girls in Tughlakabad Delhi NCR
8447779800, Low rate Call girls in Tughlakabad Delhi NCRashishs7044
 
Financial-Statement-Analysis-of-Coca-cola-Company.pptx
Financial-Statement-Analysis-of-Coca-cola-Company.pptxFinancial-Statement-Analysis-of-Coca-cola-Company.pptx
Financial-Statement-Analysis-of-Coca-cola-Company.pptxsaniyaimamuddin
 
Unlocking the Future: Explore Web 3.0 Workshop to Start Earning Today!
Unlocking the Future: Explore Web 3.0 Workshop to Start Earning Today!Unlocking the Future: Explore Web 3.0 Workshop to Start Earning Today!
Unlocking the Future: Explore Web 3.0 Workshop to Start Earning Today!Doge Mining Website
 
Call Girls Contact Number Andheri 9920874524
Call Girls Contact Number Andheri 9920874524Call Girls Contact Number Andheri 9920874524
Call Girls Contact Number Andheri 9920874524najka9823
 
Church Building Grants To Assist With New Construction, Additions, And Restor...
Church Building Grants To Assist With New Construction, Additions, And Restor...Church Building Grants To Assist With New Construction, Additions, And Restor...
Church Building Grants To Assist With New Construction, Additions, And Restor...Americas Got Grants
 
8447779800, Low rate Call girls in New Ashok Nagar Delhi NCR
8447779800, Low rate Call girls in New Ashok Nagar Delhi NCR8447779800, Low rate Call girls in New Ashok Nagar Delhi NCR
8447779800, Low rate Call girls in New Ashok Nagar Delhi NCRashishs7044
 
Ten Organizational Design Models to align structure and operations to busines...
Ten Organizational Design Models to align structure and operations to busines...Ten Organizational Design Models to align structure and operations to busines...
Ten Organizational Design Models to align structure and operations to busines...Seta Wicaksana
 
8447779800, Low rate Call girls in Dwarka mor Delhi NCR
8447779800, Low rate Call girls in Dwarka mor Delhi NCR8447779800, Low rate Call girls in Dwarka mor Delhi NCR
8447779800, Low rate Call girls in Dwarka mor Delhi NCRashishs7044
 
8447779800, Low rate Call girls in Uttam Nagar Delhi NCR
8447779800, Low rate Call girls in Uttam Nagar Delhi NCR8447779800, Low rate Call girls in Uttam Nagar Delhi NCR
8447779800, Low rate Call girls in Uttam Nagar Delhi NCRashishs7044
 
PB Project 1: Exploring Your Personal Brand
PB Project 1: Exploring Your Personal BrandPB Project 1: Exploring Your Personal Brand
PB Project 1: Exploring Your Personal BrandSharisaBethune
 
Flow Your Strategy at Flight Levels Day 2024
Flow Your Strategy at Flight Levels Day 2024Flow Your Strategy at Flight Levels Day 2024
Flow Your Strategy at Flight Levels Day 2024Kirill Klimov
 
MAHA Global and IPR: Do Actions Speak Louder Than Words?
MAHA Global and IPR: Do Actions Speak Louder Than Words?MAHA Global and IPR: Do Actions Speak Louder Than Words?
MAHA Global and IPR: Do Actions Speak Louder Than Words?Olivia Kresic
 
Cyber Security Training in Office Environment
Cyber Security Training in Office EnvironmentCyber Security Training in Office Environment
Cyber Security Training in Office Environmentelijahj01012
 
Guide Complete Set of Residential Architectural Drawings PDF
Guide Complete Set of Residential Architectural Drawings PDFGuide Complete Set of Residential Architectural Drawings PDF
Guide Complete Set of Residential Architectural Drawings PDFChandresh Chudasama
 
Investment in The Coconut Industry by Nancy Cheruiyot
Investment in The Coconut Industry by Nancy CheruiyotInvestment in The Coconut Industry by Nancy Cheruiyot
Investment in The Coconut Industry by Nancy Cheruiyotictsugar
 
8447779800, Low rate Call girls in Kotla Mubarakpur Delhi NCR
8447779800, Low rate Call girls in Kotla Mubarakpur Delhi NCR8447779800, Low rate Call girls in Kotla Mubarakpur Delhi NCR
8447779800, Low rate Call girls in Kotla Mubarakpur Delhi NCRashishs7044
 

Dernier (20)

(Best) ENJOY Call Girls in Faridabad Ex | 8377087607
(Best) ENJOY Call Girls in Faridabad Ex | 8377087607(Best) ENJOY Call Girls in Faridabad Ex | 8377087607
(Best) ENJOY Call Girls in Faridabad Ex | 8377087607
 
Cybersecurity Awareness Training Presentation v2024.03
Cybersecurity Awareness Training Presentation v2024.03Cybersecurity Awareness Training Presentation v2024.03
Cybersecurity Awareness Training Presentation v2024.03
 
Market Sizes Sample Report - 2024 Edition
Market Sizes Sample Report - 2024 EditionMarket Sizes Sample Report - 2024 Edition
Market Sizes Sample Report - 2024 Edition
 
8447779800, Low rate Call girls in Tughlakabad Delhi NCR
8447779800, Low rate Call girls in Tughlakabad Delhi NCR8447779800, Low rate Call girls in Tughlakabad Delhi NCR
8447779800, Low rate Call girls in Tughlakabad Delhi NCR
 
Financial-Statement-Analysis-of-Coca-cola-Company.pptx
Financial-Statement-Analysis-of-Coca-cola-Company.pptxFinancial-Statement-Analysis-of-Coca-cola-Company.pptx
Financial-Statement-Analysis-of-Coca-cola-Company.pptx
 
Unlocking the Future: Explore Web 3.0 Workshop to Start Earning Today!
Unlocking the Future: Explore Web 3.0 Workshop to Start Earning Today!Unlocking the Future: Explore Web 3.0 Workshop to Start Earning Today!
Unlocking the Future: Explore Web 3.0 Workshop to Start Earning Today!
 
Call Girls Contact Number Andheri 9920874524
Call Girls Contact Number Andheri 9920874524Call Girls Contact Number Andheri 9920874524
Call Girls Contact Number Andheri 9920874524
 
Japan IT Week 2024 Brochure by 47Billion (English)
Japan IT Week 2024 Brochure by 47Billion (English)Japan IT Week 2024 Brochure by 47Billion (English)
Japan IT Week 2024 Brochure by 47Billion (English)
 
Church Building Grants To Assist With New Construction, Additions, And Restor...
Church Building Grants To Assist With New Construction, Additions, And Restor...Church Building Grants To Assist With New Construction, Additions, And Restor...
Church Building Grants To Assist With New Construction, Additions, And Restor...
 
8447779800, Low rate Call girls in New Ashok Nagar Delhi NCR
8447779800, Low rate Call girls in New Ashok Nagar Delhi NCR8447779800, Low rate Call girls in New Ashok Nagar Delhi NCR
8447779800, Low rate Call girls in New Ashok Nagar Delhi NCR
 
Ten Organizational Design Models to align structure and operations to busines...
Ten Organizational Design Models to align structure and operations to busines...Ten Organizational Design Models to align structure and operations to busines...
Ten Organizational Design Models to align structure and operations to busines...
 
8447779800, Low rate Call girls in Dwarka mor Delhi NCR
8447779800, Low rate Call girls in Dwarka mor Delhi NCR8447779800, Low rate Call girls in Dwarka mor Delhi NCR
8447779800, Low rate Call girls in Dwarka mor Delhi NCR
 
8447779800, Low rate Call girls in Uttam Nagar Delhi NCR
8447779800, Low rate Call girls in Uttam Nagar Delhi NCR8447779800, Low rate Call girls in Uttam Nagar Delhi NCR
8447779800, Low rate Call girls in Uttam Nagar Delhi NCR
 
PB Project 1: Exploring Your Personal Brand
PB Project 1: Exploring Your Personal BrandPB Project 1: Exploring Your Personal Brand
PB Project 1: Exploring Your Personal Brand
 
Flow Your Strategy at Flight Levels Day 2024
Flow Your Strategy at Flight Levels Day 2024Flow Your Strategy at Flight Levels Day 2024
Flow Your Strategy at Flight Levels Day 2024
 
MAHA Global and IPR: Do Actions Speak Louder Than Words?
MAHA Global and IPR: Do Actions Speak Louder Than Words?MAHA Global and IPR: Do Actions Speak Louder Than Words?
MAHA Global and IPR: Do Actions Speak Louder Than Words?
 
Cyber Security Training in Office Environment
Cyber Security Training in Office EnvironmentCyber Security Training in Office Environment
Cyber Security Training in Office Environment
 
Guide Complete Set of Residential Architectural Drawings PDF
Guide Complete Set of Residential Architectural Drawings PDFGuide Complete Set of Residential Architectural Drawings PDF
Guide Complete Set of Residential Architectural Drawings PDF
 
Investment in The Coconut Industry by Nancy Cheruiyot
Investment in The Coconut Industry by Nancy CheruiyotInvestment in The Coconut Industry by Nancy Cheruiyot
Investment in The Coconut Industry by Nancy Cheruiyot
 
8447779800, Low rate Call girls in Kotla Mubarakpur Delhi NCR
8447779800, Low rate Call girls in Kotla Mubarakpur Delhi NCR8447779800, Low rate Call girls in Kotla Mubarakpur Delhi NCR
8447779800, Low rate Call girls in Kotla Mubarakpur Delhi NCR
 

Chicagoland Housing Market Pulse Report

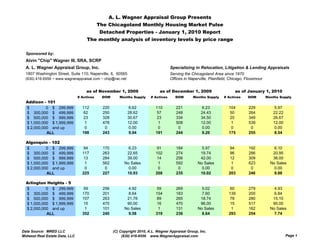
  • 1. A. L. Wagner Appraisal Group Presents The Chicagoland Monthly Housing Market Pulse Detached Properties - January 1, 2010 Report The monthly analysis of inventory levels by price range Sponsored by: Alvin "Chip" Wagner III, SRA, SCRP A. L. Wagner Appraisal Group, Inc. Specializing in Relocation, Litigation & Lending Appraisals 1807 Washington Street, Suite 110, Naperville, IL 60565 Serving the Chicagoland Area since 1970 (630) 416-6556 ~ www.wagnerappraisal.com ~ chip@rac.net Offices in Naperville, Plainfield, Chicago, Flossmoor as of November 1, 2009 as of December 1, 2009 as of January 1, 2010 # Actives DOM Months Supply # Actives DOM Months Supply # Actives DOM Months Supply Addison - 101 $ 0 $ 299,999 112 220 6.62 110 221 6.23 104 229 5.97 $ 300,000 $ 499,999 62 250 28.62 57 248 24.43 50 264 22.22 $ 500,000 $ 999,999 23 328 30.67 23 334 34.50 20 349 26.67 $ 1,000,000 $ 1,999,999 1 478 12.00 1 508 12.00 1 539 12.00 $ 2,000,000 and up 0 0 0.00 0 0 0.00 0 0 0.00 ALL 198 243 9.94 191 244 9.20 175 255 8.54 Algonquin - 102 $ 0 $ 299,999 94 170 6.23 91 184 5.97 94 192 6.10 $ 300,000 $ 499,999 117 263 22.65 102 274 19.74 96 286 20.95 $ 500,000 $ 999,999 13 284 39.00 14 256 42.00 12 309 36.00 $ 1,000,000 $ 1,999,999 1 562 No Sales 1 592 No Sales 1 623 No Sales $ 2,000,000 and up 0 0 0.00 0 0 0.00 0 0 0.00 ALL 225 227 10.93 208 235 10.02 203 246 9.98 Arlington Heights - 5 $ 0 $ 299,999 59 256 4.92 59 269 5.02 60 279 4.93 $ 300,000 $ 499,999 170 201 8.64 154 183 7.60 139 200 6.84 $ 500,000 $ 999,999 107 263 21.76 89 265 18.74 78 280 15.10 $ 1,000,000 $ 1,999,999 15 470 90.00 16 470 96.00 15 517 90.00 $ 2,000,000 and up 1 101 No Sales 1 131 No Sales 1 162 No Sales ALL 352 240 9.58 319 236 8.64 293 254 7.74 Data Source: MRED LLC (C) Copyright 2010, A.L. Wagner Appraisal Group, Inc. Midwest Real Estate Data, LLC (630) 416-6556 www.WagnerAppraisal.com Page 1
  • 2. as of November 1, 2009 as of December 1, 2009 as of January 1, 2010 # Actives DOM Months Supply # Actives DOM Months Supply # Actives DOM Months Supply Aurora - 507 $ 0 $ 299,999 789 189 7.88 763 200 7.52 740 198 7.18 $ 300,000 $ 499,999 110 222 8.46 86 249 6.62 69 263 5.31 $ 500,000 $ 999,999 22 237 20.31 18 270 18.00 16 306 17.45 $ 1,000,000 $ 1,999,999 2 292 24.00 1 166 12.00 1 197 12.00 $ 2,000,000 and up 1 173 No Sales 1 203 No Sales 1 234 No Sales ALL 924 194 8.09 869 207 7.52 827 205 7.06 Barrington Area - 10 $ 0 $ 299,999 37 226 6.94 34 199 5.51 33 187 5.28 $ 300,000 $ 499,999 106 228 10.60 97 261 9.86 92 267 9.28 $ 500,000 $ 999,999 278 266 24.17 253 274 20.94 235 300 19.05 $ 1,000,000 $ 1,999,999 117 328 45.29 122 336 47.23 113 363 42.38 $ 2,000,000 and up 69 425 207.00 65 436 260.00 64 443 153.60 ALL 607 287 20.40 571 299 18.47 537 318 17.00 Bannockburn - 7115 $ 0 $ 299,999 0 0 0.00 0 0 0.00 0 0 0.00 $ 300,000 $ 499,999 0 0 0.00 0 0 0.00 0 0 0.00 $ 500,000 $ 999,999 6 174 72.00 4 193 48.00 4 224 48.00 $ 1,000,000 $ 1,999,999 7 214 84.00 8 260 96.00 7 245 84.00 $ 2,000,000 and up 5 473 No Sales 7 550 No Sales 4 520 No Sales ALL 18 273 108.00 19 353 114.00 15 312 90.00 Bartlett - 104 $ 0 $ 299,999 69 207 4.65 75 226 5.33 78 221 5.74 $ 300,000 $ 499,999 96 173 11.18 84 189 10.08 83 199 10.83 $ 500,000 $ 999,999 27 287 54.00 27 295 81.00 27 321 81.00 $ 1,000,000 $ 1,999,999 1 278 No Sales 1 308 No Sales 1 339 No Sales $ 2,000,000 and up 0 0 0.00 0 0 0.00 0 0 0.00 ALL 193 202 8.07 187 220 8.22 189 226 8.76 Batavia - 510 $ 0 $ 299,999 85 195 8.72 83 196 8.51 80 212 7.80 $ 300,000 $ 499,999 69 218 16.24 54 237 11.37 46 256 9.05 $ 500,000 $ 999,999 34 274 16.32 31 294 15.50 32 308 16.00 $ 1,000,000 $ 1,999,999 7 200 No Sales 8 205 No Sales 8 236 No Sales $ 2,000,000 and up 0 0 0.00 0 0 0.00 0 0 0.00 ALL 195 217 12.12 176 226 10.67 166 244 9.58 Data Source: MRED LLC (C) Copyright 2010, A.L. Wagner Appraisal Group, Inc. Midwest Real Estate Data, LLC (630) 416-6556 www.WagnerAppraisal.com Page 2
  • 3. as of November 1, 2009 as of December 1, 2009 as of January 1, 2010 # Actives DOM Months Supply # Actives DOM Months Supply # Actives DOM Months Supply Bensenville - 106 $ 0 $ 299,999 88 230 8.12 84 220 7.75 83 235 7.32 $ 300,000 $ 499,999 39 371 78.00 38 382 57.00 31 427 41.33 $ 500,000 $ 999,999 6 131 72.00 5 90 30.00 5 121 30.00 $ 1,000,000 $ 1,999,999 0 0 0.00 0 0 0.00 0 0 0.00 $ 2,000,000 and up 0 0 0.00 0 0 0.00 0 0 0.00 ALL 133 267 11.65 127 263 10.89 119 281 9.71 Bloomingdale - 108 $ 0 $ 299,999 20 190 4.53 16 198 3.31 17 213 3.71 $ 300,000 $ 499,999 45 184 11.02 47 178 11.75 43 223 10.98 $ 500,000 $ 999,999 29 298 24.86 28 267 30.55 26 273 34.67 $ 1,000,000 $ 1,999,999 5 546 60.00 4 656 48.00 4 687 No Sales $ 2,000,000 and up 0 0 0.00 0 0 0.00 0 0 0.00 ALL 99 237 10.15 95 228 9.66 90 256 9.73 Bolingbrook - 440 $ 0 $ 299,999 253 191 5.40 246 193 5.19 242 190 5.17 $ 300,000 $ 499,999 104 208 21.89 93 224 18.60 84 238 17.38 $ 500,000 $ 999,999 12 301 72.00 11 305 66.00 12 301 48.00 $ 1,000,000 $ 1,999,999 0 0 0.00 0 0 0.00 0 0 0.00 $ 2,000,000 and up 0 0 0.00 0 0 0.00 0 0 0.00 ALL 369 199 7.13 350 205 6.66 338 206 6.51 Buffalo Grove - 89 $ 0 $ 299,999 37 248 4.19 40 236 4.40 36 242 4.04 $ 300,000 $ 499,999 74 223 9.55 63 207 7.88 56 222 6.86 $ 500,000 $ 999,999 42 178 10.50 37 203 9.25 32 251 8.53 $ 1,000,000 $ 1,999,999 1 202 No Sales 1 232 No Sales 0 0 0.00 $ 2,000,000 and up 0 0 0.00 0 0 0.00 0 0 0.00 ALL 154 216 7.48 141 214 6.69 124 235 5.95 Burr Ridge - 522 $ 0 $ 499,999 34 229 14.07 35 219 15.00 28 221 10.84 $ 500,000 $ 999,999 54 297 15.07 49 333 15.89 46 329 14.15 $ 1,000,000 $ 1,999,999 66 309 37.71 50 326 30.00 49 351 29.40 $ 2,000,000 $ 2,999,999 22 343 264.00 18 400 108.00 17 428 68.00 $ 3,000,000 and up 11 376 66.00 9 456 108.00 6 332 24.00 ALL 187 299 23.38 161 320 21.95 146 327 18.25 Data Source: MRED LLC (C) Copyright 2010, A.L. Wagner Appraisal Group, Inc. Midwest Real Estate Data, LLC (630) 416-6556 www.WagnerAppraisal.com Page 3
  • 4. as of November 1, 2009 as of December 1, 2009 as of January 1, 2010 # Actives DOM Months Supply # Actives DOM Months Supply # Actives DOM Months Supply Carol Stream - 188 $ 0 $ 299,999 87 186 8.16 82 194 8.00 79 191 7.77 $ 300,000 $ 499,999 33 216 12.38 35 216 13.13 32 247 12.80 $ 500,000 $ 999,999 5 268 60.00 5 298 No Sales 5 329 No Sales $ 1,000,000 $ 1,999,999 0 0 0.00 0 0 0.00 0 0 0.00 $ 2,000,000 and up 0 0 0.00 0 0 0.00 0 0 0.00 ALL 125 197 9.32 122 204 9.45 116 213 9.16 Carpentersville,Lake Marion - 110 $ 0 $ 299,999 229 222 8.81 229 222 8.89 222 222 8.59 $ 300,000 $ 499,999 31 264 26.57 25 249 21.43 26 239 34.67 $ 500,000 $ 999,999 3 671 No Sales 3 702 No Sales 2 294 No Sales $ 1,000,000 $ 1,999,999 0 0 0.00 0 0 0.00 0 0 0.00 $ 2,000,000 and up 0 0 0.00 0 0 0.00 0 0 0.00 ALL 263 232 9.68 257 230 9.55 250 224 9.40 Cary, Oakwood Hills - 13 $ 0 $ 299,999 102 209 7.85 89 200 6.76 86 206 6.88 $ 300,000 $ 499,999 73 262 24.33 59 298 20.82 51 305 17.00 $ 500,000 $ 999,999 27 293 81.00 22 356 66.00 20 396 48.00 $ 1,000,000 $ 1,999,999 2 67 24.00 2 97 24.00 2 128 24.00 $ 2,000,000 and up 0 0 0.00 0 0 0.00 0 0 0.00 ALL 204 238 12.43 172 252 10.48 159 261 9.94 Channahon - 410 $ 0 $ 299,999 63 232 7.64 57 250 6.91 68 252 8.59 $ 300,000 $ 499,999 23 313 25.09 23 314 25.09 24 344 36.00 $ 500,000 $ 999,999 2 416 No Sales 2 440 No Sales 2 471 No Sales $ 1,000,000 $ 1,999,999 0 0 0.00 0 0 0.00 0 0 0.00 $ 2,000,000 and up 1 579 No Sales 1 609 No Sales 1 640 No Sales ALL 89 261 9.71 83 277 9.05 95 284 11.07 Clarendon Hills - 514 $ 0 $ 299,999 9 390 4.32 9 334 4.50 7 417 3.23 $ 300,000 $ 499,999 29 231 14.50 29 248 16.57 25 248 13.04 $ 500,000 $ 999,999 20 237 7.27 20 274 7.27 15 233 5.29 $ 1,000,000 $ 1,999,999 25 266 25.00 19 253 22.80 17 293 20.40 $ 2,000,000 and up 2 99 No Sales 2 129 No Sales 1 213 No Sales ALL 85 256 10.85 79 263 10.77 65 274 8.39 Data Source: MRED LLC (C) Copyright 2010, A.L. Wagner Appraisal Group, Inc. Midwest Real Estate Data, LLC (630) 416-6556 www.WagnerAppraisal.com Page 4
  • 5. as of November 1, 2009 as of December 1, 2009 as of January 1, 2010 # Actives DOM Months Supply # Actives DOM Months Supply # Actives DOM Months Supply Countryside - 527 $ 0 $ 299,999 8 150 8.00 7 222 8.40 7 239 7.64 $ 300,000 $ 499,999 17 335 51.00 15 391 45.00 14 441 42.00 $ 500,000 $ 999,999 8 392 19.20 6 523 18.00 2 664 6.00 $ 1,000,000 $ 1,999,999 0 0 0.00 0 0 0.00 0 0 0.00 $ 2,000,000 and up 0 0 0.00 0 0 0.00 0 0 0.00 ALL 33 304 18.86 28 377 18.67 23 399 14.53 Crystal Lake, Lakewood - 14 $ 0 $ 299,999 240 219 7.74 228 223 7.18 215 235 6.40 $ 300,000 $ 499,999 160 282 14.77 137 311 11.91 133 316 11.48 $ 500,000 $ 999,999 75 272 39.13 68 284 34.00 63 335 39.79 $ 1,000,000 $ 1,999,999 11 305 66.00 14 250 84.00 14 281 168.00 $ 2,000,000 and up 0 0 0.00 0 0 0.00 0 0 0.00 ALL 486 250 11.07 447 260 9.84 425 277 9.07 Darien - 562 $ 0 $ 299,999 31 277 6.41 27 265 5.68 20 312 4.29 $ 300,000 $ 499,999 42 195 11.45 34 199 9.49 28 235 8.00 $ 500,000 $ 999,999 24 182 28.80 22 215 29.33 20 229 24.00 $ 1,000,000 $ 1,999,999 0 0 0.00 0 0 0.00 0 0 0.00 $ 2,000,000 and up 0 0 0.00 0 0 0.00 0 0 0.00 ALL 97 218 10.39 83 225 9.14 68 256 7.56 Deerfield - 15 $ 0 $ 299,999 7 469 3.36 7 427 3.11 7 458 3.11 $ 300,000 $ 499,999 46 252 9.86 41 256 8.95 36 227 8.15 $ 500,000 $ 999,999 67 243 12.56 68 246 13.38 58 255 10.71 $ 1,000,000 $ 1,999,999 17 482 17.00 18 533 21.60 16 523 21.33 $ 2,000,000 and up 1 1,431 No Sales 2 1,246 No Sales 2 1,270 No Sales ALL 138 295 10.55 136 311 10.67 119 312 9.27 Des Plaines - 16 $ 0 $ 299,999 192 226 6.92 183 235 6.48 175 236 6.33 $ 300,000 $ 499,999 98 235 21.78 84 222 20.16 70 246 16.80 $ 500,000 $ 999,999 31 316 23.25 30 338 24.00 27 339 23.14 $ 1,000,000 $ 1,999,999 1 349 No Sales 3 138 No Sales 3 169 No Sales $ 2,000,000 and up 3 98 No Sales 3 128 No Sales 3 159 No Sales ALL 325 236 9.68 303 240 9.00 278 247 8.42 Data Source: MRED LLC (C) Copyright 2010, A.L. Wagner Appraisal Group, Inc. Midwest Real Estate Data, LLC (630) 416-6556 www.WagnerAppraisal.com Page 5
  • 6. as of November 1, 2009 as of December 1, 2009 as of January 1, 2010 # Actives DOM Months Supply # Actives DOM Months Supply # Actives DOM Months Supply Downers Grove - 515 $ 0 $ 299,999 102 252 7.51 88 290 6.40 85 313 5.96 $ 300,000 $ 499,999 110 222 9.57 102 224 8.74 101 232 8.78 $ 500,000 $ 999,999 110 343 19.13 90 359 15.00 80 377 14.55 $ 1,000,000 $ 1,999,999 19 377 32.57 19 410 32.57 18 451 36.00 $ 2,000,000 and up 3 229 No Sales 2 304 No Sales 3 284 No Sales ALL 344 278 10.95 301 296 9.41 287 311 9.04 East & West Dundee,Sleepy Hollow - 118 $ 0 $ 299,999 45 201 7.83 43 193 7.37 45 222 7.71 $ 300,000 $ 499,999 59 279 18.15 50 325 13.95 45 317 13.17 $ 500,000 $ 999,999 15 380 180.00 12 383 No Sales 12 414 No Sales $ 1,000,000 $ 1,999,999 1 898 No Sales 1 928 No Sales 1 959 No Sales $ 2,000,000 and up 0 0 0.00 0 0 0.00 0 0 0.00 ALL 120 268 13.21 106 284 11.26 103 293 11.14 Elburn - 119 $ 0 $ 299,999 42 296 11.20 39 318 9.96 39 346 9.55 $ 300,000 $ 499,999 61 342 22.18 53 317 17.67 49 325 16.33 $ 500,000 $ 999,999 23 388 27.60 21 372 28.00 19 420 28.50 $ 1,000,000 $ 1,999,999 4 253 No Sales 5 266 No Sales 4 323 No Sales $ 2,000,000 and up 2 70 No Sales 2 100 No Sales 2 131 No Sales ALL 132 329 18.00 120 321 15.65 113 344 14.58 Elgin - 123 $ 0 $ 299,999 607 240 9.19 561 248 8.51 533 254 7.84 $ 300,000 $ 499,999 176 392 26.40 164 387 24.00 153 409 22.12 $ 500,000 $ 999,999 74 392 88.80 68 433 90.67 67 432 89.33 $ 1,000,000 $ 1,999,999 6 288 No Sales 3 245 No Sales 3 276 No Sales $ 2,000,000 and up 0 0 0.00 0 0 0.00 0 0 0.00 ALL 863 284 11.73 796 293 10.83 756 301 9.99 Elk Grove Village - 7 $ 0 $ 299,999 70 241 8.32 66 233 7.62 71 239 8.35 $ 300,000 $ 499,999 53 240 12.72 47 239 12.00 41 272 10.70 $ 500,000 $ 999,999 10 260 40.00 9 309 36.00 9 325 36.00 $ 1,000,000 $ 1,999,999 0 0 0.00 0 0 0.00 0 0 0.00 $ 2,000,000 and up 0 0 0.00 0 0 0.00 0 0 0.00 ALL 133 242 10.36 122 241 9.51 121 257 9.62 Data Source: MRED LLC (C) Copyright 2010, A.L. Wagner Appraisal Group, Inc. Midwest Real Estate Data, LLC (630) 416-6556 www.WagnerAppraisal.com Page 6
  • 7. as of November 1, 2009 as of December 1, 2009 as of January 1, 2010 # Actives DOM Months Supply # Actives DOM Months Supply # Actives DOM Months Supply Elmhurst - 126 $ 0 $ 299,999 80 171 6.04 69 171 5.11 61 208 4.55 $ 300,000 $ 499,999 93 187 8.72 84 201 8.40 75 185 7.44 $ 500,000 $ 999,999 99 313 12.00 90 324 11.02 80 357 10.21 $ 1,000,000 $ 1,999,999 35 316 26.25 32 342 22.59 25 413 16.67 $ 2,000,000 and up 2 27 No Sales 2 57 No Sales 2 88 No Sales ALL 309 237 9.22 277 249 8.37 243 270 7.40 Elmwood Park - 635 $ 0 $ 299,999 79 213 6.32 84 216 6.46 73 221 5.73 $ 300,000 $ 499,999 44 308 22.96 41 291 21.39 35 323 19.09 $ 500,000 $ 999,999 8 289 No Sales 5 279 No Sales 5 310 No Sales $ 1,000,000 $ 1,999,999 0 0 0.00 0 0 0.00 0 0 0.00 $ 2,000,000 and up 0 0 0.00 0 0 0.00 0 0 0.00 ALL 131 250 9.09 130 242 8.72 113 257 7.75 Evanston - 201 $ 0 $ 299,999 45 305 5.09 47 293 5.48 42 285 4.54 $ 300,000 $ 499,999 67 153 6.70 61 172 6.20 51 199 5.19 $ 500,000 $ 999,999 94 194 9.98 82 224 8.63 75 249 7.96 $ 1,000,000 $ 1,999,999 19 297 9.50 20 278 12.00 20 347 12.63 $ 2,000,000 and up 12 351 144.00 11 392 132.00 10 434 60.00 ALL 237 219 7.81 221 238 7.45 198 263 6.55 Flossmoor - 422 $ 0 $ 299,999 75 261 8.41 66 283 7.62 61 304 6.91 $ 300,000 $ 499,999 30 277 15.65 29 260 19.33 29 285 19.33 $ 500,000 $ 999,999 27 371 46.29 23 387 46.00 20 291 40.00 $ 1,000,000 $ 1,999,999 2 192 No Sales 2 222 No Sales 2 253 No Sales $ 2,000,000 and up 0 0 0.00 0 0 0.00 0 0 0.00 ALL 134 286 11.74 120 296 11.25 112 296 10.34 Frankfort,Green Garden - 423 $ 0 $ 299,999 63 190 8.49 59 185 7.78 53 204 6.56 $ 300,000 $ 499,999 133 251 13.19 128 250 13.02 113 241 10.94 $ 500,000 $ 999,999 77 318 30.80 66 315 22.63 58 350 20.47 $ 1,000,000 $ 1,999,999 6 498 72.00 5 462 60.00 6 577 No Sales $ 2,000,000 and up 0 0 0.00 1 9 No Sales 1 40 No Sales ALL 279 261 13.89 259 255 12.69 231 268 10.87 Data Source: MRED LLC (C) Copyright 2010, A.L. Wagner Appraisal Group, Inc. Midwest Real Estate Data, LLC (630) 416-6556 www.WagnerAppraisal.com Page 7
  • 8. as of November 1, 2009 as of December 1, 2009 as of January 1, 2010 # Actives DOM Months Supply # Actives DOM Months Supply # Actives DOM Months Supply Franklin Park - 131 $ 0 $ 299,999 113 204 7.84 107 211 7.55 109 207 7.35 $ 300,000 $ 499,999 12 238 144.00 9 265 108.00 10 223 120.00 $ 500,000 $ 999,999 0 0 0.00 0 0 0.00 0 0 0.00 $ 1,000,000 $ 1,999,999 0 0 0.00 0 0 0.00 0 0 0.00 $ 2,000,000 and up 0 0 0.00 0 0 0.00 0 0 0.00 ALL 125 207 8.62 116 215 8.14 119 208 7.98 Geneva - 134 $ 0 $ 299,999 55 190 5.89 50 169 5.41 47 200 5.22 $ 300,000 $ 499,999 100 217 8.16 101 213 8.36 89 212 7.27 $ 500,000 $ 999,999 32 257 12.00 30 252 12.41 35 226 14.48 $ 1,000,000 $ 1,999,999 7 480 84.00 8 470 96.00 8 434 48.00 $ 2,000,000 and up 0 0 0.00 0 0 0.00 0 0 0.00 ALL 194 226 7.95 189 218 7.90 179 221 7.48 Glen Ellyn - 137 $ 0 $ 299,999 51 210 5.51 59 188 6.16 53 231 5.39 $ 300,000 $ 499,999 87 225 9.24 76 218 8.29 67 251 7.73 $ 500,000 $ 999,999 91 307 15.83 81 337 13.89 76 358 13.41 $ 1,000,000 $ 1,999,999 32 537 54.86 28 585 42.00 23 627 30.67 $ 2,000,000 and up 6 365 No Sales 6 395 No Sales 6 426 No Sales ALL 267 291 10.68 250 295 9.90 225 326 9.03 Glencoe - 22 $ 0 $ 499,999 9 230 7.20 8 194 6.40 6 236 4.24 $ 500,000 $ 999,999 35 186 8.24 36 185 8.64 31 194 7.02 $ 1,000,000 $ 1,999,999 36 287 11.68 33 299 9.90 38 306 13.03 $ 2,000,000 $ 2,999,999 7 366 7.64 5 257 5.00 4 283 4.80 $ 3,000,000 and up 17 367 51.00 17 368 40.80 17 341 34.00 ALL 104 266 10.58 99 259 9.74 96 271 9.52 Glendale Heights - 139 $ 0 $ 299,999 125 231 6.91 119 246 6.46 107 237 5.66 $ 300,000 $ 499,999 8 217 24.00 8 204 19.20 6 251 14.40 $ 500,000 $ 999,999 1 173 No Sales 1 202 No Sales 1 233 No Sales $ 1,000,000 $ 1,999,999 0 0 0.00 0 0 0.00 0 0 0.00 $ 2,000,000 and up 0 0 0.00 0 0 0.00 0 0 0.00 ALL 134 229 7.28 128 243 6.80 114 238 5.90 Data Source: MRED LLC (C) Copyright 2010, A.L. Wagner Appraisal Group, Inc. Midwest Real Estate Data, LLC (630) 416-6556 www.WagnerAppraisal.com Page 8
  • 9. as of November 1, 2009 as of December 1, 2009 as of January 1, 2010 # Actives DOM Months Supply # Actives DOM Months Supply # Actives DOM Months Supply Glenview,Golf - 25 $ 0 $ 299,999 31 275 5.24 27 241 4.38 28 249 4.67 $ 300,000 $ 499,999 117 231 11.70 102 267 10.37 90 292 9.15 $ 500,000 $ 999,999 168 233 14.30 153 248 13.11 137 270 11.50 $ 1,000,000 $ 1,999,999 89 291 31.41 78 297 27.53 69 310 23.00 $ 2,000,000 and up 10 342 60.00 9 352 54.00 5 485 30.00 ALL 415 251 13.53 369 266 12.03 329 286 10.64 Grayslake,Hainesville - 30 $ 0 $ 299,999 188 203 8.58 175 204 8.08 174 215 8.06 $ 300,000 $ 499,999 104 231 29.02 90 254 29.19 75 270 23.68 $ 500,000 $ 999,999 21 226 42.00 16 268 64.00 10 314 40.00 $ 1,000,000 $ 1,999,999 0 0 0.00 0 0 0.00 0 0 0.00 $ 2,000,000 and up 0 0 0.00 0 0 0.00 0 0 0.00 ALL 313 214 12.04 281 224 11.24 259 235 10.36 Gurnee - 31 $ 0 $ 299,999 110 211 7.42 108 209 7.24 97 207 6.40 $ 300,000 $ 499,999 87 246 11.47 91 281 13.16 82 274 12.00 $ 500,000 $ 999,999 41 224 32.80 36 254 30.86 38 273 38.00 $ 1,000,000 $ 1,999,999 1 548 12.00 1 578 12.00 1 609 12.00 $ 2,000,000 and up 0 0 0.00 0 0 0.00 0 0 0.00 ALL 239 227 10.06 236 245 10.22 218 245 9.44 Hanover Park - 103 $ 0 $ 299,999 128 211 6.95 114 208 6.11 117 211 6.59 $ 300,000 $ 499,999 1 223 No Sales 0 0 0.00 0 0 0.00 $ 500,000 $ 999,999 1 388 No Sales 1 418 No Sales 1 449 No Sales $ 1,000,000 $ 1,999,999 0 0 0.00 0 0 0.00 0 0 0.00 $ 2,000,000 and up 0 0 0.00 0 0 0.00 0 0 0.00 ALL 130 212 7.06 115 210 6.16 118 213 6.65 Highland Park - 35 $ 0 $ 299,999 21 229 5.36 20 247 5.00 18 269 4.41 $ 300,000 $ 499,999 92 185 16.48 81 202 13.50 78 212 13.18 $ 500,000 $ 999,999 151 251 18.49 135 244 16.36 114 270 14.55 $ 1,000,000 $ 1,999,999 72 415 25.41 68 423 25.50 61 454 22.18 $ 2,000,000 and up 36 366 144.00 34 400 204.00 29 423 174.00 ALL 372 276 17.93 338 286 16.03 300 307 14.46 Data Source: MRED LLC (C) Copyright 2010, A.L. Wagner Appraisal Group, Inc. Midwest Real Estate Data, LLC (630) 416-6556 www.WagnerAppraisal.com Page 9
  • 10. as of November 1, 2009 as of December 1, 2009 as of January 1, 2010 # Actives DOM Months Supply # Actives DOM Months Supply # Actives DOM Months Supply Hinsdale - 521 $ 0 $ 499,999 46 293 6.65 42 311 6.00 48 317 7.29 $ 500,000 $ 999,999 89 235 12.71 71 250 9.79 61 218 8.41 $ 1,000,000 $ 1,999,999 94 311 16.35 75 310 13.24 72 315 12.52 $ 2,000,000 $ 2,999,999 33 157 28.29 29 208 26.77 29 239 29.00 $ 3,000,000 and up 21 369 31.50 13 346 26.00 11 332 16.50 ALL 283 270 13.16 230 281 10.70 221 279 10.40 Hoffman Estates - 194 $ 0 $ 299,999 76 213 5.36 79 197 5.75 82 195 6.11 $ 300,000 $ 499,999 90 226 10.69 70 238 8.16 69 258 8.28 $ 500,000 $ 999,999 23 226 46.00 14 243 33.60 13 194 26.00 $ 1,000,000 $ 1,999,999 1 95 No Sales 1 125 No Sales 1 156 No Sales $ 2,000,000 and up 0 0 0.00 0 0 0.00 0 0 0.00 ALL 190 220 8.23 164 218 7.21 165 221 7.42 Homer Glen - 500 $ 0 $ 299,999 32 229 5.82 30 233 5.90 34 215 6.80 $ 300,000 $ 499,999 109 266 19.82 100 283 17.39 91 315 15.17 $ 500,000 $ 999,999 53 319 48.92 44 341 44.00 39 285 39.00 $ 1,000,000 $ 1,999,999 13 413 156.00 10 422 120.00 8 400 96.00 $ 2,000,000 and up 1 1,261 No Sales 0 0 0.00 0 0 0.00 ALL 208 288 17.10 184 296 15.44 172 293 14.23 Homewood - 430 $ 0 $ 299,999 125 179 7.28 105 176 6.03 96 192 5.67 $ 300,000 $ 499,999 5 299 8.57 4 316 8.00 3 333 7.20 $ 500,000 $ 999,999 0 0 0.00 0 0 0.00 0 0 0.00 $ 1,000,000 $ 1,999,999 0 0 0.00 0 0 0.00 0 0 0.00 $ 2,000,000 and up 0 0 0.00 0 0 0.00 0 0 0.00 ALL 130 183 7.32 109 181 6.08 99 196 5.71 Indian Head Park - 531 $ 0 $ 299,999 1 160 No Sales 0 0 0.00 0 0 0.00 $ 300,000 $ 499,999 7 253 28.00 4 186 16.00 5 177 20.00 $ 500,000 $ 999,999 6 169 72.00 7 173 84.00 7 201 84.00 $ 1,000,000 $ 1,999,999 0 0 0.00 0 0 0.00 0 0 0.00 $ 2,000,000 and up 0 0 0.00 0 0 0.00 0 0 0.00 ALL 14 210 42.00 11 178 26.40 12 191 28.80 Data Source: MRED LLC (C) Copyright 2010, A.L. Wagner Appraisal Group, Inc. Midwest Real Estate Data, LLC (630) 416-6556 www.WagnerAppraisal.com Page 10
  • 11. as of November 1, 2009 as of December 1, 2009 as of January 1, 2010 # Actives DOM Months Supply # Actives DOM Months Supply # Actives DOM Months Supply Inverness - 7167 $ 0 $ 299,999 2 377 No Sales 1 726 12.00 1 757 12.00 $ 300,000 $ 499,999 19 365 17.54 18 432 16.62 14 366 11.20 $ 500,000 $ 999,999 59 326 24.41 56 320 24.89 50 331 22.22 $ 1,000,000 $ 1,999,999 22 280 66.00 19 262 38.00 18 239 36.00 $ 2,000,000 and up 8 599 No Sales 7 641 No Sales 7 672 No Sales ALL 110 344 28.70 101 355 25.79 90 349 22.04 Itasca - 143 $ 0 $ 299,999 21 209 8.13 20 224 7.50 16 274 5.33 $ 300,000 $ 499,999 22 271 33.00 14 304 15.27 15 304 16.36 $ 500,000 $ 999,999 20 562 40.00 17 653 29.14 17 683 29.14 $ 1,000,000 $ 1,999,999 2 113 24.00 2 95 24.00 2 128 24.00 $ 2,000,000 and up 0 0 0.00 0 0 0.00 0 0 0.00 ALL 65 335 16.96 53 378 12.47 50 416 10.91 Joliet - 499 $ 0 $ 299,999 677 187 8.75 637 187 8.11 606 196 7.99 $ 300,000 $ 499,999 20 242 24.00 20 260 21.82 17 282 25.50 $ 500,000 $ 999,999 9 326 No Sales 8 292 No Sales 7 402 No Sales $ 1,000,000 $ 1,999,999 0 0 0.00 0 0 0.00 0 0 0.00 $ 2,000,000 and up 0 0 0.00 0 0 0.00 0 0 0.00 ALL 706 191 9.03 665 191 8.36 630 201 8.24 Kenilworth - 43 $ 0 $ 299,999 0 0 0.00 0 0 0.00 0 0 0.00 $ 300,000 $ 499,999 1 157 4.00 1 187 4.00 0 0 0.00 $ 500,000 $ 999,999 14 231 28.00 8 209 16.00 6 236 10.29 $ 1,000,000 $ 1,999,999 15 344 22.50 12 320 16.00 9 363 9.82 $ 2,000,000 and up 24 382 36.00 18 384 36.00 16 411 24.00 ALL 54 328 25.92 39 324 19.50 31 363 12.40 LaGrange - 525 $ 0 $ 299,999 26 275 8.00 22 270 6.14 22 269 5.74 $ 300,000 $ 499,999 27 164 5.68 21 170 4.06 16 196 3.20 $ 500,000 $ 999,999 56 211 14.30 50 232 12.77 42 283 9.88 $ 1,000,000 $ 1,999,999 3 693 18.00 3 723 36.00 2 634 24.00 $ 2,000,000 and up 0 0 0.00 0 0 0.00 0 0 0.00 ALL 112 227 9.27 96 243 7.53 82 271 6.23 Data Source: MRED LLC (C) Copyright 2010, A.L. Wagner Appraisal Group, Inc. Midwest Real Estate Data, LLC (630) 416-6556 www.WagnerAppraisal.com Page 11
  • 12. as of November 1, 2009 as of December 1, 2009 as of January 1, 2010 # Actives DOM Months Supply # Actives DOM Months Supply # Actives DOM Months Supply LaGrange Highlands - 528 $ 0 $ 299,999 5 228 8.57 4 226 6.00 4 315 6.86 $ 300,000 $ 499,999 9 89 13.50 8 129 13.71 7 171 14.00 $ 500,000 $ 999,999 3 73 No Sales 3 103 No Sales 3 110 36.00 $ 1,000,000 $ 1,999,999 0 0 0.00 0 0 0.00 0 0 0.00 $ 2,000,000 and up 0 0 0.00 0 0 0.00 0 0 0.00 ALL 17 127 13.60 15 150 12.00 14 199 12.00 LaGrange Park - 526 $ 0 $ 299,999 21 234 5.04 16 290 3.56 16 280 3.84 $ 300,000 $ 499,999 30 191 9.00 27 249 9.00 23 293 8.36 $ 500,000 $ 999,999 11 286 10.15 10 317 9.23 8 369 7.38 $ 1,000,000 $ 1,999,999 0 0 0.00 0 0 0.00 0 0 0.00 $ 2,000,000 and up 0 0 0.00 0 0 0.00 0 0 0.00 ALL 62 222 7.22 53 274 6.17 47 302 5.88 Lake Bluff - 44 $ 0 $ 299,999 6 98 14.40 6 103 10.29 7 103 12.00 $ 300,000 $ 499,999 29 253 11.60 25 274 10.71 24 260 9.29 $ 500,000 $ 999,999 44 328 24.00 40 314 20.87 36 360 18.78 $ 1,000,000 $ 1,999,999 24 197 24.00 22 216 20.31 20 244 17.14 $ 2,000,000 and up 8 608 No Sales 9 573 No Sales 9 604 No Sales ALL 111 288 19.30 102 294 17.24 96 315 15.36 Lake Forest - 45 $ 0 $ 499,999 32 168 11.64 35 181 12.35 34 229 11.33 $ 500,000 $ 999,999 116 238 17.62 97 268 14.55 86 293 12.90 $ 1,000,000 $ 1,999,999 106 321 30.29 97 352 24.25 89 374 23.73 $ 2,000,000 $ 2,999,999 39 263 58.50 34 290 40.80 30 311 36.00 $ 3,000,000 and up 53 424 48.92 50 444 60.00 47 482 56.40 ALL 346 288 23.73 313 315 20.64 286 344 18.96 Lake Villa, Lindenhurst - 46 $ 0 $ 299,999 151 224 8.05 143 217 7.94 136 228 7.42 $ 300,000 $ 499,999 68 252 10.88 64 247 11.13 62 263 10.78 $ 500,000 $ 999,999 17 312 102.00 13 410 78.00 11 477 66.00 $ 1,000,000 $ 1,999,999 2 43 No Sales 2 73 No Sales 1 65 No Sales $ 2,000,000 and up 0 0 0.00 0 0 0.00 0 0 0.00 ALL 238 237 9.46 222 236 9.28 210 250 8.66 Data Source: MRED LLC (C) Copyright 2010, A.L. Wagner Appraisal Group, Inc. Midwest Real Estate Data, LLC (630) 416-6556 www.WagnerAppraisal.com Page 12
  • 13. as of November 1, 2009 as of December 1, 2009 as of January 1, 2010 # Actives DOM Months Supply # Actives DOM Months Supply # Actives DOM Months Supply Lemont - 439 $ 0 $ 299,999 29 178 6.69 32 172 8.00 33 225 8.61 $ 300,000 $ 499,999 53 264 10.26 52 254 10.95 53 269 12.00 $ 500,000 $ 999,999 78 324 28.36 74 280 27.75 69 285 25.09 $ 1,000,000 $ 1,999,999 17 261 204.00 15 280 180.00 13 342 156.00 $ 2,000,000 and up 0 0 0.00 0 0 0.00 0 0 0.00 ALL 177 276 14.35 173 252 15.04 168 273 15.16 Libertyville, Green Oaks - 48 $ 0 $ 299,999 35 195 10.77 33 221 10.70 31 252 9.30 $ 300,000 $ 499,999 71 214 7.75 58 214 6.11 55 243 6.00 $ 500,000 $ 999,999 133 320 21.28 106 297 16.31 98 306 15.08 $ 1,000,000 $ 1,999,999 36 342 108.00 31 399 74.40 27 435 81.00 $ 2,000,000 and up 3 431 No Sales 3 461 No Sales 3 492 No Sales ALL 278 281 14.63 231 281 11.85 214 301 11.07 Lincolnshire - 69 $ 0 $ 299,999 1 214 2.00 2 152 4.00 1 91 1.71 $ 300,000 $ 499,999 18 211 9.82 19 225 9.50 20 243 10.00 $ 500,000 $ 999,999 45 161 16.36 39 184 13.37 39 196 13.37 $ 1,000,000 $ 1,999,999 20 326 120.00 18 303 72.00 17 297 68.00 $ 2,000,000 and up 1 560 No Sales 1 590 No Sales 1 621 No Sales ALL 85 216 16.19 79 225 13.94 78 234 13.57 Lincolnwood - 645 $ 0 $ 299,999 9 287 2.77 11 279 3.22 11 247 3.00 $ 300,000 $ 499,999 38 177 8.77 34 226 8.00 33 233 7.92 $ 500,000 $ 999,999 44 193 22.96 45 209 27.00 41 228 23.43 $ 1,000,000 $ 1,999,999 15 470 45.00 15 405 60.00 12 377 36.00 $ 2,000,000 and up 2 193 No Sales 2 223 No Sales 2 254 No Sales ALL 108 234 10.98 107 249 11.17 99 250 9.98 Lisle - 532 $ 0 $ 299,999 34 188 9.07 29 223 7.25 26 239 6.64 $ 300,000 $ 499,999 46 255 9.20 37 273 7.28 36 289 7.08 $ 500,000 $ 999,999 19 304 22.80 19 385 22.80 18 379 19.64 $ 1,000,000 $ 1,999,999 7 289 42.00 7 318 42.00 7 349 42.00 $ 2,000,000 and up 0 0 0.00 0 0 0.00 0 0 0.00 ALL 106 245 10.87 92 284 9.12 87 298 8.63 Data Source: MRED LLC (C) Copyright 2010, A.L. Wagner Appraisal Group, Inc. Midwest Real Estate Data, LLC (630) 416-6556 www.WagnerAppraisal.com Page 13
  • 14. as of November 1, 2009 as of December 1, 2009 as of January 1, 2010 # Actives DOM Months Supply # Actives DOM Months Supply # Actives DOM Months Supply Lockport,Homer Township - 495 $ 0 $ 299,999 181 246 11.68 161 263 10.44 151 260 9.79 $ 300,000 $ 499,999 80 232 24.62 71 206 20.29 71 208 23.03 $ 500,000 $ 999,999 5 247 20.00 5 277 30.00 6 262 36.00 $ 1,000,000 $ 1,999,999 1 106 No Sales 1 136 No Sales 1 167 No Sales $ 2,000,000 and up 1 941 No Sales 1 971 No Sales 1 1,002 No Sales ALL 268 244 14.11 239 249 12.52 230 247 12.32 Lombard - 148 $ 0 $ 299,999 131 201 6.29 124 215 6.00 112 210 5.44 $ 300,000 $ 499,999 60 188 13.85 54 184 14.09 49 212 13.07 $ 500,000 $ 999,999 33 393 24.75 31 428 26.57 26 432 22.29 $ 1,000,000 $ 1,999,999 0 0 0.00 0 0 0.00 0 0 0.00 $ 2,000,000 and up 0 0 0.00 0 0 0.00 0 0 0.00 ALL 224 226 8.45 209 238 8.14 187 242 7.33 Long Grove,Lake Zurich,Hawthorn Woods,Kildeer - 47 $ 0 $ 299,999 75 206 8.57 76 209 8.37 71 242 7.47 $ 300,000 $ 499,999 118 240 10.04 116 256 10.24 98 287 8.40 $ 500,000 $ 999,999 218 284 22.55 196 292 20.28 169 308 17.48 $ 1,000,000 $ 1,999,999 68 386 35.48 61 388 34.86 53 376 37.41 $ 2,000,000 and up 10 485 No Sales 8 494 No Sales 8 525 No Sales ALL 489 279 15.24 457 285 14.36 399 304 12.37 Medinah - 157 $ 0 $ 299,999 9 285 9.82 6 158 5.14 9 248 8.31 $ 300,000 $ 499,999 19 215 22.80 15 246 20.00 13 267 19.50 $ 500,000 $ 999,999 8 197 24.00 8 210 24.00 9 260 54.00 $ 1,000,000 $ 1,999,999 0 0 0.00 0 0 0.00 0 0 0.00 $ 2,000,000 and up 0 0 0.00 0 0 0.00 0 0 0.00 ALL 36 228 17.28 29 218 12.89 31 259 16.17 Minooka - 447 $ 0 $ 299,999 80 199 10.43 81 207 10.34 75 222 9.57 $ 300,000 $ 499,999 28 603 48.00 26 655 44.57 9 247 15.43 $ 500,000 $ 999,999 4 369 No Sales 4 399 No Sales 3 193 No Sales $ 1,000,000 $ 1,999,999 3 378 No Sales 3 408 No Sales 1 256 No Sales $ 2,000,000 and up 0 0 0.00 1 162 No Sales 1 193 No Sales ALL 115 308 13.94 115 320 13.66 89 224 10.57 Data Source: MRED LLC (C) Copyright 2010, A.L. Wagner Appraisal Group, Inc. Midwest Real Estate Data, LLC (630) 416-6556 www.WagnerAppraisal.com Page 14
  • 15. as of November 1, 2009 as of December 1, 2009 as of January 1, 2010 # Actives DOM Months Supply # Actives DOM Months Supply # Actives DOM Months Supply Mokena - 448 $ 0 $ 299,999 31 191 6.10 35 163 6.89 31 185 6.00 $ 300,000 $ 499,999 50 177 12.24 54 206 13.22 57 209 14.25 $ 500,000 $ 999,999 44 329 29.33 37 331 26.12 34 363 31.38 $ 1,000,000 $ 1,999,999 1 736 12.00 1 766 12.00 1 797 12.00 $ 2,000,000 and up 1 194 No Sales 1 224 No Sales 1 255 No Sales ALL 127 238 11.81 128 235 12.00 124 250 12.00 Montgomery - 538 $ 0 $ 299,999 171 182 6.62 163 199 6.15 144 204 5.47 $ 300,000 $ 499,999 8 190 96.00 6 261 No Sales 5 308 No Sales $ 500,000 $ 999,999 0 0 0.00 0 0 0.00 0 0 0.00 $ 1,000,000 $ 1,999,999 0 0 0.00 0 0 0.00 0 0 0.00 $ 2,000,000 and up 0 0 0.00 0 0 0.00 0 0 0.00 ALL 179 182 6.91 169 201 6.38 149 207 5.66 Morton Grove - 53 $ 0 $ 299,999 49 218 5.11 41 230 4.17 37 213 3.61 $ 300,000 $ 499,999 63 214 13.26 59 200 13.88 55 196 12.94 $ 500,000 $ 999,999 30 268 32.73 22 276 22.00 20 300 18.46 $ 1,000,000 $ 1,999,999 0 0 0.00 0 0 0.00 0 0 0.00 $ 2,000,000 and up 0 0 0.00 0 0 0.00 0 0 0.00 ALL 142 227 9.31 122 224 8.09 112 220 7.19 Mount Prospect - 56 $ 0 $ 299,999 65 230 4.59 56 236 3.93 63 231 4.40 $ 300,000 $ 499,999 137 195 12.27 130 212 12.28 115 232 10.95 $ 500,000 $ 999,999 16 307 13.71 12 332 11.08 11 384 11.00 $ 1,000,000 $ 1,999,999 2 345 No Sales 2 375 No Sales 1 184 No Sales $ 2,000,000 and up 1 19 No Sales 1 49 No Sales 1 80 No Sales ALL 221 214 8.34 201 227 7.76 191 240 7.39 Mundelein - 60 $ 0 $ 299,999 145 205 8.37 126 212 7.17 122 237 7.04 $ 300,000 $ 499,999 76 213 17.21 63 246 13.26 56 280 12.00 $ 500,000 $ 999,999 33 343 20.84 30 348 20.00 27 347 18.00 $ 1,000,000 $ 1,999,999 9 429 108.00 10 377 120.00 10 408 120.00 $ 2,000,000 and up 1 21 No Sales 1 51 No Sales 1 82 No Sales ALL 264 231 11.27 230 246 9.62 216 269 9.16 Data Source: MRED LLC (C) Copyright 2010, A.L. Wagner Appraisal Group, Inc. Midwest Real Estate Data, LLC (630) 416-6556 www.WagnerAppraisal.com Page 15
  • 16. as of November 1, 2009 as of December 1, 2009 as of January 1, 2010 # Actives DOM Months Supply # Actives DOM Months Supply # Actives DOM Months Supply Naperville - 540 $ 0 $ 299,999 112 204 4.87 104 205 4.33 101 220 4.19 $ 300,000 $ 499,999 328 191 6.22 285 214 5.46 242 243 4.73 $ 500,000 $ 999,999 292 258 12.79 239 268 10.62 230 284 10.53 $ 1,000,000 $ 1,999,999 114 492 33.37 98 494 24.00 81 552 20.25 $ 2,000,000 and up 22 505 264.00 20 482 240.00 19 513 228.00 ALL 868 263 8.50 746 274 7.25 673 298 6.65 New Lenox - 451 $ 0 $ 299,999 95 203 9.12 91 230 8.81 73 239 6.79 $ 300,000 $ 499,999 81 253 14.29 70 280 12.35 66 298 11.48 $ 500,000 $ 999,999 25 279 300.00 21 300 252.00 20 321 240.00 $ 1,000,000 $ 1,999,999 1 132 12.00 1 162 12.00 1 193 No Sales $ 2,000,000 and up 2 233 24.00 2 263 24.00 2 294 24.00 ALL 204 232 12.49 185 257 11.38 162 273 9.72 Niles - 648 $ 0 $ 299,999 45 244 5.00 39 261 4.22 37 283 4.00 $ 300,000 $ 499,999 68 230 17.00 58 221 14.20 44 228 11.00 $ 500,000 $ 999,999 22 313 16.50 24 316 19.20 20 357 16.00 $ 1,000,000 $ 1,999,999 0 0 0.00 0 0 0.00 0 0 0.00 $ 2,000,000 and up 0 0 0.00 0 0 0.00 0 0 0.00 ALL 135 248 9.36 121 253 8.25 101 274 6.93 North Aurora - 542 $ 0 $ 299,999 77 199 10.38 69 191 8.63 65 192 8.21 $ 300,000 $ 499,999 44 288 17.03 40 253 18.46 30 271 12.41 $ 500,000 $ 999,999 0 0 0.00 2 104 No Sales 3 388 No Sales $ 1,000,000 $ 1,999,999 0 0 0.00 0 0 0.00 0 0 0.00 $ 2,000,000 and up 0 0 0.00 0 0 0.00 0 0 0.00 ALL 121 231 12.10 111 212 10.92 98 222 9.48 Northbrook - 62 $ 0 $ 299,999 33 290 8.61 36 278 8.64 32 324 6.98 $ 300,000 $ 499,999 75 266 8.65 77 278 9.24 77 285 9.53 $ 500,000 $ 999,999 121 242 11.52 104 266 9.98 81 316 7.53 $ 1,000,000 $ 1,999,999 42 302 21.00 38 322 20.73 32 332 17.45 $ 2,000,000 and up 13 323 52.00 14 321 56.00 13 367 52.00 ALL 284 267 11.25 269 282 10.76 235 312 9.22 Data Source: MRED LLC (C) Copyright 2010, A.L. Wagner Appraisal Group, Inc. Midwest Real Estate Data, LLC (630) 416-6556 www.WagnerAppraisal.com Page 16
  • 17. as of November 1, 2009 as of December 1, 2009 as of January 1, 2010 # Actives DOM Months Supply # Actives DOM Months Supply # Actives DOM Months Supply Northfield - 7193 $ 0 $ 299,999 5 243 30.00 4 274 24.00 3 359 18.00 $ 300,000 $ 499,999 15 346 15.00 16 343 17.45 17 353 15.69 $ 500,000 $ 999,999 36 322 28.80 29 346 17.40 23 370 14.53 $ 1,000,000 $ 1,999,999 13 237 17.33 10 247 13.33 9 294 12.00 $ 2,000,000 and up 5 203 20.00 4 175 16.00 5 171 30.00 ALL 74 298 21.66 63 314 16.80 57 335 15.20 Northlake - 164 $ 0 $ 299,999 64 218 7.60 64 208 7.53 59 207 6.62 $ 300,000 $ 499,999 5 465 20.00 5 495 30.00 4 459 16.00 $ 500,000 $ 999,999 0 0 0.00 0 0 0.00 0 0 0.00 $ 1,000,000 $ 1,999,999 0 0 0.00 0 0 0.00 0 0 0.00 $ 2,000,000 and up 0 0 0.00 0 0 0.00 0 0 0.00 ALL 69 236 7.96 69 229 7.96 63 223 6.87 Oak Brook - 523 $ 0 $ 499,999 2 134 8.00 2 164 6.00 1 106 2.40 $ 500,000 $ 999,999 45 228 24.55 45 272 27.00 36 257 18.00 $ 1,000,000 $ 1,999,999 36 260 22.74 32 251 20.21 32 220 20.21 $ 2,000,000 $ 2,999,999 23 509 69.00 18 551 54.00 16 511 64.00 $ 3,000,000 and up 14 404 84.00 11 463 44.00 11 494 44.00 ALL 120 310 28.80 108 330 25.92 96 313 21.33 Oak Brook Terrace - 181 $ 0 $ 299,999 5 244 10.00 5 274 10.00 6 255 12.00 $ 300,000 $ 499,999 0 0 0.00 0 0 0.00 0 0 0.00 $ 500,000 $ 999,999 4 278 48.00 4 308 48.00 3 214 36.00 $ 1,000,000 $ 1,999,999 1 26 No Sales 1 56 No Sales 1 87 No Sales $ 2,000,000 and up 0 0 0.00 0 0 0.00 0 0 0.00 ALL 10 236 12.00 10 266 12.00 10 226 12.00 Oak Lawn - 453 $ 0 $ 299,999 174 208 6.42 156 203 5.71 140 215 4.96 $ 300,000 $ 499,999 57 268 31.09 42 286 22.91 42 268 25.20 $ 500,000 $ 999,999 5 262 No Sales 5 292 No Sales 2 190 No Sales $ 1,000,000 $ 1,999,999 0 0 0.00 0 0 0.00 0 0 0.00 $ 2,000,000 and up 0 0 0.00 0 0 0.00 0 0 0.00 ALL 236 224 8.16 203 222 6.96 184 227 6.15 Data Source: MRED LLC (C) Copyright 2010, A.L. Wagner Appraisal Group, Inc. Midwest Real Estate Data, LLC (630) 416-6556 www.WagnerAppraisal.com Page 17
  • 18. as of November 1, 2009 as of December 1, 2009 as of January 1, 2010 # Actives DOM Months Supply # Actives DOM Months Supply # Actives DOM Months Supply Oak Park - 302 $ 0 $ 299,999 30 217 3.71 26 225 2.97 31 190 3.65 $ 300,000 $ 499,999 92 182 6.20 80 188 5.25 61 221 4.00 $ 500,000 $ 999,999 59 186 8.23 54 195 8.10 40 162 6.23 $ 1,000,000 $ 1,999,999 9 150 27.00 6 204 18.00 6 235 18.00 $ 2,000,000 and up 1 257 No Sales 1 287 No Sales 1 318 No Sales ALL 191 188 6.28 167 197 5.39 139 198 4.56 Olympia Fields - 461 $ 0 $ 299,999 34 195 6.38 32 252 6.10 32 264 6.40 $ 300,000 $ 499,999 23 417 34.50 25 415 50.00 24 456 72.00 $ 500,000 $ 999,999 4 400 No Sales 4 430 No Sales 4 461 No Sales $ 1,000,000 $ 1,999,999 0 0 0.00 0 0 0.00 0 0 0.00 $ 2,000,000 and up 0 0 0.00 0 0 0.00 0 0 0.00 ALL 61 292 10.17 61 330 10.61 60 354 11.25 Orland Park - 462 $ 0 $ 299,999 60 220 4.24 62 224 4.43 51 243 3.52 $ 300,000 $ 499,999 105 191 11.56 88 207 10.06 76 233 9.12 $ 500,000 $ 999,999 74 291 19.30 66 294 18.42 59 294 17.27 $ 1,000,000 $ 1,999,999 11 319 33.00 6 365 18.00 5 256 12.00 $ 2,000,000 and up 3 65 36.00 4 130 No Sales 4 161 No Sales ALL 253 231 9.20 226 240 8.48 195 253 7.31 Oswego - 543 $ 0 $ 299,999 141 284 6.11 138 294 5.94 117 326 4.89 $ 300,000 $ 499,999 75 304 12.00 64 308 10.24 57 305 9.37 $ 500,000 $ 999,999 15 371 90.00 13 384 156.00 12 433 144.00 $ 1,000,000 $ 1,999,999 4 288 48.00 4 161 24.00 4 192 24.00 $ 2,000,000 and up 1 123 No Sales 1 153 No Sales 1 184 No Sales ALL 236 295 7.98 220 301 7.39 191 323 6.31 Palatine - 67 $ 0 $ 299,999 69 219 5.83 63 229 5.01 69 248 5.52 $ 300,000 $ 499,999 101 226 10.82 91 238 9.84 82 219 8.41 $ 500,000 $ 999,999 113 277 19.10 109 296 18.17 92 330 15.12 $ 1,000,000 $ 1,999,999 3 218 36.00 3 248 36.00 3 279 36.00 $ 2,000,000 and up 0 0 0.00 0 0 0.00 0 0 0.00 ALL 286 244 10.53 266 260 9.53 246 269 8.66 Data Source: MRED LLC (C) Copyright 2010, A.L. Wagner Appraisal Group, Inc. Midwest Real Estate Data, LLC (630) 416-6556 www.WagnerAppraisal.com Page 18
  • 19. as of November 1, 2009 as of December 1, 2009 as of January 1, 2010 # Actives DOM Months Supply # Actives DOM Months Supply # Actives DOM Months Supply Palos Heights - 463 $ 0 $ 299,999 31 220 8.65 28 232 8.00 22 247 6.29 $ 300,000 $ 499,999 29 122 16.57 29 145 16.57 22 188 13.20 $ 500,000 $ 999,999 23 263 34.50 17 308 22.67 13 239 19.50 $ 1,000,000 $ 1,999,999 4 219 No Sales 3 169 No Sales 0 0 0.00 $ 2,000,000 and up 0 0 0.00 0 0 0.00 0 0 0.00 ALL 87 198 14.50 77 213 12.83 57 222 9.77 Palos Hills - 465 $ 0 $ 299,999 30 220 6.55 28 192 6.72 23 245 5.31 $ 300,000 $ 499,999 13 219 14.18 11 255 12.00 10 232 10.91 $ 500,000 $ 999,999 2 251 No Sales 2 281 No Sales 0 0 0.00 $ 1,000,000 $ 1,999,999 0 0 0.00 0 0 0.00 0 0 0.00 $ 2,000,000 and up 0 0 0.00 0 0 0.00 0 0 0.00 ALL 45 221 8.18 41 213 8.07 33 241 6.29 Palos Park - 464 $ 0 $ 299,999 6 448 5.54 4 467 3.20 4 405 2.82 $ 300,000 $ 499,999 33 245 18.00 25 257 12.50 23 230 11.50 $ 500,000 $ 999,999 29 234 49.71 29 279 58.00 21 300 42.00 $ 1,000,000 $ 1,999,999 8 402 96.00 7 461 84.00 6 508 No Sales $ 2,000,000 and up 5 356 30.00 5 386 30.00 4 502 24.00 ALL 81 278 21.60 70 308 17.50 58 315 14.20 Park Ridge - 68 $ 0 $ 299,999 30 191 4.39 35 217 5.06 29 218 3.70 $ 300,000 $ 499,999 116 270 11.32 100 298 9.60 93 309 8.52 $ 500,000 $ 999,999 127 238 17.12 106 233 13.98 91 262 12.13 $ 1,000,000 $ 1,999,999 38 282 45.60 31 261 37.20 25 302 37.50 $ 2,000,000 and up 2 402 No Sales 2 210 No Sales 2 241 No Sales ALL 313 252 12.36 274 258 10.64 240 279 8.92 Plainfield - 544 $ 0 $ 299,999 440 202 6.37 410 205 5.87 385 214 5.63 $ 300,000 $ 499,999 199 279 11.16 183 284 10.61 177 284 10.46 $ 500,000 $ 999,999 68 342 48.00 55 376 55.00 52 385 44.57 $ 1,000,000 $ 1,999,999 1 148 No Sales 0 0 0.00 0 0 0.00 $ 2,000,000 and up 0 0 0.00 0 0 0.00 0 0 0.00 ALL 708 237 8.02 648 242 7.36 614 248 7.10 Data Source: MRED LLC (C) Copyright 2010, A.L. Wagner Appraisal Group, Inc. Midwest Real Estate Data, LLC (630) 416-6556 www.WagnerAppraisal.com Page 19
  • 20. as of November 1, 2009 as of December 1, 2009 as of January 1, 2010 # Actives DOM Months Supply # Actives DOM Months Supply # Actives DOM Months Supply Prospect Heights - 70 $ 0 $ 299,999 5 103 2.73 6 144 3.27 6 175 3.43 $ 300,000 $ 499,999 23 291 14.53 22 239 16.50 17 286 11.33 $ 500,000 $ 999,999 22 234 22.00 21 221 21.00 18 228 19.64 $ 1,000,000 $ 1,999,999 2 365 No Sales 2 395 No Sales 2 426 No Sales $ 2,000,000 and up 0 0 0.00 0 0 0.00 0 0 0.00 ALL 52 252 11.77 51 226 12.24 43 253 10.32 River Forest - 305 $ 0 $ 299,999 2 314 24.00 1 189 6.00 0 0 0.00 $ 300,000 $ 499,999 11 241 6.95 11 272 7.33 8 252 5.05 $ 500,000 $ 999,999 44 228 12.00 34 243 9.07 25 281 6.38 $ 1,000,000 $ 1,999,999 16 397 14.77 16 306 21.33 12 358 14.40 $ 2,000,000 and up 3 286 18.00 4 241 48.00 2 89 24.00 ALL 76 270 11.54 66 262 10.56 47 287 7.14 Riverside - 546 $ 0 $ 299,999 17 223 15.69 16 248 12.00 17 264 12.75 $ 300,000 $ 499,999 41 327 14.06 41 332 14.47 35 372 12.35 $ 500,000 $ 999,999 31 285 31.00 30 299 25.71 23 300 21.23 $ 1,000,000 $ 1,999,999 4 447 48.00 3 540 36.00 4 433 48.00 $ 2,000,000 and up 1 983 No Sales 1 1,013 No Sales 1 1,044 No Sales ALL 94 306 18.49 91 321 16.80 80 340 15.00 Riverwoods - 7215 $ 0 $ 299,999 2 71 24.00 1 168 6.00 1 199 6.00 $ 300,000 $ 499,999 9 331 13.50 7 341 9.33 6 288 7.20 $ 500,000 $ 999,999 38 243 30.40 30 251 22.50 33 298 23.29 $ 1,000,000 $ 1,999,999 16 365 48.00 10 454 24.00 9 508 21.60 $ 2,000,000 and up 5 403 20.00 4 412 16.00 2 627 8.00 ALL 70 289 27.10 52 313 17.83 51 345 16.54 Rolling Meadows - 8 $ 0 $ 299,999 48 165 5.94 50 178 6.32 46 218 5.81 $ 300,000 $ 499,999 19 166 9.91 20 160 10.43 14 194 7.00 $ 500,000 $ 999,999 6 214 18.00 4 246 12.00 4 277 12.00 $ 1,000,000 $ 1,999,999 0 0 0.00 0 0 0.00 0 0 0.00 $ 2,000,000 and up 0 0 0.00 0 0 0.00 0 0 0.00 ALL 73 169 7.06 74 176 7.28 64 217 6.24 Data Source: MRED LLC (C) Copyright 2010, A.L. Wagner Appraisal Group, Inc. Midwest Real Estate Data, LLC (630) 416-6556 www.WagnerAppraisal.com Page 20