
Recommandé
Contenu connexe
Tendances
Tendances (19)
En vedette
En vedette (20)
Similaire à Lesson 1 7 (3)
Similaire à Lesson 1 7 (3) (20)
Plus de chrismac47
Plus de chrismac47 (20)
Dernier
Dernier (20)
Lesson 1 7 (3)
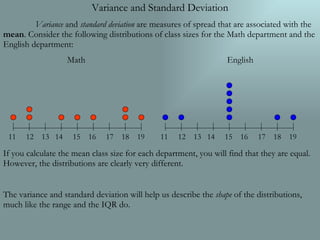
- 1. Variance and Standard Deviation Variance and standard deviation are measures of spread that are associated with the mean . Consider the following distributions of class sizes for the Math department and the English department: Math English If you calculate the mean class size for each department, you will find that they are equal. However, the distributions are clearly very different. The variance and standard deviation will help us describe the shape of the distributions, much like the range and the IQR do. 11 12 13 14 15 16 17 18 19 11 12 13 14 15 16 17 18 19
- 2. To calculate the variance and standard deviation, we must first calculate the deviation for each element of the data set. The deviation is simply the difference between the value and mean of the data set. I’ve completed the calculations of the deviations for the Math department below. Its your job to do the same for the English department. 16 4 19 70 Total: 9 3 18 9 3 18 1 1 16 0 0 15 1 -1 14 9 -3 12 9 -3 12 16 -4 11 Square of the Deviation Deviation Value 19 Total: 18 15 15 15 15 15 12 11 Square of the Deviation Deviation Value
- 3. So far, we’ve calculated the deviation of each value from the mean, squared those deviations, and summed the squares of the deviations. To find the variance, s 2 , all that is left is to divide this sum by ( n -1), or one less than the total number of values in the data (15 for our example): Math English The standard deviation, s, is simply the square root of the variance: Math English
- 4. Remember that the calculation of the mean can be summarized using sigma notation: This gives the following formulas for variance and standard deviation:
- 5. Calculate the variance and standard deviation for the following test scores: 93 88 91 82 85 72 95 73 88 A chart like the one below will likely be useful: Total: ( x i - x ) 2 x i - x x i