Business at a glance... March 2023
•
0 likes•6 views

Industrial price index Spain Business t urnover i ndex Spain Spain CPI Advance Economic sentiment in the Eurozone Loans to non-financial corporations Eurozone International Intellectual Property Index 2022

Recommended
More Related Content
Similar to Business at a glance... March 2023
Similar to Business at a glance... March 2023 (20)
More from Círculo de Empresarios
More from Círculo de Empresarios (20)
Recently uploaded
Recently uploaded (20)
Business at a glance... March 2023
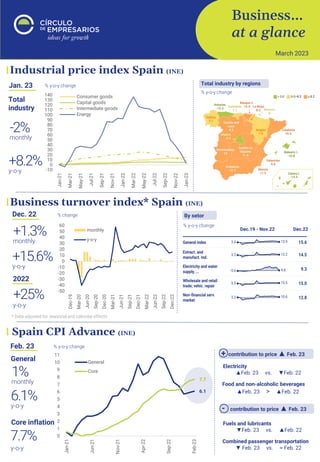
- 1. Business… at a glance March 2023 % y-o-y change By setor Industrial price index Spain (INE) Jan. 23 monthly -2% y-o-y +8.2% % y-o-y change % y-o-y change Total industry by regions Business turnover index* Spain (INE) Dec. 22 monthly +1.3% y-o-y +15.6% * Data adjusted for seasonal and calendar effects 2022 y-o-y +25% % change Dec.19 - Nov.22 Dec.22 Spain CPI Advance (INE) Feb. 23 % y-o-y change monthly 1% y-o-y 6.1% General y-o-y 7.7% Core inflation Electricity ▲Feb. 23 vs. ▼Feb. 22 Food and non-alcoholic beverages ▲Feb. 23 > ▲Feb. 22 Fuels and lubricants ▼Feb. 23 vs. ▲Feb. 22 Combined passenger transportation ▼ Feb. 23 vs. ≈ Feb. 22 + contribution to price ▲ Feb. 23 Total industry -10 0 10 20 30 40 50 60 70 80 90 100 110 120 130 140 Jan-21 Mar-21 May-21 Jul-21 Sep-21 Nov-21 Jan-22 Mar-22 May-22 Jul-22 Sep-22 Nov-22 Jan-23 Consumer goods Capital goods Intermediate goods Energy -50 -40 -30 -20 -10 0 10 20 30 40 50 60 Dec-19 Mar-20 Jun-20 Sep-20 Dec-20 Mar-21 Jun-21 Sep-21 Dec-21 Mar-22 Jun-22 Sep-22 Dec-22 monthly y-o-y 6.1 7.7 0 1 2 3 4 5 6 7 8 9 10 11 Jan-21 Jun-21 Nov-21 Apr-22 Sep-22 Feb-23 General Core - contribution to price ▲ Feb. 23
- 2. Business… at a glance. a publication of the “Círculo de Empresarios” produced by its Department of Economy. contains information and opinion from reliable sources. However. the “Círculo de Empresarios” does not guarantee its accuracy and does not take responsibility for any errors or omissions. This document is merely informative. As a result. the “Círculo de Empresarios” is not responsible for any uses that may be made of the publication. The opinions and estimates of the Department can be modified without prior warning. Economic sentiment in the Eurozone (European Commission) Feb. 23 Loans to non-financial corporations Eurozone (ECB) Jan. 23 International Intellectual Property Index 2022 (US Chamber) 2022 y-o-y 6.1% r/ Jan. 22 +1.6pp % y-o-y change monthly 0% * The indicators included in the index define the optimal ecosystem for the protection and enforcement of intellectual property rights 5.14 tr€ % of total and % y-o-y change Loans to non-financial corporations by maturity r/ Jan.23 -0.1p 99.7p r/ min. Apr.20 +39.8p r/ max. Oct.21 -19p Slowdown in recovery due to lower confidence in industry and services compared to Jan.23 99.7 50 60 70 80 90 100 110 120 Feb-20 Apr-20 Jun-20 Aug-20 Oct-20 Dec-20 Feb-21 Apr-21 Jun-21 Aug-21 Oct-21 Dec-21 Feb-22 Apr-22 Jun-22 Aug-22 Oct-22 Dec-22 Feb-23 Points Industry Services Consumer Retail trade Construction Jan.23 Feb.23 Points By countries Points * Ireland: data Jan.23 Top 10 (of 55 countries) 1 2 3 4 5 6 7 8 9 10 55.72% Global average 6,1 3,6 4,9 1 3 5 7 9 Jan-23 Nov-22 Sep-22 Jul-22 May-22 Mar-22 Jan-22 Nov-21 Sep-21 Jul-21 May-21 Mar-21 Jan-21 Nov-20 Sep-20 Jul-20 May-20 Mar-20 Jan-20 Non-financial corporations Households Non-financial private sector 18.6% +8% 21.1% +8.6% 60.3% +3.6% Up to 1 year More than 1 and up to 5 years More than 5 years 95.5% 94.1% 92.5% 92.1% 92.1% 91.3% 90.7% 88.8% 86.0% 85.9% US UK Germany Sweden France Japan Netherlands Ireland Switzerland Spain