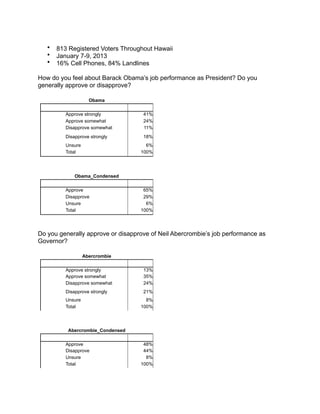
1. • 813 Registered Voters Throughout Hawaii
• January 7-9, 2013
• 16% Cell Phones, 84% Landlines
How do you feel about Barack Obama’s job performance as President? Do you
generally approve or disapprove?
Obama
Approve strongly 41%
Approve somewhat 24%
Disapprove somewhat 11%
Disapprove strongly 18%
Unsure 6%
Total 100%
Obama_Condensed
Approve 65%
Disapprove 29%
Unsure 6%
Total 100%
Do you generally approve or disapprove of Neil Abercrombie’s job performance as
Governor?
Abercrombie
Approve strongly 13%
Approve somewhat 35%
Disapprove somewhat 24%
Disapprove strongly 21%
Unsure 8%
Total 100%
Abercrombie_Condensed
Approve 48%
Disapprove 44%
Unsure 8%
Total 100%
2. Last month, Governor Abercrombie appointed Lieutenant Governor Brian Schatz to fill
the Senate seat that was left open when Senator Inouye passed away. Do you generally
approve or disapprove of that decision?
Schatz
Approve 36%
Disapprove 45%
Unsure 19%
Total 100%
According to state regulations, Governor Abercrombie was able to choose between
three people to fill Senator Inouye’s seat—Brian Schatz; Congresswoman Colleen
Hanabusa; and former Office of Hawaiian Affairs official, Esther Kia’aina. If the choice
had been up to you, who would you have picked?
SenateChoices
Schatz 36%
Hanabusa 36%
Kaiaina 7%
Unsure 22%
Total 100%
Before Senator Inouye passed away, he wrote a private letter to Governor Abercrombie
asking the Governor to appoint Colleen Hanabusa to fill his Senate seat. After Inouye’s
death, someone on his staff released that letter publicly, to put pressure Abercrombie to
appoint Hanabusa. What do you think of the Inouye staff member’s decision to release
that letter?
InouyeLetter
Approve 45%
Disapprove 33%
Unsure 22%
Total 100%
3. Demographics
Gender
Male 46%
Female 54%
Total 100%
Age_Group
18-29 6%
30-39 9%
40-49 14%
50-64 32%
65+ 39%
Total 100%
Race_Ethncity
Caucasian 32%
Japanese 20%
Filipino 14%
Hawaiian 8%
Chinese 10%
Hispanic/Latino 1%
Other/Mixed 15%
Total 100%
PhoneType
Both 80%
Cell Only 11%
Landline Only 9%
Total 100%
4. Politics
Liberal/Progressive 26%
Moderate 32%
Conservative 24%
Unsure 18%
Total 100%
Party_ID
Democrat 47%
Republican 19%
Independent 30%
Unsure 5%
Total 100%
Education
No degree 3%
High School Degree 29%
College Degree 42%
Graduate Degree 27%
Total 100%
Relationship
Married 55%
Partner 4%
Single 18%
Div/Sep 10%
Widowed 13%
Total 100%
5. Military_Family
Yes 17%
No 83%
Total 100%
Union_Household
Yes 30%
No 70%
Total 100%
Income
$50,000 or Less 38%
$50,000-$100,000 37%
$100,000 or More 25%
Total 100%
Voted2008
No 10%
Yes 90%
Total 100%
Voted2010
No 13%
Yes 87%
Total 100%