SlideShare a Scribd company logo
1 of 41
Download to read offline
TOPLINES:
                                        Governor’s race, Issues, and Demographics
                                               Margin of Error = +/- 2.9%

                    Governor

                        Frequency     Percent

Valid   Abercrombie             543       47.2

        Aiona                   510       44.3

        Undecided                98         8.5

        Total                  1151      100.0
Gov_Issue

                                      Frequency    Percent

Valid   Stronger Leader                      666       57.9

        Civil unions/Social Issues           186       16.2

        Economy/Jobs                         133       11.6

        Education                             84         7.3

        Energy/Environment                    34         3.0

        Unsure                                48         4.2

        Total                               1151      100.0


                                                               2
Obama

                                        Frequency      Percent

Valid   Approve strongly                       453         39.4

        Approve somewhat                       260         22.6

        Disapprove somewhat                    111           9.6

        Disapprove strongly                    275         23.9

        Unsure                                    52         4.5

        Total                                 1151        100.0


                Obama_Condensed

                           Frequency    Percent

Valid   Approve                   713        61.9

        Disapprove                386        33.5

        Unsure                     52         4.5

        Total                    1151       100.0


                                                                   3
Religion_in_Govt

                                   Frequency     Percent

Valid   No religion                        491       42.7

        Unofficial religion                432       37.5

        Official religion                   63         5.5

        Christianity                       121       10.5

        Unsure                              44         3.8

        Total                             1151      100.0


                                                             4
Board_Ed

                                   Frequency    Percent

Valid   For                               624       54.2

        Against                           410       35.6

        Not voting on Amendment            39         3.4

        Unsure                             78         6.8

        Total                            1151      100.0


                                                            5
Gov_Primary

                              Frequency       Percent    Valid Percent

Valid   Hannemann                       314      27.3              28.1

        Abercrombie                     490      42.6              43.8

        Didn't vote/Other               277      24.1              24.8

        Don't remember                   38        3.3              3.4

        Total                          1119      97.2             100.0

        Not Reported                     32        2.8

Total                                  1151     100.0


                                                                          6
Gender

                             Frequency      Percent     Valid Percent

Valid         female                666         57.9              61.3

              male                  420         36.5              38.7

              Total                1086         94.4             100.0

              Not Reported             65         5.6

Grand Total                        1151        100.0


                                                                         7
Race

                                  Frequency    Percent    Valid Percent

Valid         White                      454       39.4            42.3

              Asian                      392       34.1            36.5

              Pacific Islander           106        9.2             9.9

              Hispanic                     9         .8              .8

              African American             7         .6              .7

              Two or more                105        9.1             9.8

              Total                     1073       93.2           100.0

              Not Reported                78        6.8

Grand Total                             1151      100.0


                                                                          8
Religion

                                Frequency        Percent     Valid Percent

Valid         Catholic                     244       21.2              23.0

              Evangelical                  155       13.5              14.6

              Mormon                        34         3.0              3.2

              Other Christian              263       22.8              24.8

              Buddhist                     116       10.1              10.9

              Jewish                        13         1.1              1.2

              Other                         69         6.0              6.5

              None                         167       14.5              15.7

              Total                    1061          92.2             100.0

              Not Reported                  90         7.8

Grand Total                            1151         100.0


                                                                              9
Party

                                 Frequency        Percent       Valid Percent

Valid         Democrat                     506           44.0              48.1

              Republican                   211           18.3              20.0

              Independent                  265           23.0              25.2

              Unsure                        71            6.2               6.7

              Total                      1053            91.5             100.0

              Not Reported                  98            8.5

Grand Total                              1151        100.0


                              TeaParty

                             Frequency     Percent        Valid Percent

Valid         No                   796            69.2              76.3

              Yes                  119            10.3              11.4

              Unsure               128            11.1              12.3

              Total               1043            90.6             100.0

              Not Reported         108             9.4

Grand Total                       1151           100.0


                                                                                  10
Politics

                             Frequency    Percent    Valid Percent

Valid         Liberal               240       20.9             23.3

              Moderate              358       31.1             34.8

              Conservative          295       25.6             28.6

              Unsure                137       11.9             13.3

              Total                1030       89.5            100.0

              Not Reported          121       10.5

Grand Total                        1151      100.0


                                                                      11
Age

                             Frequency       Percent        Valid Percent

Valid         18-24                      9             .8               .9

              25-34                   15           1.3                 1.5

              35-49                  102           8.9                10.0

              50-64                  366         31.8                 35.7

              65+                    533         46.3                 52.0

              Total                1025          89.1                100.0

              Not Reported           126         10.9

Grand Total                        1151         100.0


                                                                             12
TOPLINES: 1st District Congressional Race
                                         Margin of Error = +/- 4.0%

                      Congress

                            Frequency    Percent

Valid   Djou                       269             44.2

        Hanabusa                   299             49.1

        Neither/Undecided           41              6.7

        Total                      609        100.0


                                                                               13
Cong_Issue

                                       Frequency    Percent

Valid   Civil unions/Social Issues            142             23.4

        Cultural background                    56              9.2

        Economy/Jobs                          238             39.3

        Energy/Environment                     21              3.5

        Government Power                      100             16.5

        Unsure                                 49              8.1

        Total                                 606        100.0


                                                                     14
CROSSTABS—Governor


        Gov_Strength * Governor Crosstabulation

% within Governor

                                     Governor

                              Abercrombie       Aiona

Gov_Strength

                Definite             86.4%        88.2%

                b.Probably            9.2%         5.7%

                Leaning               4.4%         6.1%

Total                               100.0%        100.0%


                                                                             15
Gov_Issue * Governor Crosstabulation

% within Governor

                                                                Governor

                                              Abercrombie             Aiona     Undecided         Total

Gov_Issue    Stronger Leader                           67.0%            52.5%         34.7%         57.9%

             Civil unions/Social Issues                14.5%            20.0%            5.1%       16.2%

             Economy/Jobs                               5.9%            15.9%         20.4%         11.6%

             Education                                  6.4%             5.9%         19.4%           7.3%

             Energy/Environment                         2.9%             2.4%            6.1%         3.0%

             Unsure                                     3.1%             3.3%         14.3%           4.2%

Total                                                 100.0%           100.0%       100.0%         100.0%


                                                  Governor * Gov_Issue Crosstabulation

% within Gov_Issue

                                                                              Gov_Issue

                                                      Civil
                                                  unions/Social                                          Energy/Environm
                            Stronger Leader          Issues            Economy/Jobs       Education            ent           Unsure    Total

Governor    Abercrombie                   54.7%               42.5%             24.1%           41.7%                47.1%     35.4%     47.2%

            Aiona                         40.2%               54.8%             60.9%           35.7%                35.3%     35.4%     44.3%

            Undecided                     5.1%                2.7%              15.0%           22.6%                17.6%     29.2%      8.5%

Total                                 100.0%             100.0%                 100.0%          100.0%           100.0%       100.0%   100.0%
                                                                                                                                                 16
Obama * Governor Crosstabulation

% within Governor

                                                      Governor

                                       Abercrombie      Aiona     Undecided    Total

Obama     Approve strongly                    65.6%       11.2%        40.8%     39.4%

          Approve somewhat                    26.7%       16.7%        30.6%     22.6%

          Disapprove somewhat                  2.0%       18.0%         8.2%      9.6%

          Disapprove strongly                  1.7%       51.2%         5.1%     23.9%

          Unsure                               4.1%        2.9%        15.3%      4.5%

Total                                        100.0%      100.0%       100.0%    100.0%


                     Obama_Condensed * Governor Crosstabulation

% within Governor

                                                      Governor

                                       Abercrombie      Aiona     Undecided    Total

Obama_Condensed        Approve                92.3%       27.8%        71.4%     61.9%

                       Disapprove              3.7%       69.2%        13.3%     33.5%

                       Unsure                  4.1%        2.9%        15.3%      4.5%

Total                                        100.0%      100.0%       100.0%   100.0%

                                                                                         17
Governor * Obama Crosstabulation

% within Obama

                                                                  Obama

                                               Approve            Disapprove        Disapprove
                           Approve strongly    somewhat            somewhat          strongly      Unsure     Total

Governor   Abercrombie               78.6%              55.8%               9.9%            3.3%      42.3%     47.2%

           Aiona                     12.6%              32.7%             82.9%            94.9%      28.8%     44.3%

           Undecided                   8.8%             11.5%               7.2%            1.8%      28.8%      8.5%

Total                               100.0%             100.0%           100.0%            100.0%     100.0%   100.0%


                 Governor * Obama_Condensed Crosstabulation

% within Obama_Condensed

                                       Obama_Condensed

                             Approve      Disapprove      Unsure          Total

Governor   Abercrombie           70.3%           5.2%           42.3%       47.2%

           Aiona                 19.9%          91.5%           28.8%       44.3%

           Undecided              9.8%           3.4%           28.8%        8.5%

Total                           100.0%         100.0%       100.0%         100.0%


                                                                                                                        18
Religion_in_Govt * Governor Crosstabulation

% within Governor

                                                                    Governor

                                                   Abercrombie           Aiona       Undecided          Total

Religion_in_Govt    No religion                             62.8%          22.4%             36.7%        42.7%

                    Unofficial religion                     26.5%          50.2%             32.7%        37.5%

                    Official religion                        5.0%           5.1%             10.2%         5.5%

                    Christianity                             2.4%          19.4%              9.2%        10.5%

                    Unsure                                   3.3%           2.9%             11.2%         3.8%

Total                                                     100.0%          100.0%             100.0%      100.0%


                                          Governor * Religion_in_Govt Crosstabulation

% within Religion_in_Govt

                                                                    Religion_in_Govt

                                   No religion     Unofficial religion   Official religion      Christianity      Unsure     Total

Governor    Abercrombie                   69.5%                33.3%                42.9%               10.7%        40.9%     47.2%

            Aiona                         23.2%                59.3%                41.3%               81.8%        34.1%     44.3%

            Undecided                       7.3%                7.4%                15.9%                7.4%        25.0%      8.5%

Total                                     100.0%             100.0%                100.0%             100.0%        100.0%   100.0%


                                                                                                                                       19
Board_Ed * Governor Crosstabulation

% within Governor

                                                           Governor

                                         Abercrombie         Aiona      Undecided    Total

Board_Ed     For                                  49.2%        61.8%         42.9%     54.2%

             Against                              40.5%        30.4%         35.7%     35.6%

             Not voting on Amendment               2.8%         3.1%          8.2%      3.4%

             Unsure                                7.6%         4.7%         13.3%      6.8%

Total                                             100.0%      100.0%        100.0%    100.0%


                           Governor * Board_Ed Crosstabulation

% within Board_Ed

                                                  Board_Ed

                                                      Not voting on
                               For      Against        Amendment         Unsure      Total

Governor    Abercrombie         42.8%      53.7%                38.5%       52.6%      47.2%

            Aiona               50.5%      37.8%                41.0%       30.8%      44.3%

            Undecided            6.7%       8.5%                20.5%       16.7%       8.5%

Total                          100.0%     100.0%               100.0%      100.0%    100.0%


                                                                                               20
Governor * Gov_Primary Crosstabulation

% within Gov_Primary

                                                           Gov_Primary

                               Hannemann         Abercrombie       Didn't vote/Other Don't remember   Total

Governor    Abercrombie                31.2%               79.8%              8.3%           28.9%      46.7%

            Aiona                      60.2%               14.9%            83.0%            28.9%      45.0%

            Undecided                     8.6%             5.3%               8.7%           42.1%       8.3%

Total                                 100.0%            100.0%             100.0%           100.0%    100.0%


                  Governor * Gender Crosstabulation

% within Gender

                                       Gender

                                 female          male        Total

Governor    Abercrombie             47.9%          45.7%        47.1%

            Aiona                   42.2%          50.0%        45.2%

            Undecided                9.9%           4.3%           7.7%

Total                              100.0%         100.0%       100.0%


                                                                                                                21
Governor * Race Crosstabulation

% within Race

                                                                   Race

                          White     Asian       Pacific Islander    Hispanic       African American   Two or more    Total

Governor    Abercrombie     46.0%     50.0%                43.4%          44.4%               85.7%          40.0%     46.9%

            Aiona           50.0%     40.8%                45.3%          55.6%               14.3%          44.8%     45.5%

            Undecided        4.0%      9.2%                11.3%                                             15.2%      7.6%

Total                      100.0%    100.0%              100.0%           100.0%             100.0%         100.0%    100.0%


                                                                                                                               22
Governor * Religion Crosstabulation

% within Religion

                                                                          Religion

                          Catholic    Evangelical       Mormon      Other Christian   e.Buddhist   Jewish    Other     None     Total

Governor    Abercrombie       43.0%          21.3%          23.5%            47.5%         63.8%     53.8%     58.0%    61.7%     46.7%

            Aiona             49.2%          72.3%          67.6%            46.8%         25.0%     30.8%     33.3%    29.9%     45.6%

            Undecided          7.8%           6.5%           8.8%              5.7%        11.2%     15.4%      8.7%     8.4%      7.7%

Total                        100.0%         100.0%         100.0%           100.0%        100.0%    100.0%    100.0%   100.0%   100.0%


                                                                                                                                        23
Governor * Party Crosstabulation

% within Party

                                                               Party

                                Democrat          Republican           Independent        Unsure     Total

Governor     Abercrombie               72.9%               5.7%                   34.3%      25.4%     46.5%

             Aiona                     19.6%              92.4%                   57.7%      47.9%     45.7%

             Undecided                   7.5%              1.9%                   7.9%       26.8%      7.8%

Total                                 100.0%              100.0%              100.0%        100.0%    100.0%


                       Party * Governor Crosstabulation

% within Governor

                                           Governor

                           Abercrombie       Aiona       Undecided        Total

Party    Democrat                  75.3%        20.6%           46.3%       48.1%

         Republican                 2.4%        40.5%            4.9%       20.0%

         Independent               18.6%        31.8%           25.6%       25.2%

         Unsure                     3.7%         7.1%           23.2%        6.7%

Total                             100.0%        100.0%         100.0%      100.0%


                                                                                                               24
Governor * TeaParty Crosstabulation

% within TeaParty

                                         TeaParty

                                No         Yes       Unsure        Total

Governor    Abercrombie          54.8%      12.6%         28.9%      46.8%

            Aiona                37.8%      85.7%         56.3%      45.5%

            Undecided             7.4%       1.7%         14.8%       7.7%

Total                           100.0%     100.0%         100.0%   100.0%


                                                                             25
Governor * Politics Crosstabulation

% within Politics

                                                   Politics

                            Liberal     Moderate         Conservative      Unsure     Total

Governor      Abercrombie      87.9%          50.3%               10.8%       42.3%     46.7%

              Aiona              9.2%         41.6%               84.1%       37.2%     45.6%

              Undecided          2.9%          8.1%                5.1%       20.4%      7.7%

Total                         100.0%         100.0%               100.0%     100.0%    100.0%


                                                                                                26
Governor * Age Crosstabulation

% within Age

                                                     Age

                             18-24      25-34       35-49        50-64     65+      Total

Governor       Abercrombie     88.9%       46.7%       37.3%       54.6%    42.4%     46.7%

               Aiona                       46.7%       52.9%       40.7%    48.4%     45.7%

               Undecided       11.1%        6.7%        9.8%        4.6%     9.2%      7.6%

Total                         100.0%      100.0%      100.0%      100.0%   100.0%    100.0%


                                                                                              27
CROSSTABS—Congress


            Cong_Strength * Congress Crosstabulation

% within Congress

                                       Congress

                                Djou        Hanabusa       Total

Cong_Strength       Definite      88.8%           85.3%      87.0%

                    Probably       6.3%           10.0%       8.3%

                    Leaning        4.8%            4.7%       4.8%

Total                            100.0%           100.0%   100.0%


                                                                            28
Cong_Issue * Congress Crosstabulation

% within Congress

                                                                      Congress

                                                       Djou        Hanabusa        Neither/Undecided   Total

Cong_Issue     Civil unions/Social Issues               16.4%           30.4%                 18.4%      23.4%

               Cultural background                       7.8%           11.4%                  2.6%       9.2%

               Economy/Jobs                             38.3%           37.8%                 57.9%      39.3%

               Energy/Environment                        3.0%               3.3%               7.9%       3.5%

               Government Power                         27.1%               8.4%               5.3%      16.5%

               Unsure                                    7.4%               8.7%               7.9%       8.1%

Total                                                  100.0%          100.0%                100.0%     100.0%


                                                             Congress * Cong_Issue Crosstabulation

% within Cong_Issue

                                                                                         Cong_Issue

                                             Civil
                                      unions/Social              Cultural                          Energy/Environm     Government
                                            Issues             background          Economy/Jobs          ent             Power          Unsure    Total

Congress     Djou                                    31.0%             37.5%               43.3%               38.1%         73.0%        40.8%     44.4%

             Hanabusa                                64.1%             60.7%               47.5%               47.6%         25.0%        53.1%     49.3%

             Neither/Undecided                       4.9%               1.8%                9.2%               14.3%             2.0%      6.1%      6.3%

Total                                           100.0%                100.0%              100.0%           100.0%           100.0%       100.0%   100.0%

                                                                                                                                                            29
Obama * Congress Crosstabulation

% within Congress

                                                    Congress

                                                                Neither/Undecide
                                         Djou     Hanabusa             d            Total

Obama     Approve strongly                11.2%        65.6%                29.3%     39.1%

          Approve somewhat                17.8%        27.1%                26.8%     23.0%

          Disapprove somewhat             18.6%         1.3%                 9.8%      9.5%

          Disapprove strongly             49.1%         1.0%                 9.8%     22.8%

          Unsure                           3.3%         5.0%                24.4%      5.6%

Total                                    100.0%       100.0%               100.0%    100.0%


                     Obama_Condensed * Congress Crosstabulation

% within Congress

                                                    Congress

                                                                Neither/Undecide
                                        Djou      Hanabusa             d            Total

Obama_Condensed        Approve            29.0%        92.6%               56.1%      62.1%

                       Disapprove         67.7%         2.3%               19.5%      32.3%

                       Unsure              3.3%         5.0%               24.4%       5.6%

Total                                    100.0%      100.0%                100.0%   100.0%


                                                                                              30
Congress * Obama Crosstabulation

% within Obama

                                                                       Obama

                                                     Approve           Disapprove          Disapprove
                                Approve strongly    somewhat            somewhat            strongly      Unsure     Total

Congress    Djou                          12.6%              34.3%             86.2%              95.0%      26.5%     44.2%

            Hanabusa                      82.4%              57.9%             6.9%                2.2%      44.1%     49.1%

            Neither/Undecided                5.0%             7.9%             6.9%                2.9%      29.4%      6.7%

Total                                    100.0%          100.0%               100.0%             100.0%     100.0%   100.0%


                   Congress * Obama_Condensed Crosstabulation

% within Obama_Condensed

                                             Obama_Condensed

                                   Approve      Disapprove      Unsure         Total

Congress    Djou                       20.6%          92.4%          26.5%         44.2%

            Hanabusa                   73.3%           3.6%          44.1%         49.1%

            Neither/Undecided           6.1%           4.1%          29.4%          6.7%

Total                                100.0%          100.0%          100.0%     100.0%


                                                                                                                               31
Religion_in_Govt * Congress Crosstabulation

% within Congress

                                                                   Congress

                                                                                Neither/Undecide
                                                   Djou         Hanabusa                d             Total

Religion_in_Govt    No religion                         26.4%         62.5%                 43.9%       45.3%

                    Unofficial religion                 52.0%         25.4%                 26.8%       37.3%

                    Official religion                   4.5%            5.0%                 4.9%         4.8%

                    Christianity                        14.1%           4.0%                 4.9%         8.5%

                    Unsure                              3.0%            3.0%                19.5%         4.1%

Total                                               100.0%           100.0%                 100.0%     100.0%


                                            Congress * Religion_in_Govt Crosstabulation

% within Religion_in_Govt

                                                                           Religion_in_Govt

                                          No religion     Unofficial religion   Official religion    Christianity     Unsure     Total

Congress     Djou                                25.7%                61.7%                 41.4%             73.1%      32.0%     44.2%

             Hanabusa                            67.8%                33.5%                 51.7%             23.1%      36.0%     49.1%

             Neither/Undecided                    6.5%                 4.8%                  6.9%             3.8%       32.0%      6.7%

Total                                           100.0%              100.0%               100.0%            100.0%       100.0%   100.0%


                                                                                                                                           32
Congress * Board_Ed Crosstabulation

% within Board_Ed

                                                             Board_Ed

                                                                 Not voting on
                                      For          Against        Amendment            Unsure           Total

Congress    Djou                       54.0%            30.8%              35.3%          29.3%           44.2%

            Hanabusa                   40.6%            63.2%              58.8%          48.8%           49.1%

            Neither/Undecided            5.4%           6.0%                5.9%          22.0%            6.7%

Total                                 100.0%         100.0%               100.0%         100.0%         100.0%


                           Board_Ed * Congress Crosstabulation

% within Congress

                                                             Congress

                                                                         Neither/Undecide
                                            Djou         Hanabusa                d              Total

Board_Ed    For                                 70.3%           47.5%                46.3%        57.5%

            Against                             23.0%           42.5%                29.3%        33.0%

            Not voting on Amendment             2.2%             3.3%                 2.4%         2.8%

            Unsure                              4.5%             6.7%                22.0%         6.7%

Total                                        100.0%             100.0%               100.0%     100.0%


                                                                                                                  33
Congress * Congress_May Crosstabulation

% within Congress_May

                                                                Congress_May

                                     Case        Djou         Hanabusa        Didn't vote/Other Don't remember   Total

Congress    Djou                       25.8%          91.0%           4.8%             63.6%            18.8%      45.5%

            Hanabusa                   65.6%           5.4%           90.9%            27.3%            50.0%      48.4%

            Neither/Undecided           8.6%           3.6%           4.2%               9.1%           31.3%       6.1%

Total                                100.0%          100.0%       100.0%              100.0%           100.0%    100.0%


                  Congress * Gender Crosstabulation

% within Gender

                                            Gender

                                    female           male     Total

Congress    Djou                       41.6%          51.3%     45.4%

            Hanabusa                   50.3%          45.5%     48.4%

            Neither/Undecided           8.1%           3.1%      6.1%

Total                                 100.0%         100.0%    100.0%


                                                                                                                           34
Congress * Race Crosstabulation

% within Race

                                                                       Race

                                White     Asian     Pacific Islander    Hispanic       African American   Two or more   Total

Congress    Djou                  52.2%     41.9%             29.3%           33.3%               28.6%         56.8%    45.7%

            Hanabusa              44.0%     49.8%             63.4%           66.7%               71.4%         38.6%    48.1%

            Neither/Undecided      3.9%      8.3%               7.3%                                             4.5%      6.2%

Total                            100.0%    100.0%            100.0%           100.0%             100.0%        100.0%   100.0%


                                                                                                                                  35
Congress * Religion Crosstabulation

% within Religion

                                                                              Religion

                                 Catholic    Evangelical    Mormon      Other Christian    e.Buddhist   Jewish    Other     None     Total

Congress     Djou                    53.8%          69.1%       25.0%            51.5%          27.9%     42.9%     28.2%    33.0%     46.1%

             Hanabusa                40.3%          21.0%       66.7%            43.3%          64.7%     57.1%     66.7%    62.0%     47.7%

             Neither/Undecided        5.9%           9.9%        8.3%              5.2%          7.4%                5.1%     5.0%      6.3%

Total                               100.0%         100.0%      100.0%           100.0%         100.0%    100.0%   100.0%    100.0%   100.0%
Congress * Party Crosstabulation

% within Party

                                                                    Party

                                         Democrat         Republican        Independent       Unsure     Total

Congress     Djou                             18.4%              91.7%             62.3%         58.8%     46.1%

             Hanabusa                         76.5%                6.4%            32.6%          5.9%     47.7%

             Neither/Undecided                 5.1%                1.8%                5.1%      35.3%      6.3%

Total                                        100.0%             100.0%            100.0%        100.0%   100.0%


                        Party * Congress Crosstabulation

% within Congress

                                              Congress

                              Djou        Hanabusa        Neither/Undecided    Total

Party    Democrat                19.8%         79.7%                   40.0%    49.6%

         Republican              38.9%          2.6%                   5.7%     19.5%

         Independent             33.5%         16.9%                   20.0%    24.7%

         Unsure                  7.8%               .8%                34.3%     6.1%

Total                         100.0%          100.0%                100.0%     100.0%
Congress * TeaParty Crosstabulation

% within TeaParty

                                              TeaParty

                                     No         Yes         Unsure     Total

Congress     Djou                     39.2%      79.3%         61.2%     46.0%

             Hanabusa                 54.5%      19.0%         28.4%     47.7%

             Neither/Undecided         6.3%       1.7%         10.4%      6.3%

Total                                100.0%     100.0%        100.0%   100.0%
Congress * Politics Crosstabulation

% within Politics

                                                             Politics

                                      Liberal     Moderate        Conservative    Unsure     Total

Congress       Djou                      13.7%          43.1%             84.0%      40.8%     46.1%

               Hanabusa                  80.6%          52.8%             12.5%      39.4%     47.5%

               Neither/Undecided           5.8%          4.1%              3.5%      19.7%      6.4%

Total                                   100.0%         100.0%            100.0%     100.0%   100.0%


                                                                                                       39
Congress * Age Crosstabulation

% within Age

                                                          Age

                                    18-24      25-34      35-49     50-64     65+      Total

Congress       Djou                              57.1%      59.6%     40.4%    48.7%     46.3%

               Hanabusa               85.7%      42.9%      31.9%     53.7%    45.0%     47.4%

               Neither/Undecided      14.3%                  8.5%      5.9%     6.3%      6.4%

Total                                100.0%     100.0%     100.0%    100.0%   100.0%   100.0%


                                                                                                 40
Governor – Congress Crosstabs
                                                               (CD 1 Only)


                          Congress * Governor Crosstabulation

% within Governor

                                                       Governor

                                        Abercrombie      Aiona     Undecided        Total

Congress     Djou                              10.8%       90.0%         20.8%           44.2%

             Hanabusa                          85.0%        8.4%         34.0%           49.1%

             Neither/Undecided                  4.2%        1.6%         45.3%           6.7%

Total                                        100.0%       100.0%        100.0%         100.0%


                     Governor * Congress Crosstabulation

% within Congress

                                                Congress

                                 Djou       Hanabusa      Neither/Undecided    Total

Governor    Abercrombie           12.3%          87.0%                31.7%      50.2%

            Aiona                 83.6%           7.0%                 9.8%      41.1%

            Undecided              4.1%           6.0%                58.5%      8.7%

Total                            100.0%         100.0%              100.0%     100.0%


                                                                                                 41

More Related Content

More from Honolulu Civil Beat

Gov. David Ige response to U.S. Rep. Anna Eshoo
Gov. David Ige response to U.S. Rep. Anna EshooGov. David Ige response to U.S. Rep. Anna Eshoo
Gov. David Ige response to U.S. Rep. Anna EshooHonolulu Civil Beat
 
Audit of the Department of the Honolulu Prosecuting Attorney’s Policies, Proc...
Audit of the Department of the Honolulu Prosecuting Attorney’s Policies, Proc...Audit of the Department of the Honolulu Prosecuting Attorney’s Policies, Proc...
Audit of the Department of the Honolulu Prosecuting Attorney’s Policies, Proc...Honolulu Civil Beat
 
Audit of the Honolulu Police Department’s Policies, Procedures, and Controls
Audit of the Honolulu Police Department’s Policies, Procedures, and ControlsAudit of the Honolulu Police Department’s Policies, Procedures, and Controls
Audit of the Honolulu Police Department’s Policies, Procedures, and ControlsHonolulu Civil Beat
 
2019 Use of Force Annual Report HPD
2019 Use of Force Annual Report HPD 2019 Use of Force Annual Report HPD
2019 Use of Force Annual Report HPD Honolulu Civil Beat
 
Office of Health Equity Goals Draft 10
Office of Health Equity Goals Draft 10Office of Health Equity Goals Draft 10
Office of Health Equity Goals Draft 10Honolulu Civil Beat
 
ACLU Letter to HPD regarding racial profiling
ACLU Letter to HPD regarding racial profilingACLU Letter to HPD regarding racial profiling
ACLU Letter to HPD regarding racial profilingHonolulu Civil Beat
 
ACLU Letter to HPD regarding racial profiling
ACLU Letter to HPD regarding racial profilingACLU Letter to HPD regarding racial profiling
ACLU Letter to HPD regarding racial profilingHonolulu Civil Beat
 
Guam Governor's Letter to Pence
Guam Governor's Letter to Pence Guam Governor's Letter to Pence
Guam Governor's Letter to Pence Honolulu Civil Beat
 
List Of Pro Bono Legal Service Providers
List Of Pro Bono Legal Service ProvidersList Of Pro Bono Legal Service Providers
List Of Pro Bono Legal Service ProvidersHonolulu Civil Beat
 
Arbitration Hearing Transcript December 2018
Arbitration Hearing Transcript December 2018Arbitration Hearing Transcript December 2018
Arbitration Hearing Transcript December 2018Honolulu Civil Beat
 

More from Honolulu Civil Beat (20)

Gov. David Ige response to U.S. Rep. Anna Eshoo
Gov. David Ige response to U.S. Rep. Anna EshooGov. David Ige response to U.S. Rep. Anna Eshoo
Gov. David Ige response to U.S. Rep. Anna Eshoo
 
Audit of the Department of the Honolulu Prosecuting Attorney’s Policies, Proc...
Audit of the Department of the Honolulu Prosecuting Attorney’s Policies, Proc...Audit of the Department of the Honolulu Prosecuting Attorney’s Policies, Proc...
Audit of the Department of the Honolulu Prosecuting Attorney’s Policies, Proc...
 
Audit of the Honolulu Police Department’s Policies, Procedures, and Controls
Audit of the Honolulu Police Department’s Policies, Procedures, and ControlsAudit of the Honolulu Police Department’s Policies, Procedures, and Controls
Audit of the Honolulu Police Department’s Policies, Procedures, and Controls
 
2019 Use of Force Annual Report HPD
2019 Use of Force Annual Report HPD 2019 Use of Force Annual Report HPD
2019 Use of Force Annual Report HPD
 
Office of Health Equity Goals Draft 10
Office of Health Equity Goals Draft 10Office of Health Equity Goals Draft 10
Office of Health Equity Goals Draft 10
 
NHPI COVID-19 Statement
NHPI COVID-19 StatementNHPI COVID-19 Statement
NHPI COVID-19 Statement
 
DLIR Response Language Access
DLIR Response Language AccessDLIR Response Language Access
DLIR Response Language Access
 
Language Access Letter To DLIR
Language Access Letter To DLIRLanguage Access Letter To DLIR
Language Access Letter To DLIR
 
ACLU Letter to HPD regarding racial profiling
ACLU Letter to HPD regarding racial profilingACLU Letter to HPD regarding racial profiling
ACLU Letter to HPD regarding racial profiling
 
ACLU Letter to HPD regarding racial profiling
ACLU Letter to HPD regarding racial profilingACLU Letter to HPD regarding racial profiling
ACLU Letter to HPD regarding racial profiling
 
Jane Doe v. Rehab Hospital
Jane Doe v. Rehab HospitalJane Doe v. Rehab Hospital
Jane Doe v. Rehab Hospital
 
Coronavirus HPHA
Coronavirus HPHA Coronavirus HPHA
Coronavirus HPHA
 
OHA Data Request
OHA Data RequestOHA Data Request
OHA Data Request
 
Letter from Palau to Guam
Letter from Palau to GuamLetter from Palau to Guam
Letter from Palau to Guam
 
Guam Governor's Letter to Pence
Guam Governor's Letter to Pence Guam Governor's Letter to Pence
Guam Governor's Letter to Pence
 
OHA Analysis by Akina
OHA Analysis by AkinaOHA Analysis by Akina
OHA Analysis by Akina
 
Case COFA Letter
Case COFA LetterCase COFA Letter
Case COFA Letter
 
List Of Pro Bono Legal Service Providers
List Of Pro Bono Legal Service ProvidersList Of Pro Bono Legal Service Providers
List Of Pro Bono Legal Service Providers
 
Arbitration Hearing Transcript December 2018
Arbitration Hearing Transcript December 2018Arbitration Hearing Transcript December 2018
Arbitration Hearing Transcript December 2018
 
Caldwell Press Release
Caldwell Press ReleaseCaldwell Press Release
Caldwell Press Release
 

Recently uploaded

Geostrategic significance of South Asian countries.ppt
Geostrategic significance of South Asian countries.pptGeostrategic significance of South Asian countries.ppt
Geostrategic significance of South Asian countries.pptUsmanKaran
 
12042024_First India Newspaper Jaipur.pdf
12042024_First India Newspaper Jaipur.pdf12042024_First India Newspaper Jaipur.pdf
12042024_First India Newspaper Jaipur.pdfFIRST INDIA
 
Emerging issues in migration policies.ppt
Emerging issues in migration policies.pptEmerging issues in migration policies.ppt
Emerging issues in migration policies.pptNandinituteja1
 
Political-Ideologies-and-The-Movements.pptx
Political-Ideologies-and-The-Movements.pptxPolitical-Ideologies-and-The-Movements.pptx
Political-Ideologies-and-The-Movements.pptxSasikiranMarri
 
lok sabha Elections in india- 2024 .pptx
lok sabha Elections in india- 2024 .pptxlok sabha Elections in india- 2024 .pptx
lok sabha Elections in india- 2024 .pptxdigiyvbmrkt
 
13042024_First India Newspaper Jaipur.pdf
13042024_First India Newspaper Jaipur.pdf13042024_First India Newspaper Jaipur.pdf
13042024_First India Newspaper Jaipur.pdfFIRST INDIA
 
Mitochondrial Fusion Vital for Adult Brain Function and Disease Understanding...
Mitochondrial Fusion Vital for Adult Brain Function and Disease Understanding...Mitochondrial Fusion Vital for Adult Brain Function and Disease Understanding...
Mitochondrial Fusion Vital for Adult Brain Function and Disease Understanding...The Lifesciences Magazine
 
11042024_First India Newspaper Jaipur.pdf
11042024_First India Newspaper Jaipur.pdf11042024_First India Newspaper Jaipur.pdf
11042024_First India Newspaper Jaipur.pdfFIRST INDIA
 
Power in International Relations (Pol 5)
Power in International Relations (Pol 5)Power in International Relations (Pol 5)
Power in International Relations (Pol 5)ssuser583c35
 
15042024_First India Newspaper Jaipur.pdf
15042024_First India Newspaper Jaipur.pdf15042024_First India Newspaper Jaipur.pdf
15042024_First India Newspaper Jaipur.pdfFIRST INDIA
 

Recently uploaded (10)

Geostrategic significance of South Asian countries.ppt
Geostrategic significance of South Asian countries.pptGeostrategic significance of South Asian countries.ppt
Geostrategic significance of South Asian countries.ppt
 
12042024_First India Newspaper Jaipur.pdf
12042024_First India Newspaper Jaipur.pdf12042024_First India Newspaper Jaipur.pdf
12042024_First India Newspaper Jaipur.pdf
 
Emerging issues in migration policies.ppt
Emerging issues in migration policies.pptEmerging issues in migration policies.ppt
Emerging issues in migration policies.ppt
 
Political-Ideologies-and-The-Movements.pptx
Political-Ideologies-and-The-Movements.pptxPolitical-Ideologies-and-The-Movements.pptx
Political-Ideologies-and-The-Movements.pptx
 
lok sabha Elections in india- 2024 .pptx
lok sabha Elections in india- 2024 .pptxlok sabha Elections in india- 2024 .pptx
lok sabha Elections in india- 2024 .pptx
 
13042024_First India Newspaper Jaipur.pdf
13042024_First India Newspaper Jaipur.pdf13042024_First India Newspaper Jaipur.pdf
13042024_First India Newspaper Jaipur.pdf
 
Mitochondrial Fusion Vital for Adult Brain Function and Disease Understanding...
Mitochondrial Fusion Vital for Adult Brain Function and Disease Understanding...Mitochondrial Fusion Vital for Adult Brain Function and Disease Understanding...
Mitochondrial Fusion Vital for Adult Brain Function and Disease Understanding...
 
11042024_First India Newspaper Jaipur.pdf
11042024_First India Newspaper Jaipur.pdf11042024_First India Newspaper Jaipur.pdf
11042024_First India Newspaper Jaipur.pdf
 
Power in International Relations (Pol 5)
Power in International Relations (Pol 5)Power in International Relations (Pol 5)
Power in International Relations (Pol 5)
 
15042024_First India Newspaper Jaipur.pdf
15042024_First India Newspaper Jaipur.pdf15042024_First India Newspaper Jaipur.pdf
15042024_First India Newspaper Jaipur.pdf
 

Governor's race, issues, and demographics

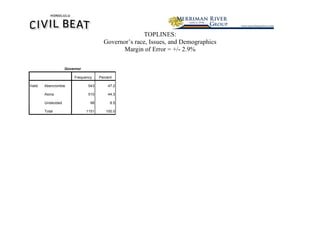
  • 1. TOPLINES: Governor’s race, Issues, and Demographics Margin of Error = +/- 2.9% Governor Frequency Percent Valid Abercrombie 543 47.2 Aiona 510 44.3 Undecided 98 8.5 Total 1151 100.0
  • 2. Gov_Issue Frequency Percent Valid Stronger Leader 666 57.9 Civil unions/Social Issues 186 16.2 Economy/Jobs 133 11.6 Education 84 7.3 Energy/Environment 34 3.0 Unsure 48 4.2 Total 1151 100.0 2
  • 3. Obama Frequency Percent Valid Approve strongly 453 39.4 Approve somewhat 260 22.6 Disapprove somewhat 111 9.6 Disapprove strongly 275 23.9 Unsure 52 4.5 Total 1151 100.0 Obama_Condensed Frequency Percent Valid Approve 713 61.9 Disapprove 386 33.5 Unsure 52 4.5 Total 1151 100.0 3
  • 4. Religion_in_Govt Frequency Percent Valid No religion 491 42.7 Unofficial religion 432 37.5 Official religion 63 5.5 Christianity 121 10.5 Unsure 44 3.8 Total 1151 100.0 4
  • 5. Board_Ed Frequency Percent Valid For 624 54.2 Against 410 35.6 Not voting on Amendment 39 3.4 Unsure 78 6.8 Total 1151 100.0 5
  • 6. Gov_Primary Frequency Percent Valid Percent Valid Hannemann 314 27.3 28.1 Abercrombie 490 42.6 43.8 Didn't vote/Other 277 24.1 24.8 Don't remember 38 3.3 3.4 Total 1119 97.2 100.0 Not Reported 32 2.8 Total 1151 100.0 6
  • 7. Gender Frequency Percent Valid Percent Valid female 666 57.9 61.3 male 420 36.5 38.7 Total 1086 94.4 100.0 Not Reported 65 5.6 Grand Total 1151 100.0 7
  • 8. Race Frequency Percent Valid Percent Valid White 454 39.4 42.3 Asian 392 34.1 36.5 Pacific Islander 106 9.2 9.9 Hispanic 9 .8 .8 African American 7 .6 .7 Two or more 105 9.1 9.8 Total 1073 93.2 100.0 Not Reported 78 6.8 Grand Total 1151 100.0 8
  • 9. Religion Frequency Percent Valid Percent Valid Catholic 244 21.2 23.0 Evangelical 155 13.5 14.6 Mormon 34 3.0 3.2 Other Christian 263 22.8 24.8 Buddhist 116 10.1 10.9 Jewish 13 1.1 1.2 Other 69 6.0 6.5 None 167 14.5 15.7 Total 1061 92.2 100.0 Not Reported 90 7.8 Grand Total 1151 100.0 9
  • 10. Party Frequency Percent Valid Percent Valid Democrat 506 44.0 48.1 Republican 211 18.3 20.0 Independent 265 23.0 25.2 Unsure 71 6.2 6.7 Total 1053 91.5 100.0 Not Reported 98 8.5 Grand Total 1151 100.0 TeaParty Frequency Percent Valid Percent Valid No 796 69.2 76.3 Yes 119 10.3 11.4 Unsure 128 11.1 12.3 Total 1043 90.6 100.0 Not Reported 108 9.4 Grand Total 1151 100.0 10
  • 11. Politics Frequency Percent Valid Percent Valid Liberal 240 20.9 23.3 Moderate 358 31.1 34.8 Conservative 295 25.6 28.6 Unsure 137 11.9 13.3 Total 1030 89.5 100.0 Not Reported 121 10.5 Grand Total 1151 100.0 11
  • 12. Age Frequency Percent Valid Percent Valid 18-24 9 .8 .9 25-34 15 1.3 1.5 35-49 102 8.9 10.0 50-64 366 31.8 35.7 65+ 533 46.3 52.0 Total 1025 89.1 100.0 Not Reported 126 10.9 Grand Total 1151 100.0 12
  • 13. TOPLINES: 1st District Congressional Race Margin of Error = +/- 4.0% Congress Frequency Percent Valid Djou 269 44.2 Hanabusa 299 49.1 Neither/Undecided 41 6.7 Total 609 100.0 13
  • 14. Cong_Issue Frequency Percent Valid Civil unions/Social Issues 142 23.4 Cultural background 56 9.2 Economy/Jobs 238 39.3 Energy/Environment 21 3.5 Government Power 100 16.5 Unsure 49 8.1 Total 606 100.0 14
  • 15. CROSSTABS—Governor Gov_Strength * Governor Crosstabulation % within Governor Governor Abercrombie Aiona Gov_Strength Definite 86.4% 88.2% b.Probably 9.2% 5.7% Leaning 4.4% 6.1% Total 100.0% 100.0% 15
  • 16. Gov_Issue * Governor Crosstabulation % within Governor Governor Abercrombie Aiona Undecided Total Gov_Issue Stronger Leader 67.0% 52.5% 34.7% 57.9% Civil unions/Social Issues 14.5% 20.0% 5.1% 16.2% Economy/Jobs 5.9% 15.9% 20.4% 11.6% Education 6.4% 5.9% 19.4% 7.3% Energy/Environment 2.9% 2.4% 6.1% 3.0% Unsure 3.1% 3.3% 14.3% 4.2% Total 100.0% 100.0% 100.0% 100.0% Governor * Gov_Issue Crosstabulation % within Gov_Issue Gov_Issue Civil unions/Social Energy/Environm Stronger Leader Issues Economy/Jobs Education ent Unsure Total Governor Abercrombie 54.7% 42.5% 24.1% 41.7% 47.1% 35.4% 47.2% Aiona 40.2% 54.8% 60.9% 35.7% 35.3% 35.4% 44.3% Undecided 5.1% 2.7% 15.0% 22.6% 17.6% 29.2% 8.5% Total 100.0% 100.0% 100.0% 100.0% 100.0% 100.0% 100.0% 16
  • 17. Obama * Governor Crosstabulation % within Governor Governor Abercrombie Aiona Undecided Total Obama Approve strongly 65.6% 11.2% 40.8% 39.4% Approve somewhat 26.7% 16.7% 30.6% 22.6% Disapprove somewhat 2.0% 18.0% 8.2% 9.6% Disapprove strongly 1.7% 51.2% 5.1% 23.9% Unsure 4.1% 2.9% 15.3% 4.5% Total 100.0% 100.0% 100.0% 100.0% Obama_Condensed * Governor Crosstabulation % within Governor Governor Abercrombie Aiona Undecided Total Obama_Condensed Approve 92.3% 27.8% 71.4% 61.9% Disapprove 3.7% 69.2% 13.3% 33.5% Unsure 4.1% 2.9% 15.3% 4.5% Total 100.0% 100.0% 100.0% 100.0% 17
  • 18. Governor * Obama Crosstabulation % within Obama Obama Approve Disapprove Disapprove Approve strongly somewhat somewhat strongly Unsure Total Governor Abercrombie 78.6% 55.8% 9.9% 3.3% 42.3% 47.2% Aiona 12.6% 32.7% 82.9% 94.9% 28.8% 44.3% Undecided 8.8% 11.5% 7.2% 1.8% 28.8% 8.5% Total 100.0% 100.0% 100.0% 100.0% 100.0% 100.0% Governor * Obama_Condensed Crosstabulation % within Obama_Condensed Obama_Condensed Approve Disapprove Unsure Total Governor Abercrombie 70.3% 5.2% 42.3% 47.2% Aiona 19.9% 91.5% 28.8% 44.3% Undecided 9.8% 3.4% 28.8% 8.5% Total 100.0% 100.0% 100.0% 100.0% 18
  • 19. Religion_in_Govt * Governor Crosstabulation % within Governor Governor Abercrombie Aiona Undecided Total Religion_in_Govt No religion 62.8% 22.4% 36.7% 42.7% Unofficial religion 26.5% 50.2% 32.7% 37.5% Official religion 5.0% 5.1% 10.2% 5.5% Christianity 2.4% 19.4% 9.2% 10.5% Unsure 3.3% 2.9% 11.2% 3.8% Total 100.0% 100.0% 100.0% 100.0% Governor * Religion_in_Govt Crosstabulation % within Religion_in_Govt Religion_in_Govt No religion Unofficial religion Official religion Christianity Unsure Total Governor Abercrombie 69.5% 33.3% 42.9% 10.7% 40.9% 47.2% Aiona 23.2% 59.3% 41.3% 81.8% 34.1% 44.3% Undecided 7.3% 7.4% 15.9% 7.4% 25.0% 8.5% Total 100.0% 100.0% 100.0% 100.0% 100.0% 100.0% 19
  • 20. Board_Ed * Governor Crosstabulation % within Governor Governor Abercrombie Aiona Undecided Total Board_Ed For 49.2% 61.8% 42.9% 54.2% Against 40.5% 30.4% 35.7% 35.6% Not voting on Amendment 2.8% 3.1% 8.2% 3.4% Unsure 7.6% 4.7% 13.3% 6.8% Total 100.0% 100.0% 100.0% 100.0% Governor * Board_Ed Crosstabulation % within Board_Ed Board_Ed Not voting on For Against Amendment Unsure Total Governor Abercrombie 42.8% 53.7% 38.5% 52.6% 47.2% Aiona 50.5% 37.8% 41.0% 30.8% 44.3% Undecided 6.7% 8.5% 20.5% 16.7% 8.5% Total 100.0% 100.0% 100.0% 100.0% 100.0% 20
  • 21. Governor * Gov_Primary Crosstabulation % within Gov_Primary Gov_Primary Hannemann Abercrombie Didn't vote/Other Don't remember Total Governor Abercrombie 31.2% 79.8% 8.3% 28.9% 46.7% Aiona 60.2% 14.9% 83.0% 28.9% 45.0% Undecided 8.6% 5.3% 8.7% 42.1% 8.3% Total 100.0% 100.0% 100.0% 100.0% 100.0% Governor * Gender Crosstabulation % within Gender Gender female male Total Governor Abercrombie 47.9% 45.7% 47.1% Aiona 42.2% 50.0% 45.2% Undecided 9.9% 4.3% 7.7% Total 100.0% 100.0% 100.0% 21
  • 22. Governor * Race Crosstabulation % within Race Race White Asian Pacific Islander Hispanic African American Two or more Total Governor Abercrombie 46.0% 50.0% 43.4% 44.4% 85.7% 40.0% 46.9% Aiona 50.0% 40.8% 45.3% 55.6% 14.3% 44.8% 45.5% Undecided 4.0% 9.2% 11.3% 15.2% 7.6% Total 100.0% 100.0% 100.0% 100.0% 100.0% 100.0% 100.0% 22
  • 23. Governor * Religion Crosstabulation % within Religion Religion Catholic Evangelical Mormon Other Christian e.Buddhist Jewish Other None Total Governor Abercrombie 43.0% 21.3% 23.5% 47.5% 63.8% 53.8% 58.0% 61.7% 46.7% Aiona 49.2% 72.3% 67.6% 46.8% 25.0% 30.8% 33.3% 29.9% 45.6% Undecided 7.8% 6.5% 8.8% 5.7% 11.2% 15.4% 8.7% 8.4% 7.7% Total 100.0% 100.0% 100.0% 100.0% 100.0% 100.0% 100.0% 100.0% 100.0% 23
  • 24. Governor * Party Crosstabulation % within Party Party Democrat Republican Independent Unsure Total Governor Abercrombie 72.9% 5.7% 34.3% 25.4% 46.5% Aiona 19.6% 92.4% 57.7% 47.9% 45.7% Undecided 7.5% 1.9% 7.9% 26.8% 7.8% Total 100.0% 100.0% 100.0% 100.0% 100.0% Party * Governor Crosstabulation % within Governor Governor Abercrombie Aiona Undecided Total Party Democrat 75.3% 20.6% 46.3% 48.1% Republican 2.4% 40.5% 4.9% 20.0% Independent 18.6% 31.8% 25.6% 25.2% Unsure 3.7% 7.1% 23.2% 6.7% Total 100.0% 100.0% 100.0% 100.0% 24
  • 25. Governor * TeaParty Crosstabulation % within TeaParty TeaParty No Yes Unsure Total Governor Abercrombie 54.8% 12.6% 28.9% 46.8% Aiona 37.8% 85.7% 56.3% 45.5% Undecided 7.4% 1.7% 14.8% 7.7% Total 100.0% 100.0% 100.0% 100.0% 25
  • 26. Governor * Politics Crosstabulation % within Politics Politics Liberal Moderate Conservative Unsure Total Governor Abercrombie 87.9% 50.3% 10.8% 42.3% 46.7% Aiona 9.2% 41.6% 84.1% 37.2% 45.6% Undecided 2.9% 8.1% 5.1% 20.4% 7.7% Total 100.0% 100.0% 100.0% 100.0% 100.0% 26
  • 27. Governor * Age Crosstabulation % within Age Age 18-24 25-34 35-49 50-64 65+ Total Governor Abercrombie 88.9% 46.7% 37.3% 54.6% 42.4% 46.7% Aiona 46.7% 52.9% 40.7% 48.4% 45.7% Undecided 11.1% 6.7% 9.8% 4.6% 9.2% 7.6% Total 100.0% 100.0% 100.0% 100.0% 100.0% 100.0% 27
  • 28. CROSSTABS—Congress Cong_Strength * Congress Crosstabulation % within Congress Congress Djou Hanabusa Total Cong_Strength Definite 88.8% 85.3% 87.0% Probably 6.3% 10.0% 8.3% Leaning 4.8% 4.7% 4.8% Total 100.0% 100.0% 100.0% 28
  • 29. Cong_Issue * Congress Crosstabulation % within Congress Congress Djou Hanabusa Neither/Undecided Total Cong_Issue Civil unions/Social Issues 16.4% 30.4% 18.4% 23.4% Cultural background 7.8% 11.4% 2.6% 9.2% Economy/Jobs 38.3% 37.8% 57.9% 39.3% Energy/Environment 3.0% 3.3% 7.9% 3.5% Government Power 27.1% 8.4% 5.3% 16.5% Unsure 7.4% 8.7% 7.9% 8.1% Total 100.0% 100.0% 100.0% 100.0% Congress * Cong_Issue Crosstabulation % within Cong_Issue Cong_Issue Civil unions/Social Cultural Energy/Environm Government Issues background Economy/Jobs ent Power Unsure Total Congress Djou 31.0% 37.5% 43.3% 38.1% 73.0% 40.8% 44.4% Hanabusa 64.1% 60.7% 47.5% 47.6% 25.0% 53.1% 49.3% Neither/Undecided 4.9% 1.8% 9.2% 14.3% 2.0% 6.1% 6.3% Total 100.0% 100.0% 100.0% 100.0% 100.0% 100.0% 100.0% 29
  • 30. Obama * Congress Crosstabulation % within Congress Congress Neither/Undecide Djou Hanabusa d Total Obama Approve strongly 11.2% 65.6% 29.3% 39.1% Approve somewhat 17.8% 27.1% 26.8% 23.0% Disapprove somewhat 18.6% 1.3% 9.8% 9.5% Disapprove strongly 49.1% 1.0% 9.8% 22.8% Unsure 3.3% 5.0% 24.4% 5.6% Total 100.0% 100.0% 100.0% 100.0% Obama_Condensed * Congress Crosstabulation % within Congress Congress Neither/Undecide Djou Hanabusa d Total Obama_Condensed Approve 29.0% 92.6% 56.1% 62.1% Disapprove 67.7% 2.3% 19.5% 32.3% Unsure 3.3% 5.0% 24.4% 5.6% Total 100.0% 100.0% 100.0% 100.0% 30
  • 31. Congress * Obama Crosstabulation % within Obama Obama Approve Disapprove Disapprove Approve strongly somewhat somewhat strongly Unsure Total Congress Djou 12.6% 34.3% 86.2% 95.0% 26.5% 44.2% Hanabusa 82.4% 57.9% 6.9% 2.2% 44.1% 49.1% Neither/Undecided 5.0% 7.9% 6.9% 2.9% 29.4% 6.7% Total 100.0% 100.0% 100.0% 100.0% 100.0% 100.0% Congress * Obama_Condensed Crosstabulation % within Obama_Condensed Obama_Condensed Approve Disapprove Unsure Total Congress Djou 20.6% 92.4% 26.5% 44.2% Hanabusa 73.3% 3.6% 44.1% 49.1% Neither/Undecided 6.1% 4.1% 29.4% 6.7% Total 100.0% 100.0% 100.0% 100.0% 31
  • 32. Religion_in_Govt * Congress Crosstabulation % within Congress Congress Neither/Undecide Djou Hanabusa d Total Religion_in_Govt No religion 26.4% 62.5% 43.9% 45.3% Unofficial religion 52.0% 25.4% 26.8% 37.3% Official religion 4.5% 5.0% 4.9% 4.8% Christianity 14.1% 4.0% 4.9% 8.5% Unsure 3.0% 3.0% 19.5% 4.1% Total 100.0% 100.0% 100.0% 100.0% Congress * Religion_in_Govt Crosstabulation % within Religion_in_Govt Religion_in_Govt No religion Unofficial religion Official religion Christianity Unsure Total Congress Djou 25.7% 61.7% 41.4% 73.1% 32.0% 44.2% Hanabusa 67.8% 33.5% 51.7% 23.1% 36.0% 49.1% Neither/Undecided 6.5% 4.8% 6.9% 3.8% 32.0% 6.7% Total 100.0% 100.0% 100.0% 100.0% 100.0% 100.0% 32
  • 33. Congress * Board_Ed Crosstabulation % within Board_Ed Board_Ed Not voting on For Against Amendment Unsure Total Congress Djou 54.0% 30.8% 35.3% 29.3% 44.2% Hanabusa 40.6% 63.2% 58.8% 48.8% 49.1% Neither/Undecided 5.4% 6.0% 5.9% 22.0% 6.7% Total 100.0% 100.0% 100.0% 100.0% 100.0% Board_Ed * Congress Crosstabulation % within Congress Congress Neither/Undecide Djou Hanabusa d Total Board_Ed For 70.3% 47.5% 46.3% 57.5% Against 23.0% 42.5% 29.3% 33.0% Not voting on Amendment 2.2% 3.3% 2.4% 2.8% Unsure 4.5% 6.7% 22.0% 6.7% Total 100.0% 100.0% 100.0% 100.0% 33
  • 34. Congress * Congress_May Crosstabulation % within Congress_May Congress_May Case Djou Hanabusa Didn't vote/Other Don't remember Total Congress Djou 25.8% 91.0% 4.8% 63.6% 18.8% 45.5% Hanabusa 65.6% 5.4% 90.9% 27.3% 50.0% 48.4% Neither/Undecided 8.6% 3.6% 4.2% 9.1% 31.3% 6.1% Total 100.0% 100.0% 100.0% 100.0% 100.0% 100.0% Congress * Gender Crosstabulation % within Gender Gender female male Total Congress Djou 41.6% 51.3% 45.4% Hanabusa 50.3% 45.5% 48.4% Neither/Undecided 8.1% 3.1% 6.1% Total 100.0% 100.0% 100.0% 34
  • 35. Congress * Race Crosstabulation % within Race Race White Asian Pacific Islander Hispanic African American Two or more Total Congress Djou 52.2% 41.9% 29.3% 33.3% 28.6% 56.8% 45.7% Hanabusa 44.0% 49.8% 63.4% 66.7% 71.4% 38.6% 48.1% Neither/Undecided 3.9% 8.3% 7.3% 4.5% 6.2% Total 100.0% 100.0% 100.0% 100.0% 100.0% 100.0% 100.0% 35
  • 36. Congress * Religion Crosstabulation % within Religion Religion Catholic Evangelical Mormon Other Christian e.Buddhist Jewish Other None Total Congress Djou 53.8% 69.1% 25.0% 51.5% 27.9% 42.9% 28.2% 33.0% 46.1% Hanabusa 40.3% 21.0% 66.7% 43.3% 64.7% 57.1% 66.7% 62.0% 47.7% Neither/Undecided 5.9% 9.9% 8.3% 5.2% 7.4% 5.1% 5.0% 6.3% Total 100.0% 100.0% 100.0% 100.0% 100.0% 100.0% 100.0% 100.0% 100.0%
  • 37. Congress * Party Crosstabulation % within Party Party Democrat Republican Independent Unsure Total Congress Djou 18.4% 91.7% 62.3% 58.8% 46.1% Hanabusa 76.5% 6.4% 32.6% 5.9% 47.7% Neither/Undecided 5.1% 1.8% 5.1% 35.3% 6.3% Total 100.0% 100.0% 100.0% 100.0% 100.0% Party * Congress Crosstabulation % within Congress Congress Djou Hanabusa Neither/Undecided Total Party Democrat 19.8% 79.7% 40.0% 49.6% Republican 38.9% 2.6% 5.7% 19.5% Independent 33.5% 16.9% 20.0% 24.7% Unsure 7.8% .8% 34.3% 6.1% Total 100.0% 100.0% 100.0% 100.0%
  • 38. Congress * TeaParty Crosstabulation % within TeaParty TeaParty No Yes Unsure Total Congress Djou 39.2% 79.3% 61.2% 46.0% Hanabusa 54.5% 19.0% 28.4% 47.7% Neither/Undecided 6.3% 1.7% 10.4% 6.3% Total 100.0% 100.0% 100.0% 100.0%
  • 39. Congress * Politics Crosstabulation % within Politics Politics Liberal Moderate Conservative Unsure Total Congress Djou 13.7% 43.1% 84.0% 40.8% 46.1% Hanabusa 80.6% 52.8% 12.5% 39.4% 47.5% Neither/Undecided 5.8% 4.1% 3.5% 19.7% 6.4% Total 100.0% 100.0% 100.0% 100.0% 100.0% 39
  • 40. Congress * Age Crosstabulation % within Age Age 18-24 25-34 35-49 50-64 65+ Total Congress Djou 57.1% 59.6% 40.4% 48.7% 46.3% Hanabusa 85.7% 42.9% 31.9% 53.7% 45.0% 47.4% Neither/Undecided 14.3% 8.5% 5.9% 6.3% 6.4% Total 100.0% 100.0% 100.0% 100.0% 100.0% 100.0% 40
  • 41. Governor – Congress Crosstabs (CD 1 Only) Congress * Governor Crosstabulation % within Governor Governor Abercrombie Aiona Undecided Total Congress Djou 10.8% 90.0% 20.8% 44.2% Hanabusa 85.0% 8.4% 34.0% 49.1% Neither/Undecided 4.2% 1.6% 45.3% 6.7% Total 100.0% 100.0% 100.0% 100.0% Governor * Congress Crosstabulation % within Congress Congress Djou Hanabusa Neither/Undecided Total Governor Abercrombie 12.3% 87.0% 31.7% 50.2% Aiona 83.6% 7.0% 9.8% 41.1% Undecided 4.1% 6.0% 58.5% 8.7% Total 100.0% 100.0% 100.0% 100.0% 41