SlideShare une entreprise Scribd logo
1  sur  2
Télécharger pour lire hors ligne
White Only                At least part-Asian       At least part-Pacific Islander
      Geography   2009 ACS 2000 Census Percent 2009 ACS 2000 Census Percent 2009 ACS 2000 Census Percent
                                       Change                          Change                           Change
United States      74.5%      75.1%     -0.9%    5.0%        4.4%       13.5%   0.3%        0.3%        -11.7%
Hawaii             26.9%      24.1%     11.5%   55.0%       67.2%       -18.1% 23.1%       24.4%         -5.0%
Mississippi        60.0%      61.4%     -2.2%    1.0%        0.8%       19.8%   0.1%        0.1%        -14.9%
Maryland           60.9%      64.0%     -4.9%    5.5%        4.6%       20.8%   0.1%        0.1%        -23.4%
California         61.3%      59.4%      3.2%   13.6%       12.6%        7.6%   0.6%        0.7%        -14.3%
Georgia            62.1%      65.1%     -4.5%    3.1%        2.5%       26.5%   0.1%        0.1%        -25.8%
Louisiana          64.0%      63.9%      0.1%    1.6%        1.5%       10.9%   0.0%        0.1%        -40.2%
New York           67.1%      67.9%     -1.2%    7.2%        6.3%       15.0%   0.1%        0.2%        -65.7%
South Carolina     67.4%      67.2%      0.3%    1.5%        1.1%       26.5%   0.1%        0.1%        -22.7%
Alaska             68.5%      69.3%     -1.2%    6.1%        5.4%       13.6%   1.0%        0.9%         7.6%
New Jersey         70.2%      72.5%     -3.1%    7.9%        6.3%       25.0%   0.1%        0.1%        -52.5%
Alabama            70.3%      71.1%     -1.1%    1.2%        0.9%       31.6%   0.1%        0.1%         5.7%
New Mexico         70.3%      66.8%      5.3%    1.7%        1.5%       15.5%   0.1%        0.2%        -38.3%
North Carolina     70.5%      72.1%     -2.2%    2.2%        1.7%       28.5%   0.1%        0.1%        -10.5%
Virginia           70.7%      72.3%     -2.2%    5.4%        4.4%       23.9%   0.1%        0.1%         -3.9%
Texas              71.8%      71.0%      1.2%    3.7%        3.2%       18.9%   0.1%        0.1%        -12.2%
Illinois           71.9%      73.5%     -2.1%    4.6%        3.9%       18.8%   0.1%        0.1%        -45.4%
Delaware           72.5%      74.6%     -2.8%    3.3%        2.4%       32.8%   0.1%        0.1%        -19.5%
Nevada             75.0%      75.2%     -0.3%    7.4%        5.9%       26.0%   0.9%        0.8%         5.1%
Oklahoma           75.4%      76.1%     -0.9%    2.0%        1.7%       15.5%   0.2%        0.2%         18.2%
Florida            76.6%      78.0%     -1.8%    2.7%        2.1%       26.8%   0.1%        0.2%        -35.2%
Arizona            77.6%      75.5%      2.8%    3.0%        2.4%       26.1%   0.3%        0.3%         10.6%
Arkansas           78.5%      79.9%     -1.8%    1.3%        1.0%       34.7%   0.1%        0.1%         -9.6%
Tennessee          79.2%      80.2%     -1.3%    1.6%        1.2%       26.9%   0.1%        0.1%         4.9%
Michigan           79.7%      80.1%     -0.5%    2.6%        2.1%       23.8%   0.1%        0.1%        -23.8%
Connecticut        79.9%      81.6%     -2.0%    3.8%        2.9%       31.5%   0.1%        0.1%        -42.0%
Washington         80.4%      81.7%     -1.5%    7.9%        6.9%       14.0%   0.7%        0.7%         -1.5%
Rhode Island       82.8%      85.0%     -2.6%    3.0%        2.8%        9.6%   0.0%        0.2%        -73.7%
Massachusetts      82.8%      84.5%     -2.0%    5.2%        4.3%       22.5%   0.1%        0.1%        -53.2%
Colorado           83.7%      82.7%      1.2%    3.3%        2.9%       13.1%   0.2%        0.2%        -17.5%
Pennsylvania       83.8%      85.4%     -1.9%    2.6%        2.1%       26.5%   0.0%        0.1%        -35.3%
Missouri           83.9%      84.8%     -1.1%    1.7%        1.4%       25.3%   0.1%        0.1%         7.7%
Ohio               84.0%      84.9%     -1.1%    1.8%        1.4%       23.0%   0.1%        0.1%        -19.1%
White Only                At least part-Asian      At least part-Pacific Islander
     Geography   2009 ACS 2000 Census Percent 2009 ACS 2000 Census Percent 2009 ACS 2000 Census Percent
                                      Change                          Change                          Change
Indiana           85.7%      87.4%     -2.0%    1.6%        1.2%       31.7% 0.1%         0.1%        -14.7%
Kansas            85.8%      86.0%     -0.3%    2.5%        2.1%       18.5% 0.1%         0.1%         -7.6%
Oregon            86.2%      86.4%     -0.2%    4.4%        3.9%       14.0% 0.5%         0.5%         1.8%
South Dakota      87.0%      88.7%     -1.9%    1.1%        0.8%       30.7% 0.1%         0.1%        -15.9%
Minnesota         87.7%      89.5%     -2.0%    4.0%        3.4%       18.3% 0.1%         0.1%        -28.1%
Wisconsin         87.7%      89.0%     -1.4%    2.3%        2.0%       19.4% 0.1%         0.1%        -30.8%
Nebraska          88.7%      89.6%     -1.1%    1.9%        1.6%       21.5% 0.1%         0.1%         42.5%
Kentucky          89.0%      90.0%     -1.2%    1.2%        0.9%       29.9% 0.1%         0.1%         24.5%
Montana           89.5%      90.6%     -1.2%    1.0%        0.8%       24.1% 0.2%         0.1%         34.3%
Utah              89.6%      89.2%     0.5%     2.6%        2.3%       14.5% 1.0%         1.0%         2.6%
North Dakota      90.7%      92.5%     -1.9%    1.1%        0.8%       38.5% 0.1%         0.1%         19.0%
Wyoming           91.5%      92.0%     -0.5%    1.0%        0.8%       17.9% 0.1%         0.1%        -21.4%
Idaho             92.1%      90.9%     1.3%     1.7%        1.4%       21.5% 0.3%         0.2%         22.7%
Iowa              92.6%      94.0%     -1.4%    1.8%        1.5%       20.8% 0.1%         0.1%        -22.7%
West Virginia     94.2%      95.0%     -0.8%    0.8%        0.7%       19.7% 0.1%         0.1%         1.3%
New Hampshire     94.8%      96.0%     -1.3%    2.2%        1.6%       38.5% 0.1%         0.1%        -15.9%
Maine             95.3%      97.0%     -1.8%    1.2%        1.0%       24.9% 0.0%         0.1%        -43.1%
Vermont           96.0%      96.7%     -0.7%    1.4%        1.1%       21.9% 0.0%         0.1%        -36.6%

Contenu connexe

Similaire à States Race

Languages Spoken in the Home — 2009 Breakdown
Languages Spoken in the Home — 2009 BreakdownLanguages Spoken in the Home — 2009 Breakdown
Languages Spoken in the Home — 2009 BreakdownHonolulu Civil Beat
 
10-Year Changes — Housing Occupancy
10-Year Changes — Housing Occupancy10-Year Changes — Housing Occupancy
10-Year Changes — Housing OccupancyHonolulu Civil Beat
 
Multiculturalism in Canada: What Census 2016 and Other Data Tell Us
Multiculturalism in Canada:  What Census 2016 and Other Data Tell UsMulticulturalism in Canada:  What Census 2016 and Other Data Tell Us
Multiculturalism in Canada: What Census 2016 and Other Data Tell UsAndrew Griffith
 
Literacy rate 2011 the onlinegk
Literacy rate 2011   the onlinegkLiteracy rate 2011   the onlinegk
Literacy rate 2011 the onlinegkRajesh Ahuja
 
Décima octava encuesta presidencia de la republica
Décima octava encuesta presidencia de la republicaDécima octava encuesta presidencia de la republica
Décima octava encuesta presidencia de la republicaDesde Puebla
 
Census 2016 and IRCC Data What it Says About Naturalization in Canada
Census 2016 and IRCC Data What it Says About Naturalization in Canada Census 2016 and IRCC Data What it Says About Naturalization in Canada
Census 2016 and IRCC Data What it Says About Naturalization in Canada Andrew Griffith
 
NCFS - C5 T5 PG1-19
NCFS - C5 T5 PG1-19NCFS - C5 T5 PG1-19
NCFS - C5 T5 PG1-19LBG
 
NCAHD 2016 Products services
NCAHD 2016 Products servicesNCAHD 2016 Products services
NCAHD 2016 Products servicesAnn Peton
 

Similaire à States Race (20)

Citizenship entry
Citizenship entryCitizenship entry
Citizenship entry
 
Hawaii Towns Departure Time
Hawaii Towns Departure TimeHawaii Towns Departure Time
Hawaii Towns Departure Time
 
States — Place of Birth
States — Place of BirthStates — Place of Birth
States — Place of Birth
 
Race Breakdown 2000
Race Breakdown 2000Race Breakdown 2000
Race Breakdown 2000
 
Languages Spoken in the Home — 2009 Breakdown
Languages Spoken in the Home — 2009 BreakdownLanguages Spoken in the Home — 2009 Breakdown
Languages Spoken in the Home — 2009 Breakdown
 
Race Breakdown 2009
Race Breakdown 2009Race Breakdown 2009
Race Breakdown 2009
 
State Transportation Rankings
State Transportation RankingsState Transportation Rankings
State Transportation Rankings
 
10-Year Changes — Housing Occupancy
10-Year Changes — Housing Occupancy10-Year Changes — Housing Occupancy
10-Year Changes — Housing Occupancy
 
Educational Attainment by Age
Educational Attainment by AgeEducational Attainment by Age
Educational Attainment by Age
 
Students Reporting Use of Selected Substances in the Last 30 Days
Students Reporting Use of Selected Substances in the Last 30 Days Students Reporting Use of Selected Substances in the Last 30 Days
Students Reporting Use of Selected Substances in the Last 30 Days
 
Home Value State Rankings
Home Value State RankingsHome Value State Rankings
Home Value State Rankings
 
Occupancy Stats
Occupancy StatsOccupancy Stats
Occupancy Stats
 
Multiculturalism in Canada: What Census 2016 and Other Data Tell Us
Multiculturalism in Canada:  What Census 2016 and Other Data Tell UsMulticulturalism in Canada:  What Census 2016 and Other Data Tell Us
Multiculturalism in Canada: What Census 2016 and Other Data Tell Us
 
Literacy rate 2011 the onlinegk
Literacy rate 2011   the onlinegkLiteracy rate 2011   the onlinegk
Literacy rate 2011 the onlinegk
 
Décima octava encuesta presidencia de la republica
Décima octava encuesta presidencia de la republicaDécima octava encuesta presidencia de la republica
Décima octava encuesta presidencia de la republica
 
Census 2016 and IRCC Data What it Says About Naturalization in Canada
Census 2016 and IRCC Data What it Says About Naturalization in Canada Census 2016 and IRCC Data What it Says About Naturalization in Canada
Census 2016 and IRCC Data What it Says About Naturalization in Canada
 
NCFS - C5 T5 PG1-19
NCFS - C5 T5 PG1-19NCFS - C5 T5 PG1-19
NCFS - C5 T5 PG1-19
 
U.S. States Median Rent
U.S. States Median RentU.S. States Median Rent
U.S. States Median Rent
 
Pm
PmPm
Pm
 
NCAHD 2016 Products services
NCAHD 2016 Products servicesNCAHD 2016 Products services
NCAHD 2016 Products services
 

Plus de Honolulu Civil Beat

Gov. David Ige response to U.S. Rep. Anna Eshoo
Gov. David Ige response to U.S. Rep. Anna EshooGov. David Ige response to U.S. Rep. Anna Eshoo
Gov. David Ige response to U.S. Rep. Anna EshooHonolulu Civil Beat
 
Audit of the Department of the Honolulu Prosecuting Attorney’s Policies, Proc...
Audit of the Department of the Honolulu Prosecuting Attorney’s Policies, Proc...Audit of the Department of the Honolulu Prosecuting Attorney’s Policies, Proc...
Audit of the Department of the Honolulu Prosecuting Attorney’s Policies, Proc...Honolulu Civil Beat
 
Audit of the Honolulu Police Department’s Policies, Procedures, and Controls
Audit of the Honolulu Police Department’s Policies, Procedures, and ControlsAudit of the Honolulu Police Department’s Policies, Procedures, and Controls
Audit of the Honolulu Police Department’s Policies, Procedures, and ControlsHonolulu Civil Beat
 
2019 Use of Force Annual Report HPD
2019 Use of Force Annual Report HPD 2019 Use of Force Annual Report HPD
2019 Use of Force Annual Report HPD Honolulu Civil Beat
 
Office of Health Equity Goals Draft 10
Office of Health Equity Goals Draft 10Office of Health Equity Goals Draft 10
Office of Health Equity Goals Draft 10Honolulu Civil Beat
 
ACLU Letter to HPD regarding racial profiling
ACLU Letter to HPD regarding racial profilingACLU Letter to HPD regarding racial profiling
ACLU Letter to HPD regarding racial profilingHonolulu Civil Beat
 
ACLU Letter to HPD regarding racial profiling
ACLU Letter to HPD regarding racial profilingACLU Letter to HPD regarding racial profiling
ACLU Letter to HPD regarding racial profilingHonolulu Civil Beat
 
Guam Governor's Letter to Pence
Guam Governor's Letter to Pence Guam Governor's Letter to Pence
Guam Governor's Letter to Pence Honolulu Civil Beat
 
List Of Pro Bono Legal Service Providers
List Of Pro Bono Legal Service ProvidersList Of Pro Bono Legal Service Providers
List Of Pro Bono Legal Service ProvidersHonolulu Civil Beat
 
Arbitration Hearing Transcript December 2018
Arbitration Hearing Transcript December 2018Arbitration Hearing Transcript December 2018
Arbitration Hearing Transcript December 2018Honolulu Civil Beat
 

Plus de Honolulu Civil Beat (20)

Gov. David Ige response to U.S. Rep. Anna Eshoo
Gov. David Ige response to U.S. Rep. Anna EshooGov. David Ige response to U.S. Rep. Anna Eshoo
Gov. David Ige response to U.S. Rep. Anna Eshoo
 
Audit of the Department of the Honolulu Prosecuting Attorney’s Policies, Proc...
Audit of the Department of the Honolulu Prosecuting Attorney’s Policies, Proc...Audit of the Department of the Honolulu Prosecuting Attorney’s Policies, Proc...
Audit of the Department of the Honolulu Prosecuting Attorney’s Policies, Proc...
 
Audit of the Honolulu Police Department’s Policies, Procedures, and Controls
Audit of the Honolulu Police Department’s Policies, Procedures, and ControlsAudit of the Honolulu Police Department’s Policies, Procedures, and Controls
Audit of the Honolulu Police Department’s Policies, Procedures, and Controls
 
2019 Use of Force Annual Report HPD
2019 Use of Force Annual Report HPD 2019 Use of Force Annual Report HPD
2019 Use of Force Annual Report HPD
 
Office of Health Equity Goals Draft 10
Office of Health Equity Goals Draft 10Office of Health Equity Goals Draft 10
Office of Health Equity Goals Draft 10
 
NHPI COVID-19 Statement
NHPI COVID-19 StatementNHPI COVID-19 Statement
NHPI COVID-19 Statement
 
DLIR Response Language Access
DLIR Response Language AccessDLIR Response Language Access
DLIR Response Language Access
 
Language Access Letter To DLIR
Language Access Letter To DLIRLanguage Access Letter To DLIR
Language Access Letter To DLIR
 
ACLU Letter to HPD regarding racial profiling
ACLU Letter to HPD regarding racial profilingACLU Letter to HPD regarding racial profiling
ACLU Letter to HPD regarding racial profiling
 
ACLU Letter to HPD regarding racial profiling
ACLU Letter to HPD regarding racial profilingACLU Letter to HPD regarding racial profiling
ACLU Letter to HPD regarding racial profiling
 
Jane Doe v. Rehab Hospital
Jane Doe v. Rehab HospitalJane Doe v. Rehab Hospital
Jane Doe v. Rehab Hospital
 
Coronavirus HPHA
Coronavirus HPHA Coronavirus HPHA
Coronavirus HPHA
 
OHA Data Request
OHA Data RequestOHA Data Request
OHA Data Request
 
Letter from Palau to Guam
Letter from Palau to GuamLetter from Palau to Guam
Letter from Palau to Guam
 
Guam Governor's Letter to Pence
Guam Governor's Letter to Pence Guam Governor's Letter to Pence
Guam Governor's Letter to Pence
 
OHA Analysis by Akina
OHA Analysis by AkinaOHA Analysis by Akina
OHA Analysis by Akina
 
Case COFA Letter
Case COFA LetterCase COFA Letter
Case COFA Letter
 
List Of Pro Bono Legal Service Providers
List Of Pro Bono Legal Service ProvidersList Of Pro Bono Legal Service Providers
List Of Pro Bono Legal Service Providers
 
Arbitration Hearing Transcript December 2018
Arbitration Hearing Transcript December 2018Arbitration Hearing Transcript December 2018
Arbitration Hearing Transcript December 2018
 
Caldwell Press Release
Caldwell Press ReleaseCaldwell Press Release
Caldwell Press Release
 

States Race

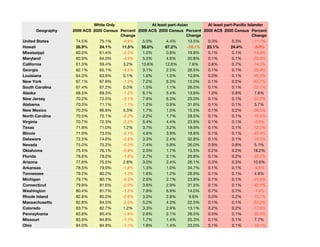
  • 1. White Only At least part-Asian At least part-Pacific Islander Geography 2009 ACS 2000 Census Percent 2009 ACS 2000 Census Percent 2009 ACS 2000 Census Percent Change Change Change United States 74.5% 75.1% -0.9% 5.0% 4.4% 13.5% 0.3% 0.3% -11.7% Hawaii 26.9% 24.1% 11.5% 55.0% 67.2% -18.1% 23.1% 24.4% -5.0% Mississippi 60.0% 61.4% -2.2% 1.0% 0.8% 19.8% 0.1% 0.1% -14.9% Maryland 60.9% 64.0% -4.9% 5.5% 4.6% 20.8% 0.1% 0.1% -23.4% California 61.3% 59.4% 3.2% 13.6% 12.6% 7.6% 0.6% 0.7% -14.3% Georgia 62.1% 65.1% -4.5% 3.1% 2.5% 26.5% 0.1% 0.1% -25.8% Louisiana 64.0% 63.9% 0.1% 1.6% 1.5% 10.9% 0.0% 0.1% -40.2% New York 67.1% 67.9% -1.2% 7.2% 6.3% 15.0% 0.1% 0.2% -65.7% South Carolina 67.4% 67.2% 0.3% 1.5% 1.1% 26.5% 0.1% 0.1% -22.7% Alaska 68.5% 69.3% -1.2% 6.1% 5.4% 13.6% 1.0% 0.9% 7.6% New Jersey 70.2% 72.5% -3.1% 7.9% 6.3% 25.0% 0.1% 0.1% -52.5% Alabama 70.3% 71.1% -1.1% 1.2% 0.9% 31.6% 0.1% 0.1% 5.7% New Mexico 70.3% 66.8% 5.3% 1.7% 1.5% 15.5% 0.1% 0.2% -38.3% North Carolina 70.5% 72.1% -2.2% 2.2% 1.7% 28.5% 0.1% 0.1% -10.5% Virginia 70.7% 72.3% -2.2% 5.4% 4.4% 23.9% 0.1% 0.1% -3.9% Texas 71.8% 71.0% 1.2% 3.7% 3.2% 18.9% 0.1% 0.1% -12.2% Illinois 71.9% 73.5% -2.1% 4.6% 3.9% 18.8% 0.1% 0.1% -45.4% Delaware 72.5% 74.6% -2.8% 3.3% 2.4% 32.8% 0.1% 0.1% -19.5% Nevada 75.0% 75.2% -0.3% 7.4% 5.9% 26.0% 0.9% 0.8% 5.1% Oklahoma 75.4% 76.1% -0.9% 2.0% 1.7% 15.5% 0.2% 0.2% 18.2% Florida 76.6% 78.0% -1.8% 2.7% 2.1% 26.8% 0.1% 0.2% -35.2% Arizona 77.6% 75.5% 2.8% 3.0% 2.4% 26.1% 0.3% 0.3% 10.6% Arkansas 78.5% 79.9% -1.8% 1.3% 1.0% 34.7% 0.1% 0.1% -9.6% Tennessee 79.2% 80.2% -1.3% 1.6% 1.2% 26.9% 0.1% 0.1% 4.9% Michigan 79.7% 80.1% -0.5% 2.6% 2.1% 23.8% 0.1% 0.1% -23.8% Connecticut 79.9% 81.6% -2.0% 3.8% 2.9% 31.5% 0.1% 0.1% -42.0% Washington 80.4% 81.7% -1.5% 7.9% 6.9% 14.0% 0.7% 0.7% -1.5% Rhode Island 82.8% 85.0% -2.6% 3.0% 2.8% 9.6% 0.0% 0.2% -73.7% Massachusetts 82.8% 84.5% -2.0% 5.2% 4.3% 22.5% 0.1% 0.1% -53.2% Colorado 83.7% 82.7% 1.2% 3.3% 2.9% 13.1% 0.2% 0.2% -17.5% Pennsylvania 83.8% 85.4% -1.9% 2.6% 2.1% 26.5% 0.0% 0.1% -35.3% Missouri 83.9% 84.8% -1.1% 1.7% 1.4% 25.3% 0.1% 0.1% 7.7% Ohio 84.0% 84.9% -1.1% 1.8% 1.4% 23.0% 0.1% 0.1% -19.1%
  • 2. White Only At least part-Asian At least part-Pacific Islander Geography 2009 ACS 2000 Census Percent 2009 ACS 2000 Census Percent 2009 ACS 2000 Census Percent Change Change Change Indiana 85.7% 87.4% -2.0% 1.6% 1.2% 31.7% 0.1% 0.1% -14.7% Kansas 85.8% 86.0% -0.3% 2.5% 2.1% 18.5% 0.1% 0.1% -7.6% Oregon 86.2% 86.4% -0.2% 4.4% 3.9% 14.0% 0.5% 0.5% 1.8% South Dakota 87.0% 88.7% -1.9% 1.1% 0.8% 30.7% 0.1% 0.1% -15.9% Minnesota 87.7% 89.5% -2.0% 4.0% 3.4% 18.3% 0.1% 0.1% -28.1% Wisconsin 87.7% 89.0% -1.4% 2.3% 2.0% 19.4% 0.1% 0.1% -30.8% Nebraska 88.7% 89.6% -1.1% 1.9% 1.6% 21.5% 0.1% 0.1% 42.5% Kentucky 89.0% 90.0% -1.2% 1.2% 0.9% 29.9% 0.1% 0.1% 24.5% Montana 89.5% 90.6% -1.2% 1.0% 0.8% 24.1% 0.2% 0.1% 34.3% Utah 89.6% 89.2% 0.5% 2.6% 2.3% 14.5% 1.0% 1.0% 2.6% North Dakota 90.7% 92.5% -1.9% 1.1% 0.8% 38.5% 0.1% 0.1% 19.0% Wyoming 91.5% 92.0% -0.5% 1.0% 0.8% 17.9% 0.1% 0.1% -21.4% Idaho 92.1% 90.9% 1.3% 1.7% 1.4% 21.5% 0.3% 0.2% 22.7% Iowa 92.6% 94.0% -1.4% 1.8% 1.5% 20.8% 0.1% 0.1% -22.7% West Virginia 94.2% 95.0% -0.8% 0.8% 0.7% 19.7% 0.1% 0.1% 1.3% New Hampshire 94.8% 96.0% -1.3% 2.2% 1.6% 38.5% 0.1% 0.1% -15.9% Maine 95.3% 97.0% -1.8% 1.2% 1.0% 24.9% 0.0% 0.1% -43.1% Vermont 96.0% 96.7% -0.7% 1.4% 1.1% 21.9% 0.0% 0.1% -36.6%