Q3 2020 | The Woodlands Office | Research Snapshot
•
0 likes•24 views

The Woodlands office submarket slowed by pandemic during Q3 2020

Recommended
Recommended
More Related Content
What's hot
What's hot (19)
Similar to Q3 2020 | The Woodlands Office | Research Snapshot
Similar to Q3 2020 | The Woodlands Office | Research Snapshot (20)
More from Colliers International | Houston
More from Colliers International | Houston (20)
Recently uploaded
Recently uploaded (20)
Q3 2020 | The Woodlands Office | Research Snapshot
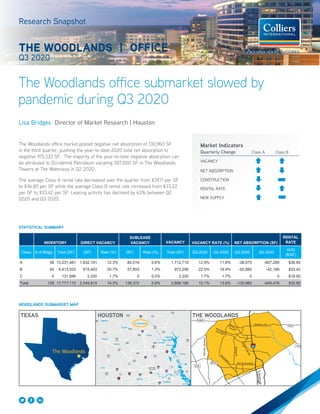
- 1. Market Indicators Quarterly Change Class A Class B VACANCY NET ABSORPTION CONSTRUCTION RENTAL RATE NEW SUPPLY The Woodlands Trinity Bay Galveston Bay 225 Bellaire The Woodlands Pasadena IAH EFD HOU Cypress Katy Brookshire Lake Houston La Porte 146 League City Kingwood Spring Pearland 35 35 Richmond Waller Hockley 242 1488 1488 Conroe Magnolia Willis Lake Conroe Crosby CBD Ship Channel Clear Lake Baytown Mont Belvieu Dayton 149 149 Cleveland 105 105 105 321 330 Alvin Humble Atascocita Sugar Land Tomball 2920 2920 2920 The Woodlands office submarket slowed by pandemic during Q3 2020 Research Snapshot THE WOODLANDS | OFFICE Q3 2020 STATISTICAL SUMMARY 1488 2920 249 1314 242 Huffsmith-Kohrville WoodlandsParkway ResearchForest Needham Rd. Grogan’sMillRd. Spring Stuebner GoslingRd. Kuykendahl ToHoustonCBD WOODLANDS SUBMARKET MAP VACANCY RENTAL RATE Class # of Bldgs. Total (SF) (SF) Rate (%) (SF) Rate (%) Total (SF) Q3-2020 Q2-2020 Q3-2020 Q2-2020 AVG ($/SF) A 58 13,231,481 1,632,191 12.3% 80,519 0.6% 1,712,710 12.9% 11.8% -38,075 -607,290 $36.85 B 64 4,413,933 915,403 20.7% 57,853 1.3% 973,256 22.0% 19.9% -92,885 -42,189 $33.42 C 6 131,696 2,220 1.7% 0 0.0% 2,220 1.7% 1.7% 0 0 $18.50 Total 128 17,777,110 2,549,814 14.3% 138,372 0.8% 2,688,186 15.1% 13.6% -130,960 -649,479 $35.60 DIRECT VACANCY SUBLEASE VACANCY VACANCY RATE (%) NET ABSORPTION (SF)INVENTORY The Woodlands office market posted negative net absorption of 130,960 SF in the third quarter, pushing the year-to-date 2020 total net absorption to negative 915,333 SF. The majority of the year-to-date negative absorption can be attributed to Occidental Petroleum vacating 587,000 SF in The Woodlands Towers at The Waterway in Q2 2020. The average Class A rental rate decreased over the quarter from $39.11 per SF to $36.85 per SF while the average Class B rental rate increased from $33.22 per SF to $33.42 per SF. Leasing activity has declined by 43% between Q2 2020 and Q3 2020. Lisa Bridges Director of Market Research | Houston HOUSTONTEXAS THE WOODLANDS
- 2. 2 The Woodlands Research Snapshot | Q3 2020 | Office | Colliers International2 The average quoted rental rates are a mix of direct and sublet rates and are based on a blend of gross and NNN. The graphs below are only intended to show rental rate trends. Actual gross rates are higher than the average rate shown in the graph. 0.0 5.0 10.0 15.0 20.0 25.0 $18.00 $20.00 $22.00 $24.00 $26.00 $28.00 $30.00 $32.00 $34.00 Class B Rental Rate and Vacancy Percentage The Woodlands, TX Class B Rents Class B Vacancy *Vacancy percentage includes direct and sublease space. 0 50,000 100,000 150,000 200,000 250,000 300,000 350,000 400,000 Available Sublease Space The Woodlands Class A Class B Available Sublease Space Q3 2020 Class A: 371,974 SF or 2.8% Class B: 79,878 SF or 1.6% 0.0 2.0 4.0 6.0 8.0 10.0 12.0 14.0 16.0 $24.00 $26.00 $28.00 $30.00 $32.00 $34.00 $36.00 $38.00 $40.00 Class A Rental Rate and Vacancy Percentage The Woodlands, TX Class A Rents Class A Vacancy *Vacancy percentage includes direct and sublease space.
- 3. 3 North American Research & Forecast Report | Q4 2014 | Office Market Outlook | Colliers International Copyright © 2015 Colliers International. The information contained herein has been obtained from sources deemed reliable. While every reasonable effort has been made to ensure its accuracy, we cannot guarantee it. No responsibility is assumed for any inaccuracies. Readers are encouraged to consult their professional advisors prior to acting on any of the material contained in this report. Colliers International | Market 000 Address, Suite # 000 Address, Suite # +1 000 000 0000 colliers.com/<<market>> FOR MORE INFORMATION Lisa Bridges Director of Market Research | Houston +1 713 830 2125 lisa.bridges@colliers.com 3 North American Research & Forecast Report | Q4 2014 | Office Market Outlook | Colliers International Copyright © 2015 Colliers International. The information contained herein has been obtained from sources deemed reliable. While every reasonable effort has been made to ensure its accuracy, we cannot guarantee it. No responsibility is assumed for any inaccuracies. Readers are encouraged to consult their professional advisors prior to acting on any of the material contained in this report. Colliers International | Market 000 Address, Suite # 000 Address, Suite # +1 000 000 0000 colliers.com/<<market>> 3 North American Research & Forecast Report | Q4 2014 | Office Market Outlook | Colliers International Copyright © 2020 Colliers International. The information contained herein has been obtained from sources deemed reliable. While every reasonable effort has been made to ensure its accuracy, we cannot guarantee it. No responsibility is assumed for any inaccuracies. Readers are encouraged to consult their professional advisors prior to acting on any of the material contained in this report. Colliers International | The Woodlands 1790 Hughes Landing Blvd., Suite 250 The Woodlands, TX 77380 +1 713 830 4011 colliers.com/thewoodlands Absorption and New Supply WOODLANDS CLASS A OFFICE WOODLANDS CLASS B OFFICE -800,000 -600,000 -400,000 -200,000 0 200,000 400,000 600,000 800,000 1,000,000 1,200,000 1,400,000 1,600,000 1,800,000 2,000,000 2,200,000 2,400,000 2,600,000 Net Absorption New Supply -500,000 -400,000 -300,000 -200,000 -100,000 0 100,000 200,000 Net Absorption New Supply
- 4. Our philosophy revolves around the fact that the best possible results come from linking our global enterprise with local advisors who understand your business, your market, and how to integrate real estate into a successful business strategy. C O L L I E R S I N T E R N A T I O N A L G L O B A L L O C A T I O N S COMMERCIAL REAL ESTATE SECTORS REPRESENTED OFFICE INDUSTRIAL LAND RETAIL HEALTHCARE MULTIFAMILY HOTEL $129BTRANSACTION VALUE 2BSF UNDER MANAGEMENT $3.5BIN REVENUE 443OFFICES 18,700PROFESSIONALS 430ACCREDITED MEMBERS 68COUNTRIES SIOR ADVANTAGE Colliers International (NASDAQ, TSX: CIGI) is a leading real estate professional services and investment management company. With operations in 68 countries, our more than 15,000 enterprising professionals work collaboratively to provide expert advice to maximize the value of property for real estate occupiers, owners and investors. For more than 25 years, our experienced leadership, owning approximately 40% of our equity, has delivered compound annual investment returns of almost 20% for shareholders. In 2019, corporate revenues were more than $3.0 billion ($3.5 billion including affiliates), with $33 billion of assets under management in our investment management segment. Learn more about how we accelerate success at corporate.colliers.com, Twitter @Colliers or LinkedIn. Colliers professionals think differently, share great ideas and offer thoughtful and innovative advice to accelerate the success of its clients. Colliers has been ranked among the top 100 global outsourcing firms by the International Association of Outsourcing Professionals for 13 consecutive years, more than any other real estate services firm. Colliers is ranked the number one property manager in the world by Commercial Property Executive for two years in a row. PROPERTY POSITIONING & MARKETING REAL ESTATEINVESTMENT VALUATION& ADVISORY CORPORATE SOLUTIONS MANAGEMENT REALESTATE REPRESENTATION LANDLORD REPRESENTATION TENANT LOCA TION INTELLIGENCE MA RKET RESEARCH& CAPITAL MARKETS PROJECT MANAGEMENT COLLIERS SPECIALIZATIONS and REAL ESTATE SERVICE REPRESENTATION DATACENTERS HE ALTHCARE HOTELS & HOSPITALITY SERVICES IND USTRIAL LAND HOUSING&MULTIFAMILY SER VICES MARINA, LEISURE & GOLF COURSE OFFICE RETAIL SPECIALPURPOSE