Houston Office Market Report Q2 2012
•
1 like•302 views

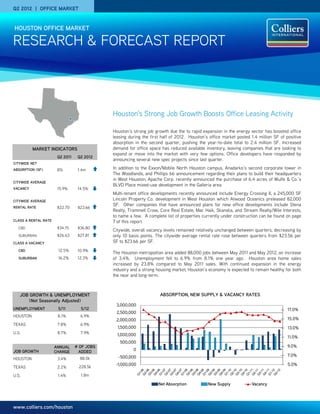
Houston's office market saw strong positive absorption in Q2 2012, driven by job growth in the energy sector. Net absorption was 1.4 million SF, pushing the YTD total to 2.4 million SF. Vacancy rates decreased slightly, while average rental rates rose between quarters. Several companies announced plans for new office developments to address the reduced available inventory due to increased demand for space.

Recommended
Recommended
More Related Content
What's hot
What's hot (20)
Viewers also liked
Viewers also liked (16)
Similar to Houston Office Market Report Q2 2012
Similar to Houston Office Market Report Q2 2012 (20)
More from Coy Davidson
More from Coy Davidson (20)
Recently uploaded
Recently uploaded (20)
Houston Office Market Report Q2 2012
- 1. Q2 2012 | OFFICE MARKET HOUSTON OFFICE MARKET RESEARCH & FORECAST REPORT Houston’s Strong Job Growth Boosts Office Leasing Activity Houston’s strong job growth due the to rapid expansion in the energy sector has boosted office leasing during the first half of 2012. Houston’s office market posted 1.4 million SF of positive absorption in the second quarter, pushing the year-to-date total to 2.4 million SF. Increased MARKET INDICATORS demand for office space has reduced available inventory, leaving companies that are looking to expand or move into the market with very few options. Office developers have responded by Q2 2011 Q2 2012 announcing several new spec projects since last quarter. CITYWIDE NET ABSORPTION (SF) 81k 1.4m In addition to the Exxon/Mobile North Houston campus, Anadarko’s second corporate tower in The Woodlands, and Phillips 66 announcement regarding their plans to build their headquarters in West Houston, Apache Corp. recently announced the purchase of 6.4 acres of Wulfe & Co.’s ) CITYWIDE AVERAGE BLVD Place mixed-use development in the Galleria area. VACANCY 15.9% 14.5% Multi-tenant office developments recently announced include Energy Crossing II, a 245,000 SF CITYWIDE AVERAGE Lincoln Property Co. development in West Houston which Atwood Oceanics preleased 82,000 SF. Other companies that have announced plans for new office developments include Stena RENTAL RATE $22.70 $23.66 Realty, Trammell Crow, Core Real Estate, Mac Haik, Skanska, and Stream Realty/Wile Interests, to name a few. A complete list of properties currently under construction can be found on page CLASS A RENTAL RATE 7 of this report. CBD $34.15 $36.80 Citywide, overall vacancy levels remained relatively unchanged between quarters, decreasing by SUBURBAN $26.63 $27.81 only 10 basis points. The citywide average rental rate rose between quarters from $23.56 per CLASS A VACANCY SF to $23.66 per SF. CBD 12.5% 10.9% The Houston metropolitan area added 88,000 jobs between May 2011 and May 2012, an increase SUBURBAN 16.2% 12.3% of 3.4%. Unemployment fell to 6.9% from 8.1% one year ago. Houston area home sales increased by 23.8% compared to May 2011 sales. With continued expansion in the energy industry and a strong housing market, Houston’s economy is expected to remain healthy for both the near and long-term. JOB GROWTH & UNEMPLOYMENT ABSORPTION, NEW SUPPLY & VACANCY RATES (Not Seasonally Adjusted) 3,000,000 UNEMPLOYMENT 5/11 5/12 17.0% 2,500,000 HOUSTON 8.1% 6.9% 2,000,000 15.0% TEXAS 7.8% 6.9% 1,500,000 13.0% U.S. 8.7% 7.9% 1,000,000 11.0% 500,000 ANNUAL # OF JOBS 9.0% JOB GROWTH CHANGE ADDED 0 -500,000 7.0% HOUSTON 3.4% 88.0k -1,000,000 5.0% TEXAS 2.2% 228.5k U.S. 1.4% 1.8m Net Absorption New Supply Vacancy www.colliers.com/houston
- 2. RESEARCH & FORECAST REPORT | Q2 2012 | HOUSTON OFFICE MARKET VACANCY & AVAILABILITY 1,370,080 SF in the second quarter, pushing the Overall vacancy rates decreased by 10 basis year-to-date absorption total to 2,444,573 SF. CBD VS. SUBURBAN points to 14.5% from 14.6% on a quarterly Contributing to the second quarter’s positive CLASS A OFFICE VACANCY basis. The average suburban vacancy rate gain was suburban Class A space with a 20.0% decreased by 20 basis points to 14.5% from positive net absorption of 924,290 SF, followed 18.0% 14.7% the previous quarter, while CBD vacancy by CBD Class A space with positive net 16.0% increased by 10 basis points to 14.4% from absorption of 85,266 SF. Some of the larger 14.0% 14.3%. On a year-over-year basis, the city-wide tenants that moved into their space or expanded 12.0% vacancy rate decreased by 140 basis points to into additional space during the second quarter 10.0% 14.5% from 15.9%. The suburban vacancy rate included Apache Corporation with 65,000 8.0% decreased by 140 basis points to 14.5% from SF, Dynegy Inc. with 62,261 SF, WorleyParsons 6.0% 15.9%, and the CBD vacancy rate decreased by with 50,716 SF Rockwater Energy Solutions 4.0% 160 basis points to 14.4% from 16.0%. with 44,666 SF, National Oilwell Varco with 42,296 SF, and BP 40,537 SF. The CBD Class A vacancy rate decreased by 40 basis points to 10.9% from 11.3% between RENTAL RATES CBD VACANCY SUBURBAN VACANCY quarters, while the CBD Class B vacancy rate The average citywide rental rate rose between increased 170 basis points to 19.2% from quarters to $23.66 from $23.56 per square 17.5%. The suburban Class A vacancy rate foot. The CBD Class A average quoted rental decreased by 10 basis points to 12.3% from rate increased to $36.80 from $36.42 per 12.4% between quarters, while the suburban square foot, while the suburban Class A CLASS A OFFICE RENTS Class B vacancy rate decreased to 16.9% from average quoted rental rate decreased to $27.81 $40.00 17.3%. from $28.86 per square foot. $38.00 Citywide, a total of 37 office properties have a The CBD Class B average quoted rental rate $36.00 minimum of 100,000 SF available for decreased slightly to $23.61 from $23.81 per $34.00 occupancy within 18 months, including both square foot, while the suburban Class B $32.00 direct and sublease space. Only 14 of these average quoted rental rate decreased to $18.54 properties have over 200,000 SF available. from $19.05 per square foot between quarters. $30.00 Available sublease space totals 1.5 million SF or On a year-over-year basis the citywide average $28.00 0.7% of total inventory, of which 0.9 million SF quoted rental rate increased by 4.2% to $23.66 $26.00 is currently vacant. from $22.70 per square foot. ABSORPTION & DEMAND Houston recorded positive net absorption of CBD RENTS SUBURBAN RENTS QUOTED GROSS RENTAL RATES FOR TOP PERFORMING OFFICE BUILDINGS YEAR AVAIL. RENT BUILDING NAME ADDRESS SUBMARKET RBA (SF) LEASED OWNER BUILT SF ($/SF) 5 Houston Center 1401 McKinney St CBD 600,000 2002 98.0% 71,414 $42.66 Wells Real Estate Funds 1000 Main 1000 Main St CBD 837,161 2003 98.3% 22,420 $42.00 INVESCO Heritage Plaza 1111 Bagby CBD 1,089,266 1986 96.1% 42,403 $41.94 Brookfield Office Properties BG Group Place 811 Main CBD 972,474 2011 70.1% 291,079 $41.87 CalPERS/Hines Wells Fargo Bank Tower 1300 Post Oak Blvd. Galleria 491,254 1983 94.1% 33,136 $40.15 TIAA-CREF Williams Tower 2800 Post Oak Blvd Galleria 1,476,973 1983 98.5% 72,844 $37.66 Hines Holdings Inc. 9 Greenway Plaza 9 Greenway Greenway 746,824 1978 94.3% 66,522 $31.90 Crescent Real Estate Equities Enclave Business Park 1200 Enclave Pky Katy Freeway 149,683 1999 82.4% 39,094 $35.73 Piedmont Office Realty Trust, Inc. San Felipe Plaza 5847 San Felipe St San Felipe/Voss 980,472 1984 85.0% 190,625 $37.92 Thomas Properties Group, L.P. One BriarLake Plaza 2000 W. Sam Houston Westchase 502,410 2000 100.0% 70,668 $41.05 Behringer Harvard Holdings 24 Waterway 24 Waterway Ave. Woodlands 311,938 2009 98.6% 12,250 $36.89 Black Forest Ventures LLC Note: Avail. SF includes direct and sublet space. Source: CoStar Property COLLIERS INTERNATIONAL | P. 2
- 3. RESEARCH & FORECAST REPORT | Q2 2012 | HOUSTON OFFICE MARKET SALES ACTIVITY Houston’s office investment sales activity decreased between quarters with 15 properties changing hands, compared to 21 in the previous quarter. According to CoStar Comps, Houston office sales transactions had a total dollar volume of $170.8 million, averaging $139/SF with a 6.4% capitalization rate. Some of the more significant transactions that closed during the second quarter are listed below. Q2 2012 SIGNIFICANT SALES TRANSACTIONS RBA YEAR SALE BUILDING NAME SUBMARKET BUYER SELLER $/SF CLOSED (SF) BUILT PRICE Waterway Plaza I & II Woodlands 366,043 2000 The Lionstone Group Daymark Realty Advisors $83M $227 6/2012 The Reserve at Sierra Capital Lease Funding, Stream Realty Partners, Woodlands 175,035 2009 $40.5M $231 6/2012 Pines Inc. LP Memorial 6 Center Katy Freeway 156,703 1985 JP Realty Partners Ltd Aque Investment Group $10.5M $67 4/2012 LEASING ACTIVITY Houston’s office leasing activity reached 2.8 million SF in the second quarter, pushing the year-to-date total to over 7.2 million SF. Below is a list of the significant 2Q 2012 lease transactions. Q2 2012 SIGNIFICANT LEASE TRANSACTIONS BUILDING NAME/ADDRESS SUBMARKET SF TENANT LEASE DATE MetroNational MemCity 4 Katy Freeway 200,000 Murphy Oil Jun-12 Reserve at Park Ten Katy Freeway 130,282 WorleyParsons Apr-12 1600 Smith CBD 140,475 Chevron U.S.A. Inc.1 May-12 Heritage Plaza CBD 108,565 Rosetta Resources Operating LP May-12 America Tower Midtown 90,000 UHY Advisors Apr-12 1, 2 Ashford 7 Katy Freeway 83,960 Sasol North America Apr-12 Ashford 7 Katy Freeway 83,692 Mustang Engineering Apr-12 2 Wells Fargo Plaza CBD 78,000 Halcon Resources Jun-12 Braeswood Tower II Bellaire 73,196 Empyrean Benefits Apr-12 5444 Westheimer Galleria/West Loop 58,011 AECOM Technology May-12 1 3100 Hayes Rd Westchase 55,000 Affiliated Computer Service, Inc. Apr-12 2 Wells Fargo Plaza CBD 52,238 Cathexis Jun-12 Phoenix Tower Greenway Plaza 50,716 WorleyParsons Apr-12 1800 West Loop Galleria/West Loop 48,000 Health Care Services Corp Apr-12 9801 Westheimer Westchase 42,296 National Oilwell Varco Apr-12 1 5 Houston Center CBD 30,000 Crain, Caton & James Apr-12 1, 2 5 Houston Center CBD 27,000 Bank of Texas Apr-12 11811 North Freeway North Belt/Greenspoint 25,506 First Financial Group of America Apr-12 1550 LaConcha S Main/Medical Center 25,225 Southwest Key Program May-12 Comerica Bank Building E Fort Bend/Sugar Land 21,000 Amerex Brokers LLC1 May-12 1 1001 McKinney CBD 20,001 McGlinchey Stafford PLLC Apr-12 1 Renewal 2 Expansion 3 Sublease COLLIERS INTERNATIONAL | P. 3
- 4. RESEARCH & FORECAST REPORT | Q2 2012 | HOUSTON OFFICE MARKET HOUSTON OFFICE MARKET SUMMARY (CBD, SUBURBAN & CITYWIDE) Inventory Direct Vacancy Sublease Vacancy Vacancy Vacancy Rate (%) Net Absorption (SF) Rental Rate Class # of Bldgs. Total (SF) (SF) Rate (%) (SF) Rate (%) Total (SF) Q2-2012 Q1-2012 Q2-2012 YTD-2012 AVG ($/SF) CBD A 27 26,094,764 2,503,041 9.6% 345,372 1.3% 2,848,413 10.9% 11.3% 85,266 324,414 $36.80 B 35 9,749,422 1,854,381 19.0% 15,128 0.2% 1,869,509 19.2% 17.5% 9,958 30,815 $23.61 C 24 2,053,866 751,346 36.6% 0 0.0% 751,346 36.6% 36.6% 246 7,087 $19.26 Total 86 37,898,052 5,108,768 13.5% 360,500 1.0% 5,469,268 14.4% 14.3% 95,470 362,316 $32.45 SUBURBAN A 247 67,651,729 8,045,076 11.9% 280,226 0.4% 8,325,302 12.3% 12.4% 924,290 1,888,409 $27.81 B 923 74,521,063 12,257,091 16.4% 344,030 0.5% 12,601,121 16.9% 17.3% 315,996 143,445 $18.54 C 441 17,963,476 2,266,218 12.6% 31,658 0.2% 2,297,876 12.8% 12.8% 34,324 50,403 $14.79 Total 1611 160,136,268 22,568,385 14.1% 655,914 0.4% 23,224,299 14.5% 14.7% 1,274,610 2,082,257 $21.69 OVERALL A 274 93,746,493 10,548,117 11.3% 625,598 0.7% 11,173,715 11.9% 12.1% 1,009,556 2,212,823 $30.20 B 958 84,270,485 14,111,472 16.7% 359,158 0.4% 14,470,630 17.2% 17.3% 325,954 174,260 $19.20 C 465 20,017,342 3,017,564 15.1% 31,658 0.2% 3,049,222 15.2% 15.2% 34,570 57,490 $15.20 Total 1697 198,034,320 27,677,153 14.0% 1,016,414 0.5% 28,693,567 14.5% 14.6% 1,370,080 2,444,573 $23.66 HOUSTON SUBURBAN OFFICE MARKET SUMMARY Inventory Direct Vacancy Sublease Vacancy Vacancy Vacancy Rate (%) Net Absorption (SF) Rental Rate AVG Class # of Bldgs. Total (SF) (SF) Rate (%) (SF) Rate (%) Total (SF) Q2-2012 Q1-2012 Q2-2012 YTD-2012 ($/SF) Allen Parkway A 3 1,478,488 209,222 14.2% 0 0.0% 209,222 14.2% 14.3% 1,925 -19,632 $29.52 B 30 2,868,619 283,858 9.9% 1,518 0.1% 285,376 9.9% 7.4% -73,792 -59,016 $24.55 C 24 1,109,650 377,236 34.0% 0 0.0% 377,236 34.0% 33.8% -2,500 -2,500 $19.70 Total 57 5,456,757 870,316 15.9% 1,518 0.1% 871,834 16.0% 14.6% -74,367 -81,148 $27.16 Baytown B 4 244,544 0 0.0% 0 0.0% 0 0.0% 0.0% 0 6,802 $14.53 C 4 201,358 7,814 3.9% 0 0.0% 7,814 3.9% 4.2% 553 -731 $16.25 Total 8 445,902 7,814 1.8% 0 0.0% 7,814 1.8% 1.9% 553 6,071 $15.30 Bellaire A 6 1,086,526 97,340 9.0% 0 0.0% 97,340 9.0% 11.3% 25,466 10,650 $24.83 B 13 1,714,873 230,320 13.4% 0 0.0% 230,320 13.4% 13.5% 1,226 17,158 $21.40 C 7 533,622 52,949 9.9% 0 0.0% 52,949 9.9% 9.9% 1,393 11,749 $14.12 Total 26 3,335,021 380,609 11.4% 0 0.0% 380,609 11.4% 12.2% 28,085 39,557 $22.60 Conroe A 1 60,000 0 0.0% 0 0.0% 0 0.0% 0.0% 0 0 - B 3 128,970 33,138 25.7% 0 0.0% 33,138 25.7% 25.7% 75 1,592 $15.85 C 8 376,307 2250 0.6% 0 0.0% 2,250 0.6% 0.6% 0 625 $7.98 Total 12 565,277 35,388 6.3% 0 0.0% 35,388 6.3% 6.3% 75 2,217 $15.27 E. Fort Bend/Sugar Land A 17 3,354,182 757,299 22.6% 8,043 0.2% 765,342 22.8% 25.1% 54,671 62,626 $28.42 B 35 2,092,123 347,653 16.6% 87,600 4.2% 435,253 20.8% 18.8% -12,040 -63,393 $19.82 C 5 216,013 4,639 2.1% 1506 0.7% 6,145 2.8% 1.5% -2,885 -4,477 $18.40 Total 57 5,662,318 1,109,591 19.6% 97,149 1.7% 1,206,740 21.3% 21.9% 39,746 -5,244 $25.04 COLLIERS INTERNATIONAL | P. 4
- 5. RESEARCH & FORECAST REPORT | Q2 2012 | HOUSTON OFFICE MARKET HOUSTON SUBURBAN OFFICE MARKET SUMMARY - CONTINUED Inventory Direct Vacancy Sublease Vacancy Vacancy Vacancy Rate (%) Net Absorption (SF) Rental Rate Class # of Bldgs. Total (SF) (SF) Rate (%) (SF) Rate (%) Total (SF) Q2-2012 Q1-2012 Q2-2012 YTD-2012 AVG ($/SF) FM 1960 A 14 2,384,164 1,253,191 52.6% 3,051 0.1% 1,256,242 52.7% 35.2% 69,554 115,110 $24.23 B 87 4,826,629 918,674 19.0% 39,170 0.8% 957,844 19.8% 19.8% 17,396 -44,530 $15.68 C 20 699,078 69,043 9.9% 19,615 2.8% 88,658 12.7% 12.3% -7,195 -8,441 $13.85 Total 121 7,909,871 2,240,908 28.3% 61,836 0.8% 2,302,744 29.1% 23.7% 79,755 62,139 $18.13 Greenway A 15 6,168,363 449,844 7.3% 15,855 0.3% 465,699 7.5% 9.3% 78,404 147,831 $28.75 B 26 2,571,510 296,568 11.5% 2,000 0.1% 298,568 11.6% 12.7% 29,486 -628 $22.84 C 21 867,157 284,733 32.8% 0 0.0% 284,733 32.8% 28.9% -18,138 -1,017 $17.44 Total 62 9,607,030 1,031,145 10.7% 17,855 0.2% 1,049,000 10.9% 11.9% 89,752 146,186 $25.63 Gulf Freeway/Pasadena A 1 52,362 8,279 15.8% 0 0.0% 8,279 15.8% 15.8% 0 4,819 $27.44 B 28 1,709,836 216,494 12.7% 6,405 0.4% 222,899 13.0% 12.7% -6,151 951 $18.95 C 26 1,006,420 119,255 11.8% 0 0.0% 119,255 11.8% 10.6% -18,890 -25,077 $14.61 Total 55 2,768,618 344,028 12.4% 6,405 0.2% 350,433 12.7% 12.0% -25,041 -19,307 $17.86 I-10 East B 4 274,672 72,714 26.5% 0 0.0% 72,714 26.5% 26.5% 0 5,750 $14.99 C 6 189,062 0 0.0% 0 0.0% 0 0.0% 0.0% 0 0 - Total 10 463,734 72,714 15.7% 0 0.0% 72,714 15.7% 15.7% 0 5,750 $14.99 Katy Freeway A 44 11,147,153 724,826 6.5% 84,671 0.8% 809,497 7.3% 9.1% 207,787 349,468 $29.80 B 90 7,870,158 1,379,542 17.5% 42,305 0.5% 1,421,847 18.1% 19.7% 137,505 46,583 $19.15 C 36 1,656,367 165,537 10.0% 5,900 0.4% 171,437 10.4% 10.2% -2,312 2,824 $15.40 Total 170 20,673,678 2,269,905 11.0% 132,876 0.6% 2,402,781 11.6% 13.2% 342,980 398,875 $22.98 Kingwood/Humble A 1 91,962 41,824 45.5% 0 0.0% 41,824 45.5% 45.5% 0 0 $30.10 B 65 1,886,331 146,553 7.8% 1,000 0.1% 147,553 7.8% 7.0% -14,800 165 $20.06 C 82 748,720 18,110 2.4% 0 0.0% 18,110 2.4% 3.8% 6,962 20,146 $16.92 Total 148 2,727,013 206,487 7.6% 1,000 0.0% 207,487 7.6% 7.4% -7,838 20,311 $20.97 NASA/Clear Lake A 8 1,230,469 172,659 14.0% 0 0.0% 172,659 14.0% 14.1% 5,093 -951 $23.62 B 46 3,258,817 573,394 17.6% 6,138 0.2% 579,532 17.8% 18.5% 8,037 -110,212 $19.23 C 25 913,776 139,104 15.2% 1,100 0.1% 140,204 15.3% 15.8% 3,942 -13,532 $13.73 Total 79 5,403,062 885,157 16.4% 7,238 0.1% 892,395 16.5% 16.9% 17,072 -124,695 $19.37 North Belt/Greenspoint A 19 4,348,663 350,826 8.1% 41,044 0.9% 391,870 9.0% 8.9% 871 -63,327 $21.10 B 55 5,638,067 1,251,072 22.2% 78,136 1.4% 1,329,208 23.6% 21.7% -60,064 -38,488 $16.37 C 20 1,225,036 269,680 22.0% 1,937 0.2% 271,617 22.2% 23.4% 14,685 30,928 $13.13 Total 94 11,211,766 1,871,578 16.7% 121,117 1.1% 1,992,695 17.8% 17.0% -44,508 -70,887 $16.98 Northeast Near and Outlier B 5 301,773 77,923 25.8% 0 0.0% 77,923 25.8% 25.8% 0 0 $21.77 C 5 129,152 16,333 12.6% 0 0.0% 16,333 12.6% 12.6% 0 1,867 $12.00 Total 10 430,925 94,256 21.9% 0 0.0% 94,256 21.9% 21.9% 0 1,867 $16.69 COLLIERS INTERNATIONAL | P. 5
- 6. RESEARCH & FORECAST REPORT | Q2 2012 | HOUSTON OFFICE MARKET HOUSTON SUBURBAN OFFICE MARKET SUMMARY - CONTINUED Inventory Direct Vacancy Sublease Vacancy Vacancy Vacancy Rate (%) Net Absorption (SF) Rental Rate Class # of Bldgs. Total (SF) (SF) Rate (%) (SF) Rate (%) Total (SF) Q2-2012 Q1-2012 Q2-2012 YTD-2012 AVG ($/SF) Northwest/Outlier A 19 3,493,935 661,040 18.9% 22,922 0.7% 683,962 19.6% 19.4% -7,229 176,600 $23.88 B 67 6,177,278 1,329,178 21.5% 26,467 0.4% 1,355,645 21.9% 22.5% 64,367 86,053 $15.95 C 39 1,520,247 146,938 9.7% 0 0.0% 146,938 9.7% 10.5% 14,893 14,349 $12.42 Total 125 11,191,460 2,137,156 19.1% 49,389 0.4% 2,186,545 19.5% 19.9% 72,031 277,002 $18.58 Richmond/Fountainview B 14 775,717 247,164 31.9% 0 0.0% 247,164 31.9% 31.9% 280 -153,713 $16.10 C 16 598,633 98,652 16.5% 0 0.0% 98,652 16.5% 17.7% 4,443 -18,249 $12.94 Total 30 1,374,350 345,816 25.2% 0 0.0% 345,816 25.2% 25.7% 4,723 -171,962 $15.23 San Felipe/Voss A 3 1,714,930 299,921 17.5% 0 0.0% 299,921 17.5% 17.4% -5,448 7,278 $32.53 B 32 3,306,422 284,919 8.6% 8,711 0.3% 293,630 8.9% 8.8% -7,994 39,637 $20.00 C 4 239,680 49,409 20.6% 0 0.0% 49,409 20.6% 20.2% -1,945 -2,303 $14.83 Total 39 5,261,032 634,249 12.1% 8,711 0.2% 642,960 12.2% 12.1% -15,387 44,612 $24.48 South A 1 80,000 19,000 23.8% 0 0.0% 19,000 23.8% 23.8% 0 1,702 $26.13 B 13 479,107 63,316 13.2% 0 0.0% 63,316 13.2% 14.8% 7,364 11,342 $16.33 C 4 162,262 76,020 46.9% 0 0.0% 76,020 46.9% 34.1% 0 0 $13.84 Total 18 721,369 158,336 21.9% 0 0.0% 158,336 21.9% 21.2% 7,364 13,044 $17.49 South Main/Med Center A 14 4,474,422 683,209 15.3% 2000 0.0% 685,209 15.3% 8.3% 24,000 586,801 $29.79 B 37 4,205,725 318,717 7.6% 0 0.0% 318,717 7.6% 7.5% -10,976 -54,916 $23.02 C 31 2,372,818 132,044 5.6% 0 0.0% 132,044 5.6% 6.5% 28,247 28,247 $18.29 Total 82 11,052,965 1,133,970 10.3% 2,000 0.0% 1,135,970 10.3% 7.6% 41,271 560,132 $24.62 Southeast/Outlier A 1 159,304 0 0.0% 0 0.0% 0 0.0% 0.0% 0 0 - B 10 534,587 116,562 21.8% 0 0.0% 116,562 21.8% 24.8% 1,946 -3,654 $19.39 C 2 118,772 4,914 4.1% 0 0.0% 4,914 4.1% 10.6% 7,619 7,619 $24.00 Total 13 812,663 121,476 14.9% 0 0.0% 121,476 14.9% 17.3% 9,565 3,965 $20.08 Southwest A 6 1,583,702 270,786 17.1% 3,665 0.2% 274,451 17.3% 17.7% 5,981 9,031 $16.11 B 60 6,013,844 1,466,512 24.4% 1,867 0.0% 1,468,379 24.4% 24.7% 23,236 69,887 $15.56 C 39 2,157,259 162,359 7.5% 1,600 0.1% 163,959 7.6% 8.6% 11,427 13,433 $12.86 Total 105 9,754,805 1,899,657 19.5% 7,132 0.1% 1,906,789 19.5% 19.8% 40,644 92,351 $15.35 Southwest Far and Outlier A 1 61,049 13,371 21.9% 0 0.0% 13,371 21.9% 54.1% 19,660 -5,592 $24.07 B 16 717,194 74,126 10.3% 800 0.1% 74,926 10.4% 12.3% 10,460 25,939 $25.35 C 2 94,735 2,050 2.2% 0 0.0% 2,050 2.2% 1.1% -1050 -1050 $16.00 Total 19 872,978 89,547 10.3% 800 0.1% 90,347 10.3% 14.0% 29,070 19,297 $24.91 COLLIERS INTERNATIONAL | P. 6
- 7. RESEARCH & FORECAST REPORT | Q2 2012 | HOUSTON OFFICE MARKET HOUSTON SUBURBAN OFFICE MARKET SUMMARY - CONTINUED Inventory Direct Vacancy Sublease Vacancy Vacancy Vacancy Rate (%) Net Absorption (SF) Rental Rate Class # of Bldgs. Total (SF) (SF) Rate (%) (SF) Rate (%) Total (SF) Q2-2012 Q1-2012 Q2-2012 YTD-2012 AVG ($/SF) West Loop/Galleria A 35 14,695,652 1,432,476 9.7% 57,503 0.4% 1,489,979 10.1% 10.7% 100,163 120,948 $30.27 B 59 7,362,538 1,241,637 16.9% 8,798 0.1% 1,250,435 17.0% 18.8% 137,194 148,113 $22.61 C 3 147,042 433 0.3% 0 0.0% 433 0.3% 0.0% -433 -433 $18.42 Total 97 22,205,232 2,674,546 12.0% 66,301 0.3% 2,740,847 12.3% 13.2% 236,924 268,628 $26.97 Westchase A 22 6,787,503 530,558 7.8% 27,479 0.4% 558,037 8.2% 12.2% 334,070 338,911 $30.32 B 58 6,104,956 882,224 14.5% 10,025 0.2% 892,249 14.6% 16.3% 51,235 58,053 $18.18 C 7 339,118 66,716 19.7% 0 0.0% 66,716 19.7% 18.3% -4,492 -4,492 $15.03 Total 87 13,231,577 1,479,498 11.2% 37,504 0.3% 1,517,002 11.5% 14.3% 380,813 392,472 $24.17 The Woodlands A 16 3,198,900 69,405 2.2% 13,993 0.4% 83,398 2.6% 2.9% 9,322 46,136 $33.99 B 66 3,456,773 404,833 11.7% 23,090 0.7% 427,923 12.4% 12.7% 12,006 153,970 $20.69 C 5 341,192 0 0.0% 0 0.0% 0 0.0% 0.0% 0 918 - Total 87 6,996,865 474,238 6.8% 37,083 0.5% 511,321 7.3% 7.6% 21,328 201,024 $24.03 OFFICE DEVELOPMENT PIPELINE Houston’s construction pipeline continues to expand with 11 projects currently under construction. The table below summarizes buildings 20,000 square feet or greater being built. SELECT OFFICE BUILDINGS UNDER CONSTRUCTION PRE- EST. BUILDING NAME ADDRESS SUBMARKET SF LEASED DEVELOPER DELIVERY Anadarko Tower 2 1201 Lake Robbins Dr Woodlands 550,000 100.0% Patrinely Group Inc 4/2014 Nexen Building 945 Bunker Hill Katy Freeway 331,513 69.9% MetroNational Corp 8/2012 BBVA Compass/2200 Post Oak 2200 Post Oak Blvd. Galleria/Uptown 306,012 59.3% Redstone and Stream 4/2013 Skanska Commercial 3009 Post Oak Blvd. 3009 Post Oak Blvd. Galleria/Uptown 302,536 0.0% 7/2013 Development Research Forest Lakeside – 2445 Technology Forest Blvd Woodlands 300,000 50.0% Warmack Investments 4/2013 Building 4 The Woodlands Development 3 Waterway Square Place 3 Waterway Ave. Woodlands 233,844 90.0% 6/2013 Company, L.P. Sam Houston Crossing II Sam Houston Pky N Northwest Far 159,056 0.0% Duke Realty 5/2013 Mason Creek Office Center Mason Rd & Merchants Way Northwest Outlier 135,330 0.0% Myers, Crow & Saviers 4/2013 CityCentre Three 842 W Sam Houston Pky N Katy Freeway 120,211 46.5% Midway Companies 9/2012 Halliburton North Belt Campus Milner Road North Belt/Greenspoint 100,000 100.0% - 12/2012 Datavox Technologies 6650 W Sam Houston Pky S Westchase 48,000 100.0% - 9/2012 HOUSTON OFFICE SUBMARKET MAP COLLIERS INTERNATIONAL | P. 7
- 8. RESEARCH & FORECAST REPORT | Q2 2012 | HOUSTON OFFICE MARKET Colliers International Statistics Revenues: $1.8 billion Countries: 62 Offices: 522 Professionals & Staff: 12,300 Brokers: 4,800 Square Feet Managed: 1.25 billion* Lease/Sale Transactions: 76,000 Total Transaction Value: $68 billion (Based on 2011 results.) *The combination of Colliers International and FirstService results in 2.5 billion under management (2nd largest in the world). Lisa R. Bridges Director of Market Research Houston Direct +1 713 830 2125 Fax +1 713 830 2118 lisa.bridges@colliers.com COLLIERS INTERNATIONAL | HOUSTON 1300 Post Oak Boulevard Suite 200 Houston, Texas 77056 Main +1 713 222 2111 Accelerating success. COLLIERS INTERNATIONAL | P. 8