Cheap Rate ✨➥9582086666▻✨Call Girls In Gurgaon Sector 11 (Gurgaon)
Q2 2011 Houston Industrial Market Report
1. Q2 2011 | INDUSTRIAL MARKET
HOUSTON INDUSTRIAL MARKET
RESEARCH & FORECAST REPORT
Houston’s Industrial Construction Activity Increases
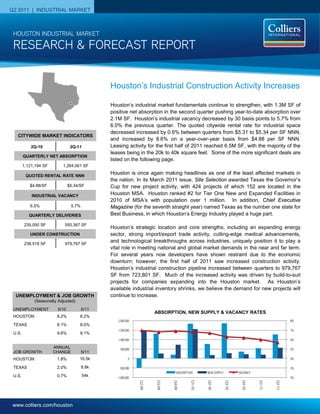
Houston’s industrial market fundamentals continue to strengthen, with 1.3M SF of
positive net absorption in the second quarter pushing year-to-date absorption over
2.1M SF. Houston’s industrial vacancy decreased by 30 basis points to 5.7% from
6.0% the previous quarter. The quoted citywide rental rate for industrial space
decreased increased by 0.6% between quarters from $5.31 to $5.34 per SF NNN,
CITYWIDE MARKET INDICATORS
and increased by 8.6% on a year-over-year basis from $4.88 per SF NNN.
2Q-10 2Q-11 Leasing activity for the first half of 2011 reached 6.5M SF, with the majority of the
leases being in the 20k to 40k square feet. Some of the more significant deals are
QUARTERLY NET ABSORPTION
listed on the following page.
1,121,194 SF 1,264,061 SF
QUOTED RENTAL RATE NNN
Houston is once again making headlines as one of the least affected markets in
the nation. In its March 2011 issue, Site Selection awarded Texas the Governor’s
$4.88/SF $5.34/SF Cup for new project activity, with 424 projects of which 152 are located in the
INDUSTRIAL VACANCY Houston MSA. Houston ranked #2 for Tier One New and Expanded Facilities in
2010 of MSA’s with population over 1 million. In addition, Chief Executive
6.5% 5.7% Magazine (for the seventh straight year) named Texas as the number one state for
QUARTERLY DELIVERIES Best Business, in which Houston’s Energy Industry played a huge part.
235,050 SF 550,367 SF
Houston’s strategic location and core strengths, including an expanding energy
UNDER CONSTRUCTION sector, strong import/export trade activity, cutting-edge medical advancements,
238,518 SF 979,767 SF
and technological breakthroughs across industries, uniquely position it to play a
vital role in meeting national and global market demands in the near and far term.
For several years now developers have shown restraint due to the economic
downturn; however, the first half of 2011 saw increased construction activity.
Houston’s industrial construction pipeline increased between quarters to 979,767
SF from 723,801 SF. Much of the increased activity was driven by build-to-suit
projects for companies expanding into the Houston market. As Houston’s
available industrial inventory shrinks, we believe the demand for new projects will
UNEMPLOYMENT & JOB GROWTH continue to increase.
(Seasonally Adjusted)
UNEMPLOYMENT 5/10 5/11
ABSORPTION, NEW SUPPLY & VACANCY RATES
HOUSTON 8.2% 8.2%
2,000,000 8%
TEXAS 8.1% 8.0%
1,500,000 7%
U.S. 9.6% 9.1%
1,000,000 6%
ANNUAL 500,000 5%
JOB GROWTH CHANGE 5/11
HOUSTON 1.8% 16.5k 0 4%
TEXAS 2.0% 8.8k -500,000 3%
ABSORPTION NEW SUPPLY VACANCY
U.S. 0.7% 54k -1,000,000 2%
Q2-09
Q3-09
Q4-09
Q1-10
Q2-10
Q3-10
Q4-10
Q1-11
Q2-11
www.colliers.com/houston
2. RESEARCH & FORECAST REPORT | Q2 2011 | HOUSTON INDUSTRIAL MARKET
Vacancy & Availability Absorption & Demand 2011 INDUSTRIAL LEASES
Houston’s industrial vacancy continues Houston’s industrial market posted K2 Logistics
to shrink averaging 5.7% vacancy in the positive net absorption of 1.3M SF in the Hardy Distribution Center I
Jun-11 143,600 SF
second quarter, 30 basis points (bps) second quarter, an improvement over the
less than the previous quarter, and 80 positive net absorption of 907K SF American Packing & Crating*
bps below the 6.5% recorded in the posted in the previous quarter. 404 N Witter St
Feb-11 140,782 SF
same quarter last year. Over the past
seven quarters, Houston’s industrial Among Houston’s major industrial Packwell Inc.**
vacancy has decreased, outperforming corridors, the Southeast and North Wallisville Road Industrial Park - 1
all other commercial real estate outperformed other submarkets in the May-11 136,928 SF
property sectors citywide. second quarter posting the highest
ASCO
positive net quarterly absorption of 624K Greens Port Industrial Park - 2G
At the end of the second quarter, SF and 541K SF, respectively. The Jan-11 120,000 SF
Houston posted 28.6 SF of vacant Northeast submarket followed with 201K
Max Movers**
industrial space citywide. Among the SF. 1205 North Post Oak Rd.
major industrial corridors, the Northwest Feb-11 103,800 SF
held the largest amount of vacant space There were several major tenant move-
ins contributing to net absorption gains in Sercel Inc.**
with 7.4M SF (5.4% vacancy), followed
Techway SW Business Park - 1
by the Southeast with 5.0M SF vacant the second quarter, including Jacobson May-11 99,000 SF
(5.8% vacancy), the Southwest with Logistics (436,410 SF), Suntron GCO LP
4.9M SF vacant (7.3% vacancy), and (210,964 SF), Exel (75,000 SF), and Berlin Packaging
13788 West Rd.
the North with 4.3M SF vacant (6.1% J.A.M. Distributing Company (54,820
Feb-11 80,000 SF
vacancy). SF).
National Oilwell**
Houston’s industrial construction
Leasing 5900 Brittmoore Rd.
May-11 66,500 SF
pipeline increased to 979,767 SF from Houston’s industrial leasing activity
723,801 SF in the previous quarter. The reached 3.1M SF in the second quarter, J.A.M. Distributing Company
largest project under construction is a 2.6K SF less than the previous quarter 6100 Donoho St.
May-11 54,820 SF
182,800 SF build-to-suit for Woodgrain and 3.1M SF less than what was
Distribution located in the North Outer recorded in the same quarter last year. Soltex
Loop Ind submarket. The project is For a select list of Houston’s top AmeriPort - Bldg. 2
Jun-11 46,800 SF
being developed by Clay Development industrial leases signed to date, please
and is scheduled for delivery August see the column at right. Foxconn Technology Group
2011. Clay Development has four other Round Up Park - Bldg. B
projects under development. A list of Jun-11 45,600 SF
current properties under construction Coastal HVAC Supply
can be found on page 4 or this report. Greenspoint Business Center - B
May-11 45,450 SF
Rental Rates
Volume Millworks*
Houston’s overall average quoted Minimax 2
industrial rental rate increased from May-11 32,163 SF
$5.33 to $5.34 per SF NNN between
quarters, and increased by 8.6% on a
year-over-year basis from $4.88 per SF
NNN. By property type on a year-over- *Colliers International transaction
** Renewal
year basis, distribution space is up
$0.23 per SF to $5.05 and flex space
stood at $7.93 NNN/SF (down
$1.17/SF).
COLLIERS INTERNATIONAL | P. 2
3. RESEARCH & FORECAST REPORT | Q2 2011 | HOUSTON INDUSTRIAL MARKET
HOUSTON INDUSTRIAL INVESTMENT SALES Sales Activity North American Terminals
Houston’s industrial investment Management, Inc. purchased a 39-
2Q 2011 activity increased significantly property portfolio from FedEx
Total Volume: $242.8M between quarters, with 55 Corporation for $84 per SF. The 39
# of Properties: 55 properties trading in the second properties are located throughout
Total SF: 6.1M quarter compared with 14 in the the United States, with
Average Price/SF: $54 first quarter. The most significant concentrations in Florida, Texas,
Average Cap: 9.5% transaction was AEW Capital and California. The total square
Managements’ 1.9M SF, 3- footage of the portfolio totals
Source: Costar Comps
property portfolio which sold to 924,516-SF. At the time of sale, the
Industrial Income Trust, Inc. for subject properties were vacant and
$57 per SF. Only one of the the buyer has hired Burr & Temkin
properties in the portfolio is located to lease up the properties.
in Houston’s Industrial market.
1111 Gillingham Lane, a 489,263 Purvis Industries Ltd. Purchased a
SF, Class A manufacturing and 60,114 SF Class A distribution
1111-1113 Gillingham Ln
distribution warehouse was building from Fashion Glass and
allocated a price per square foot of Mirrors. The building, located at
$74. The building, situated in the 10650 W Little York in the
Sugar Land Business Park in Bondesen North Business Park,
southwest Houston, was 100% sold for $57 per SF.
leased at the time of sale.
10650 W Little York
HOUSTON INDUSTRIAL MARKET SUMMARY
Direct Sublet Total
Direct Sublet Total 2Q Net YTD Net 2Q YTD SF Under
Market Rentable Area Vacancy Vacancy Vacancy
Vacant SF Vacant SF Vacant SF Absorption Absorption Completions Completions Construction
Rate Rate Rate
Greater Houston Total 501,944,832 27,638,901 5.5% 971,242 0.2% 28,610,143 5.7% 1,323,986 2,231,257 550,367 782,732 979,767
NW Inner Loop 13,052,992 681,100 5.2% 37,000 0.3% 718,100 5.5% 17,000 31,707 - - -
CBD 33,843,288 1,864,563 5.5% - 0.0% 1,864,563 5.5% 10,664 (13,940) - - -
North Inner Loop 5,658,180 571,858 10.1% - 0.0% 571,858 10.1% (15,000) (15,000) - - -
SW Inner Loop 9,848,353 246,720 2.5% - 0.0% 246,720 2.5% 22,317 (40,336) - - -
Total Inner Loop 62,402,813 3,364,241 5.4% 37,000 0.1% 3,401,241 5.5% 34,981 (37,569) - - -
North Fwy/Tomball Pky 14,387,692 1,096,147 7.6% 9,975 0.1% 1,106,122 7.7% 139,273 110,007 - - 130,962
North Hardy Toll Rd 24,628,524 1,397,755 5.7% 79,995 0.3% 1,477,750 6.0% 204,782 140,288 120,146 172,546 68,146
North Outer Loop 17,399,253 1,011,518 5.8% - 0.0% 1,011,518 5.8% 120,727 14,173 110,500 110,500 519,401
The Woodlands/Conroe 14,498,684 699,464 4.8% 21,197 0.1% 720,661 5.0% 76,610 39,466 19,721 19,721 -
Total North Corridor 70,914,153 4,204,884 5.9% 111,167 0.2% 4,316,051 6.1% 541,392 303,934 250,367 302,767 718,509
Northeast Hwy 321 1,385,909 - 0.0% - 0.0% - 0.0% 0 0 - - -
Northeast Hwy 90 16,505,042 510,664 3.1% 214,120 1.3% 724,784 4.4% 24,448 (111,342) - - 20,000
Northeast I-10 4,210,548 183,327 4.4% - 0.0% 183,327 4.4% (34,635) (88,032) - - -
Northeast Inner Loop 11,300,168 873,497 7.7% - 0.0% 873,497 7.7% 215,896 142,421 - -
Total Northeast Corridor 33,401,667 1,567,488 4.7% 214,120 0.6% 1,781,608 5.3% 205,709 (56,953) - - 20,000
Hwy 290/Tomball Pky 16,045,980 557,173 3.5% 22,174 0.1% 579,347 3.6% 104,944 179,462 - - 69,825
Northwest Hwy 6 5,933,690 66,792 1.1% - 0.0% 66,792 1.1% 33,054 708,854 -
Northwest Inner Loop 61,634,706 3,609,377 5.9% 230,791 0.4% 3,840,168 6.2% (196,134) (13,491) - - -
Northwest Near 16,865,205 1,029,929 6.1% - 0.0% 1,029,929 6.1% (46,259) (111,989) - - 24,377
Northwest Outlier 13,549,016 430,792 3.2% 5,348 0.0% 436,140 3.2% (6,067) (12,835) - - 20,969
West Outer Loop 22,018,581 1,443,246 6.6% - 0.0% 1,443,246 6.6% 136,841 302,711 300,000 334,125 -
Total Northwest Corridor 136,047,178 7,137,309 5.2% 258,313 0.2% 7,395,622 5.4% 26,379 1,052,712 300,000 334,125 115,171
East I-10 Outer Loop 15,365,127 176,135 1.1% - 0.0% 176,135 1.1% - 207,960 - - -
East-SE Far 49,651,143 4,160,747 8.4% 73,278 0.1% 4,234,025 8.5% 606,955 848,466 - 73,840 57,290
SE Outer Loop 21,354,861 529,586 2.5% 50,000 0.2% 579,586 2.7% 17,400 (72,012) - - -
Total Southeast Corridor 86,371,131 4,866,468 5.6% 123,278 0.1% 4,989,746 5.8% 624,355 984,414 - 73,840 57,290
South Highway 35 31,965,924 1,237,239 3.9% 127,105 0.4% 1,364,344 4.3% 63,210 52,530 - -
South Inner Loop 13,497,993 427,337 3.2% - 0.0% 427,337 3.2% (61,815) (67,645) - - -
Total South Corridor 45,463,917 1,664,576 3.7% 127,105 0.3% 1,791,681 3.9% 1,395 (15,115) - - -
Highway 59/Highway 90 23,133,638 1,362,730 5.9% 64,871 0.3% 1,427,601 6.2% (68,285) (29,885) - - -
Southwest Far 10,740,607 927,181 8.6% 12,490 0.1% 939,671 8.7% (38,688) (30,107) - 20,000 38,797
Southwest Outer Loop 14,882,821 1,208,148 8.1% - 0.0% 1,208,148 8.1% (46,503) 27,827 - - -
Fort Bend County/Sugar Lan 18,586,907 1,335,876 7.2% 22,898 0.1% 1,358,774 7.3% 43,251 31,999 - 52,000 30,000
Total Southwest Corridor 67,343,973 4,833,935 7.2% 100,259 0.1% 4,934,194 7.3% (110,225) (166) - 72,000 68,797
COLLIERS INTERNATIONAL | P. 3
4. RESEARCH & FORECAST REPORT | Q2 2011 | HOUSTON INDUSTRIAL MARKET
Select Industrial Projects Under Construction
Estimated
Submarket Building Address RBA % Leased Developer Delivery
1 North Outer Loop Ind 4343 Kennedy Commerce Dr 182,800 100.00 Clay Development Aug-11
2 North Outer Loop Ind 14401 John F Kennedy Blvd 111,126 100.00 Noble Drilling Llc Sep-11
3 North Outer Loop Ind 4554 Kennedy Commerce Dr 101,250 100.00 Clay Development Nov-11
4 North Fwy/Tomball Pky Ind 10811 Vinecrest Dr 88,362 0.00 East Properties Jul-11
5 North Outer Loop Ind 14041 Vickery Dr 74,000 100.00 Clay Development Aug-11
6 North Outer Loop Ind 4551 Kennedy Commerce Dr 50,225 100.00 Clay Development Oct-11
7 North Hardy Toll Road Ind 4540 Kendrick Plaza Dr 43,536 27.75 East Properties Dec-11
8 North Fwy/Tomball Pky Ind 12311 Cutten Rd 42,600 100.00 Clay Development Sep-11
9 Hwy 290/Tomball Pky Ind 12606 N Houston Rosslyn Rd 39,700 24.14 2004 Nw Park Ltd Sep-11
10 Southwest Far Ind 425 Summer Park Dr 38,797 100.00 Red Sea Properties Aug-11
11 East-Southeast Far Ind 201 Beltway Green 30,170 0.00 Chrysler Group Realty Jun-11
12 Hwy 290/Tomball Pky Ind 10120 Houston Oaks Dr 30,125 100.00 Sareh Llc Nov-11
Select 2Q 2011 Industrial Deliveries
Submarket Building Address RBA % Leased Developer Name Delivered
1 West Outer Loop Ind 13788 West Rd 300,000 73.3% Duke Realty Jun-11
2 North Outer Loop Ind 4444 Kennedy Commerce D 67,500 100.0% Clay Development Jun-11
3 North Hardy T oll Ind 19054 Kenswick Dr 52,000 100.0% Bertling Logistics Inc Jun-11
4 North Hardy T oll Ind 4550 Kendrick Plaza Dr. 43,536 27.8% East Properties Jun-11
5 North Outer Loop Ind 2105 Skinner Rd 43,000 100.0% Spt Partners Llc May-11
6 North Hardy T oll Ind 2437 Peyton Rd. 24,610 0.0% Capital Commercial Jun-11
2Q 2011 Houston Industrial Deliveries 2Q 2011 Houston Industrial Under Construction
3
7
6 4
8
4 2
2 12 1 3
9 5 6
5
1
11
10
COLLIERS INTERNATIONAL | P. 4
5. RESEARCH & FORECAST REPORT | Q2 2011 | HOUSTON INDUSTRIAL MARKET
Colliers International Statistics
Revenues: $1.5 Billion
Countries: 61
Offices: 512
Professionals & Staff: 12,509
Brokers: 4,387
Square Feet Managed: 979 Million*
Lease/Sale Transactions: 73,972
Total Transaction Value: $59.6 Billion
(Based on 2010 results.)
*The combination of Colliers International and FirstService results in
2.2 Billion under management (2nd largest in the world.
COLLIERS INTERNATIONAL | HOUSTON
1300 Post Oak Boulevard
Suite 200
Houston, Texas 77056
MAIN +1 713 222 2111
Accelerating success.
COLLIERS INTERNATIONAL | P. 5