More Related Content
Similar to E M E A F P R M O S C O W O F F I C E S M V H1 09
Similar to E M E A F P R M O S C O W O F F I C E S M V H1 09 (20)
More from Igor Bevzenko (6)
E M E A F P R M O S C O W O F F I C E S M V H1 09
- 1. MarketView
Moscow Offices
1H 2009
CB RICHARD ELLIS
Hot Topics
Quick Stats
•Take-up in 1H 2009 fell by 32%
compared with 1H 2008
•For the first time in Moscow’s office
market history the Class A vacancy rate
(27%) has exceeded the Class B vacancy
rate (19%)
•Office rents fell by more than 50% on
average during 1H 2009
Change from
1H 09 1H 08
OVERVIEW
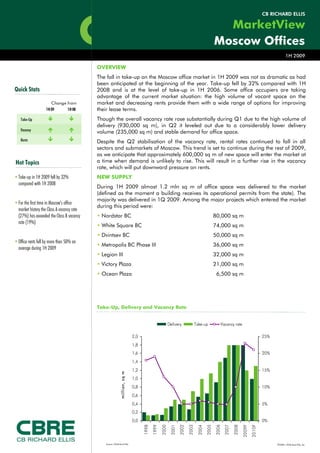
The fall in take-up on the Moscow office market in 1H 2009 was not as dramatic as had
been anticipated at the beginning of the year. Take-up fell by 32% compared with 1H
2008 and is at the level of take-up in 1H 2006. Some office occupiers are taking
advantage of the current market situation: the high volume of vacant space on the
market and decreasing rents provide them with a wide range of options for improving
their lease terms.
Though the overall vacancy rate rose substantially during Q1 due to the high volume of
delivery (930,000 sq m), in Q2 it leveled out due to a considerably lower delivery
volume (235,000 sq m) and stable demand for office space.
Despite the Q2 stabilisation of the vacancy rate, rental rates continued to fall in all
sectors and submarkets of Moscow. This trend is set to continue during the rest of 2009,
as we anticipate that approximately 600,000 sq m of new space will enter the market at
a time when demand is unlikely to rise. This will result in a further rise in the vacancy
rate, which will put downward pressure on rents.
NEW SUPPLY
During 1H 2009 almost 1.2 mln sq m of office space was delivered to the market
(defined as the moment a building receives its operational permits from the state). The
majority was delivered in 1Q 2009. Among the major projects which entered the market
during this period were:
• Nordstar BC 80,000 sq m
• White Square BC 74,000 sq m
• Dvintsev BC 50,000 sq m
• Metropolis BC Phase III 36,000 sq m
• Legion III 32,000 sq m
• Victory Plaza 21,000 sq m
• Ocean Plaza 6,500 sq m
Source: CB Richard Ellis ©2009, CB Richard Ellis, Inc.
Take-Up, Delivery and Vacancy Rate
Take-Up
Vacancy
Rents
0,0
0,2
0,4
0,6
0,8
1,0
1,2
1,4
1,6
1,8
2,0
1998
1999
2000
2001
2002
2003
2004
2005
2006
2007
2008
2009F
2010F
m
i
l
l
i
on
,
s
q
m
0%
5%
10%
15%
20%
25%
Delivery Take-up Vacancy rate
- 2. 1H
2009
MarketView
Moscow
Offices
In terms of quality the new supply consists of 21% Class A
space, 62% newly constructed Class B space and 17%
renovated Class B space. Compared with previous years the
share of Class A in new delivery rose in 1H 2009 and the
share of reconstructed Class B fell.
In terms of the geographic distribution of new delivery, the
zone between the Third Ring Road (TTK) and the outer MKAD
ring-road had the highest volume of new space (more than
50%). The CBD’s share in new delivery was, as usual, modest
at just 12%.
Over the rest of 2009 we anticipate that a further 600,000
sq m will be delivered to the market. Major projects for 2H
2009 include:
• Donmikov BC 73,000 sq m
• Vivaldi Plaza 70,000 sq m
• WTC Phase III 33,000 sq m
• Principal Plaza 21,000 sq m
• Arbat Center Phase II 15,500 sq m
• Pavlovsky BC Phase II 12,500 sq m
• Riverside Towers Phase V 5,500 sq m
TAKE-UP
Take-up in 1H 2009 amounted to 600,000 sq m, a 32%
decline compared with the take-up volume of 1H 2008. The
breakdown between Q1 and Q2 was almost equal. Due to
the economic slowdown, occupier behavior changed during
1H 2009 compared with the boom years of 2007 and 2008,
revealing the following trends in demand for office space:
• In terms of the distribution of take-up by geographic
location, the amount of space taken up in decentralized
areas fell. The share of deals in decentralized areas (beyond
the TTK, including the area beyond the MKAD) in 2008 was
57%, while in 1H 2009 this figure had shrunk to 46%.
• Transactions on secondary space increased compared with
those on newly delivered space: in 2008 these accounted for
just 20%, while in 1H 2009 that figure rose to 41%. Newly
delivered space, which requires investment in fit-out, is not
popular in current market conditions, accounting for this
decline in take-up.
•As a result of efforts by occupiers to try and adjust the terms
of their current lease agreements to reflect new market
conditions, a number of renegotiation deals occurred during
1H 2009 totaling more than 100,000 sq m, which would
add another 15% to total take-up (renegotiation deals are
not included in total take-up volume according to CBRE
standards).
Distribution of Supply by Quality
©2009, CB Richard Ellis, Inc.
Page 2
Source: CB Richard Ellis
Geographic Take-Up Distribution
Source: CB Richard Ellis
0
100
200
300
400
500
600
700
800
900
1 000
2006 2007 2008 1H2009
0
0
0
s
q
m
CBD CBD>TTK TTK>MKAD Beyond MKAD
Distribution of Supply by Geographic Submarket
0
200 000
400 000
600 000
800 000
1 000 000
1 200 000
1 400 000
1 600 000
1 800 000
2007 2008 1H2009
sq
m
Class B reconstr. Class B new Class A
17%
15%
37%
28%
38%
42%
8%
15%
0% 20% 40% 60% 80% 100%
1H 2009
2008
CBD CBD>TTK TTK>MKAD Beyond MKAD
Source: CB Richard Ellis
- 3. ©2009, CB Richard Ellis, Inc.
Page 3
The current occupier’s market gives tenants an
opportunity to improve their office facilities and/or reduce
rent, and many are seeking to take advantage of the
current market situation. We expect that healthy take-up
dynamics will continue throughout the rest of 2009 and
that the volume of deals will be equal to that of 1H or
greater: in Q1 most occupiers froze all plans due to the
economic turmoil, whereas now they have adapted to the
new economic realities and are ready to make real estate
commitments.
VACANCY RATES
The average Moscow vacancy rate at the end of 1H
2009 was 20%. For the first time in the history of the
Moscow office market we recorded a situation in which
the Class A vacancy rate (27%) outstripped the Class B
vacancy rate (19%). Class B accounts for over four-fifths
of all quality office stock in Moscow. In Class A vacant
space, almost 30% was accounted for by sublease space.
Large office occupiers who pre-leased space one or two
years ago (aiming to secure extra space for anticipated
future growth) now offer space for sublease. A large
share of Class A sublease space was in the Prime CBD
area. Historically this area had the lowest vacancy rate of
any Moscow office submarket: in early 2008 the vacancy
rate there was less than 1% as only small blocks of space
were available, mostly through subleases. In August
2008 the vacancy rate rose to 6% due to the delivery of
Voentorg BC. The building entered the market only 50%
pre-leased. By November, the vacancy rate had
increased even further to 11%. By June 2009 vacancy
rates in Prime CBD had reached 25% due to a
considerable increase in sublease offers.
For the rest of 2009 Prime CBD Class A vacancy rates
will not rise significantly. The space being offered for
sublease in the area will be absorbed more quickly than
offers under direct lease, and the amount of new delivery
will be modest.
The average vacancy rate (for both Class A and Class B
space) was also high in decentralized areas: at the end
of 1H 2009 in the area between TTK and MKAD it was
20% and beyond MKAD it was almost 25%.
RENTAL RATES
Office rental rates fell by more than 50% on average
during 1H 2009. At the end of 1H 2009 the average
asking Class A rates in the Prime CBD area were
approximately $750/sq m/year (excluding operating
expenses and VAT), while in other CBD areas and
outside CBD landlords were offering even lower rates.
Furthermore, landlords began to show flexibility and a
readiness to offer discounts or other incentives (fit-out,
rent-free periods), meaning that the achievable rates
even for Class A space in the Prime CBD area were even
lower than the benchmark of $750/sq m/year.
Vacancy Rates by Class
Source: CB Richard Ellis
MarketView
Moscow
Offices
1H
2009
Take-Up Distribution: New and Secondary Space
0
200
400
600
800
1000
1200
1400
1600
1800
2003 2004 2005 2006 2007 2008 1H
2009
0
0
0
s
q
m
new secondary
0%
5,0%
10,0%
15,0%
20,0%
25,0%
30,0%
Q1
2007
Q2
2007
Q3
2007
Q4
2007
Q1
2008
Q2
2008
Q3
2008
Q4
2008
Q1
2009
Q2
2009
Class A Class B
Vacancy Rates by Class
Source: CB Richard Ellis
0
50 000
100 000
150 000
200 000
250 000
300 000
350 000
400 000
Oct 2008 Feb 2009 Apr 2009 May 2009 June 2009
s
q
m
New space, shell & core Secondary space, fit-out Sublease
Structure of Class A Vacant Space
Source: CB Richard Ellis
Source: CB Richard Ellis
- 4. 1H
2009
MarketView
Moscow
Offices
Disclaimer 2009 CB Richard Ellis
Information herein has been obtained from sources believed to be reliable. While we do not doubt its
accuracy, we have not verified it and make no guarantee, warranty or representation about it. It is your
responsibility to independently confirm its accuracy and completeness. Any projections, opinions,
assumptions or estimates used are for example only and do not represent the current or future
performance of the market. This information is designed exclusively for use by CB Richard Ellis clients, and
cannot be reproduced without prior written permission of CB Richard Ellis.© Copyright 2009 CB Richard
Ellis
CB Richard Ellis is the market leading commercial real estate adviser worldwide - an adviser strategically
dedicated to providing cross-border advice to corporates and investment clients immediately and at the
highest level. We have more than 300 offices in 50+ countries across the globe, and employ 30,000
people worldwide. Our network of local expertise, combined with our international perspective, ensures
that we are able to offer a consistently high standard of service across the world. For full list of CB Richard
Ellis offices and details of services, visit www.cbre.com
For more information regarding the MarketView,
please contact:
CBRE Research Moscow
Christopher Peters
Director of Research
e: christopher.peters@cbre.com
Irina Florova
Head of Analytics
e: irina.florova@cbre.com
Office Services Team
Elena Efremova
Head of Corporate Services
e: elena.efremova@cbre.com
Irina Kuzlichenkova
Head of Office Agency
e: irina.kuzlichenkova@cbre.com
Average Asking Rents
Average Class B rates in decentralized areas saw the largest adjustment as more
than 1 mln sq m of newly delivered Class B space became vacant in the area. By the
end of 1H 2009 Class B space in shell & core condition was achieving rental rates of
approximately $250-300/sq m/year (excluding operating expenses and VAT).
OUTLOOK
The Moscow office market is nearing the bottom end of its first cycle as a modern
international office market of significant size. It is possible that the end of 1H 2009
could turn out to be the lowest point of the cycle, when supply was considerably
higher than demand. If demand stabilizes during the rest of 2009, we will see a
reduction in the gap between demand and supply due to a fall in new deliveries,
which will be constrained over the next few years due to problems with development
financing. This will inevitably lead to a contraction of vacant space and a rise in
rents. However, the situation on the office market, and demand for office space in
particular, is very much dependant on the wider macroeconomic environment. Thus,
our forecast is based on the assumption that the Russian economy will not suffer any
sharp shocks over the mid-term.
Trubnaya Street, 12, Moscow 107045,
Russia
Tel. (7 495) 258 3990
Fax (7 495) 258 3980
www.cbre.ru
Source: CB Richard Ellis
©2009, CB Richard Ellis, Inc.
Page 4
0
500
1 000
1 500
2 000
2 500
2005
2006
2007
1H2008
2H2008
1H2009
2H2009F
2010F
$/sq
m/year
Class A prime Class A Class B