More Related Content Similar to 04.3 heterogeneous debt portfolios (20) 1. Example Index
Copyright 2018 CapitaLogic Limited
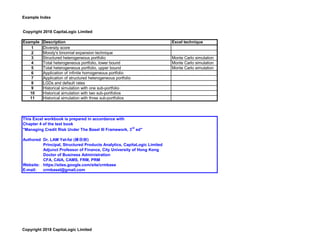
Example Description Excel technique
1 Diversity score
2 Moody's binomial expansion technique
3 Structured heterogeneous portfolio Monte Carlo simulation
4 Total heterogeneous portfolio, lower bound Monte Carlo simulation
5 Total heterogeneous portfolio, upper bound Monte Carlo simulation
6 Application of infinite homogeneous portfolio
7 Application of structured heterogeneous portfolio
8 LGDs and default rates
9 Historical simulation with one sub-portfolio
10 Historical simulation with two sub-portfolios
11 Historical simulation with three sub-portfolios
This Excel workbook is prepared in accordance with
Chapter 4 of the text book
"Managing Credit Risk Under The Basel III Framework, 3rd
ed"
Authored by :Dr. LAM Yat-fai (林日辉)
Principal, Structured Products Analytics, CapitaLogic Limited
Adjunct Professor of Finance, City University of Hong Kong
Doctor of Business Administration
CFA, CAIA, CAMS, FRM, PRM
Website: https://sites.google.com/site/crmbase
E-mail: crmbasel@gmail.com
Copyright 2018 CapitaLogic Limited
2. Example 1 Diversity score
1 2 3 4 5 6 7 8 9 10 No. of Diversity
1 1 borrowers score
2 2 3 1 1
3 4 5 6 2 1.5
4 7 8 9 10 3 2
5 11 12 13 14 15 4 2.333333
6 16 17 18 19 20 21 5 2.666667
7 22 23 24 25 26 27 28 6 3
8 29 30 31 32 33 34 35 36 7 3.25
9 37 38 39 40 41 42 43 44 45 8 3.5
10 46 47 48 49 50 51 52 53 54 55 9 3.75
10 4
11 4.2
12 4.4
1 13 4.6
1.5 2 14 4.8
2.333333 2.666667 3 15 5
3.25 3.5 3.75 4 16 5.166667
4.2 4.4 4.6 4.8 5 17 5.333333
5.166667 5.333333 5.5 5.666667 5.833333 6 18 5.5
6.142857 6.285714 6.428571 6.571429 6.714286 6.857143 7 19 5.666667
7.125 7.25 7.375 7.5 7.625 7.75 7.875 8 20 5.833333
8.111111 8.222222 8.333333 8.444444 8.555556 8.666667 8.777778 8.888889 9 21 6
9.1 9.2 9.3 9.4 9.5 9.6 9.7 9.8 9.9 10 22 6.142857
Copyright 2018 CapitaLogic Limited
3. Example 2 Moody's BET
Industry Borrower Diversity score Portfolio EAD 10000000
Aerospace and defense 2 1.5 LGD 60%
Automotive 3 2 PD 3%
Banking 8 3.5 Diversity score 57
Beverage, food, and tobacco 1 1
Chemicals, plastics and rubber 3 2 Worst case no. of defaults 7
Construction and building 2 1.5 XCDR 12.19%
Consumer goods: durable 4 2.333333 XCL 731495
Consumer goods: non-durable 3 2
Containers, packaging and glass 6 3
Energy: oil and gas 2 1.5
Financial institution, retail: insurance 7 3.25
Financial institution, retail: real estate 5 2.666667
Forest products and paper 3 2
Government and public finance 5 2.666667
Healthcare and pharmaceuticals 3 2
Hotel, gaming and leisure 4 2.333333
Media: advertising, printing and publishing 6 3
Media: diversified and production 3 2
Metals and mining 2 1.5
Retail 3 2
Services: business 2 1.5
Transportation: cargo 2 1.5
Transportation: consumer 2 1.5
Utilities: electric 5 2.666667
Utilities: water 6 3
Wholesale 8 3.5
Total 100 57.41667
Copyright 2018 CapitaLogic Limited
4. Example 3 Structured heterogeneous
Debt EAD LGD PD CCC Specific Normal[0,1]Uniform[0,1] Default Loss
1 99226 64.68% 0.11% 0.233578 -0.17159 -0.14961 0.440536 0 0 Systematic 0.001253
2 121793 55.47% 0.50% 0.213456 -0.57974 -0.51358 0.303773 0 0 Default loss 0
3 108530 54.51% 7.41% 0.122952 0.340485 0.319306 0.625253 0 0
4 83405 56.40% 2.13% 0.161367 -1.18796 -1.08739 0.138432 0 0 XCL 597738.8
5 76637 52.61% 0.01% 0.239401 0.058854 0.051941 0.520712 0 0
6 108033 48.70% 1.21% 0.185529 0.587029 0.530322 0.702056 0 0
7 119043 61.23% 1.05% 0.190987 -0.95977 -0.86272 0.194146 0 0 Monte Carlo simulation
8 99985 67.70% 0.87% 0.197672 -1.57851 -1.41336 0.078775 0 0
9 105900 74.40% 2.15% 0.160956 0.167861 0.154262 0.561298 0 0
10 70423 64.49% 4.59% 0.132091 0.115971 0.108496 0.543199 0 0
11 110235 54.11% 9.75% 0.120916 -1.06388 -0.99705 0.159369 0 0
12 106290 56.92% 6.11% 0.125655 -0.58548 -0.54702 0.292182 0 0
13 66627 54.43% 4.92% 0.130252 0.673024 0.628116 0.735036 0 0
14 74849 56.72% 3.90% 0.137073 0.975018 0.906196 0.817584 0 0
15 85565 58.46% 1.97% 0.164813 1.858711 1.699158 0.955355 0 0
16 71209 51.24% 1.39% 0.179889 0.260456 0.236401 0.593439 0 0
17 68684 61.70% 4.30% 0.133978 -0.73093 -0.67975 0.248333 0 0
18 113894 66.17% 4.09% 0.135526 0.696825 0.64835 0.741621 0 0
19 119584 74.74% 4.56% 0.132274 -1.42406 -1.32608 0.092407 0 0
20 97455 78.37% 9.09% 0.121274 0.34894 0.327534 0.628368 0 0
21 115295 70.33% 12.13% 0.120279 -0.4177 -0.39134 0.347773 0 0
22 133704 59.59% 15.89% 0.120043 0.795871 0.747009 0.772471 0 0
23 112362 41.50% 8.57% 0.121653 -0.34831 -0.326 0.372212 0 0
24 113837 44.03% 6.17% 0.125488 -0.47487 -0.44364 0.328653 0 0
25 103345 44.98% 6.53% 0.124584 -0.77745 -0.72697 0.233623 0 0
26 110189 44.94% 11.57% 0.120369 -0.46139 -0.4323 0.332762 0 0
27 95081 66.15% 7.57% 0.122725 0.046579 0.044066 0.517574 0 0
28 113305 66.07% 6.82% 0.123965 -0.11508 -0.10727 0.457289 0 0
29 116042 48.92% 6.45% 0.124771 0.089966 0.084609 0.533714 0 0
30 79473 54.37% 2.33% 0.157431 -1.19699 -1.09824 0.136049 0 0
Using
Copyright 2018 CapitaLogic Limited
5. Example 4 Total heterogeneous, lower
Debt EAD LGD PD Uniform[0,1] Default Loss
1 34696 64.68% 0.11% 0.659003 0 0 Systematic -0.00125
2 41551 55.47% 0.50% 0.880853 0 0 Default loss 14102
3 34875 54.51% 7.41% 0.324041 0 0
4 26907 56.40% 2.13% 0.997748 0 0 XCL 128567.4
5 24546 52.61% 0.01% 0.150464 0 0
6 36779 48.70% 1.21% 0.23281 0 0
7 40519 61.23% 1.05% 0.646259 0 0 Monte Carlo simulation
8 32221 67.70% 0.87% 0.364311 0 0
9 35248 74.40% 2.15% 0.140165 0 0
10 23920 64.49% 4.59% 0.442871 0 0
11 36085 54.11% 9.75% 0.264138 0 0
12 34779 56.92% 6.11% 0.906429 0 0
13 23000 54.43% 4.92% 0.323344 0 0
14 27138 56.72% 3.90% 0.995343 0 0
15 28218 58.46% 1.97% 0.621262 0 0
16 24734 51.24% 1.39% 0.104723 0 0
17 22855 61.70% 4.30% 0.016892 1 14101.54
18 38165 66.17% 4.09% 0.783419 0 0
19 39417 74.74% 4.56% 0.626965 0 0
20 32298 78.37% 9.09% 0.754948 0 0
21 38951 70.33% 12.13% 0.661377 0 0
22 42781 59.59% 15.89% 0.182763 0 0
23 36051 41.50% 8.57% 0.4098 0 0
24 38313 44.03% 6.17% 0.44719 0 0
25 35029 44.98% 6.53% 0.248868 0 0
26 36396 44.94% 11.57% 0.28239 0 0
27 30715 66.15% 7.57% 0.783161 0 0
28 38939 66.07% 6.82% 0.793376 0 0
29 37640 48.92% 6.45% 0.489429 0 0
30 27234 54.37% 2.33% 0.146528 0 0
Using
Copyright 2018 CapitaLogic Limited
6. Example 5 Total heterogeneous, upper
Debt EAD LGD PD Uniform[0,1] Default Loss
1 34696 64.68% 0.11% 0.4995 0 0 Systematic -0.00125
2 41551 55.47% 0.50% 0 0 Default loss 0
3 34875 54.51% 7.41% 0 0
4 26907 56.40% 2.13% 0 0 XCL 572487.6
5 24546 52.61% 0.01% 0 0
6 36779 48.70% 1.21% 0 0
7 40519 61.23% 1.05% 0 0 Monte Carlo simulation
8 32221 67.70% 0.87% 0 0
9 35248 74.40% 2.15% 0 0
10 23920 64.49% 4.59% 0 0
11 36085 54.11% 9.75% 0 0
12 34779 56.92% 6.11% 0 0
13 23000 54.43% 4.92% 0 0
14 27138 56.72% 3.90% 0 0
15 28218 58.46% 1.97% 0 0
16 24734 51.24% 1.39% 0 0
17 22855 61.70% 4.30% 0 0
18 38165 66.17% 4.09% 0 0
19 39417 74.74% 4.56% 0 0
20 32298 78.37% 9.09% 0 0
21 38951 70.33% 12.13% 0 0
22 42781 59.59% 15.89% 0 0
23 36051 41.50% 8.57% 0 0
24 38313 44.03% 6.17% 0 0
25 35029 44.98% 6.53% 0 0
26 36396 44.94% 11.57% 0 0
27 30715 66.15% 7.57% 0 0
28 38939 66.07% 6.82% 0 0
29 37640 48.92% 6.45% 0 0
30 27234 54.37% 2.33% 0 0
Using
Copyright 2018 CapitaLogic Limited
7. Example 6 Application of IHP
EAD LGD Rating RM EAD LGD PD RM
1 9696 51.51% A 1.57 Average 10,007.46 0.4998182 0.0834%
2 10477 50.84% A 1.51 SD 284.99964 0.0141534
3 9527 48.46% A 3.05 CV 2.85% 2.83%
4 9859 48.75% A 1.38
5 10272 51.71% A 1.10 Count 500 500 500
6 9637 48.78% A 2.83 Minimum 9501 0.4752 0.86
7 9572 49.92% A 3.06 Maximum 10494 0.525 3.06
8 9856 51.33% A 1.97 Below 1 year 2.80%
9 10350 49.76% A 1.47
10 10024 48.66% A 1.31
11 10395 51.20% A 1.82
12 10062 49.96% A 2.17 Portfolio EAD 5,003,730
13 9888 52.05% A 2.32 LGD 0.4998182
14 10337 50.37% A 1.72 PD 0.0834%
15 10414 49.66% A 1.00
16 10199 51.20% A 2.35 CCC 0.2350987
17 9920 51.31% A 1.85 XCDR 0.0299643
18 10454 49.16% A 2.23 XCL 74,939
19 10161 50.49% A 1.17
20 10308 52.14% A 1.83
21 9984 48.04% A 1.56
22 9944 51.97% A 2.95
23 10288 47.91% A 1.19
24 10040 48.74% A 2.75
25 10292 52.30% A 2.76
26 10168 51.40% A 1.78
27 9626 47.57% A 2.66
28 10250 50.02% A 1.73
29 10443 51.35% A 2.84
30 10424 51.47% A 2.51
31 9898 50.70% A 1.30
32 9557 52.45% A 2.95
Copyright 2018 CapitaLogic Limited
8. Example 7 Application of SHP
EAD LGD PD RM EAD LGD RM
1 11865 47.42% 0.0333% 1.57 Average 10101.35 0.515385
2 14504 69.70% 0.0834% 1.51 SD 2792.3339 0.1382318
3 10158 57.81% 0.3345% 3.05 CV 27.64% 26.82%
4 13430 56.65% 2.5652% 1.38
5 7575 44.28% 7.1682% 1.10 Count 60 60 60
6 9419 61.85% 0.0333% 2.83 Minimum 5005 0.2577
7 14002 29.74% 0.0834% 3.06 Maximum 14718 0.7446
8 9554 54.44% 0.3345% 1.97 Below 1 year 8.33%
9 10833 52.99% 2.5652% 1.47
10 8110 73.15% 7.1682% 1.31
11 8957 40.95% 0.0333% 1.82
12 14406 42.59% 0.0834% 0.47
13 11232 61.90% 0.3345% 2.32
14 7129 29.32% 2.5652% 1.72
15 6509 52.62% 7.1682% 1.38
16 12466 60.59% 0.0333% 2.35
17 7185 70.80% 0.0834% 1.85
18 9402 42.70% 0.3345% 2.23
19 7880 37.74% 2.5652% 1.17
20 10591 51.84% 7.1682% 1.83
21 12941 65.45% 0.0333% 1.56
22 8007 36.96% 0.0834% 2.95
23 8750 56.18% 0.3345% 1.19
24 6421 47.42% 2.5652% 0.47
25 13785 39.51% 7.1682% 2.76
26 6927 53.13% 0.0333% 1.78
27 6300 53.09% 0.0834% 2.66
28 11764 55.66% 0.3345% 1.73
29 5005 62.40% 2.5652% 0.85
30 11091 44.32% 7.1682% 2.51
31 7096 37.89% 0.0333% 1.30
32 13463 71.42% 0.0834% 2.95
Copyright 2018 CapitaLogic Limited
9. Example 8 LGDs and DRs
Year DR
Senior BBB BB B
Unsecured Senior
2016 68.70% 63.28% 75.50% 0.0000% 0.1340% 1.5310%
2015 62.44% 63.40% 41.46% 0.0000% 0.2910% 2.2390%
2014 53.91% 60.92% 61.22% 0.0590% 0.1410% 0.4980%
2013 55.02% 79.29% 73.64% 0.1200% 0.5820% 0.9060%
2012 56.72% 66.25% 62.65% 0.0710% 0.1430% 0.5430%
2011 58.69% 63.34% 68.11% 0.3550% 0.1590% 0.3430%
2010 49.31% 62.50% 66.34% 0.0750% 0.0000% 0.3830%
2009 63.46% 76.90% 54.69% 0.9300% 1.7650% 7.2150%
2008 66.47% 76.68% 0.70526 1.0240% 2.3430% 3.9890%
2007 46.35% 43.85% 42.79% 0.0000% 0.0000% 0.0000%
2006 44.98% 58.59% 43.89% 0.0000% 0.1940% 1.0700%
2005 45.12% 67.23% 48.75% 0.1630% 0.0000% 0.8150%
2004 47.91% 57.67% 6.00% 0.0000% 0.3780% 0.7960%
2003 58.13% 62.18% 87.69% 0.0000% 0.8790% 2.5810%
2002 70.47% 78.61% 76.60% 1.0140% 1.4000% 4.5730%
2001 78.76% 80.19% 84.06% 0.1800% 1.1590% 9.2400%
2000 75.84% 79.25% 68.14% 0.3500% 1.2690% 5.7440%
1999 61.98% 73.09% 64.36% 0.0930% 1.5030% 4.8950%
1998 60.47% 55.01% 81.81% 0.1090% 0.8960% 3.8750%
1997 43.90% 55.27% 66.90% 0.0000% 0.1750% 1.9980%
1996 37.25% 56.25% 77.40% 0.0000% 0.0000% 1.5050%
1995 52.40% 65.70% 58.46% 0.0000% 0.2670% 4.0150%
1994 46.27% 70.39% 61.99% 0.0000% 0.0000% 4.1910%
1993 62.87% 48.09% 55.85% 0.0000% 0.6220% 4.3760%
1992 50.81% 50.60% 61.96% 0.0000% 0.3370% 7.3450%
1991 63.34% 58.18% 75.58% 0.2490% 3.8480% 13.1990%
1990 61.84% 74.47% 80.50% 0.2650% 3.7660% 13.7070%
1989 56.43% 64.28% 73.19% 0.5290% 2.9570% 7.5490%
1988 54.76% 68.59% 66.23% 0.0000% 1.3530% 5.9340%
1987 36.25% 53.50% 53.12% 0.0000% 3.0240% 5.4370%
Subordinated
LGD
Copyright 2018 CapitaLogic Limited
10. Example 9 Historical simulation 1
XCL 71459
EAD
Year LGD DR Loss
2016 68.7% 0.0000% 0
2015 62.4% 0.0000% 0
2014 53.9% 0.0590% 3180.454
2013 55.0% 0.1200% 6602.04
2012 56.7% 0.0710% 4026.978
2011 58.7% 0.3550% 20836.37
2010 49.3% 0.0750% 3698.175
2009 63.5% 0.9300% 59015.94
2008 66.5% 1.0240% 68068.35
2007 46.3% 0.0000% 0
2006 45.0% 0.0000% 0
2005 45.1% 0.1630% 7354.723
2004 47.9% 0.0000% 0
2003 58.1% 0.0000% 0
2002 70.5% 1.0140% 71458.61
2001 78.8% 0.1800% 14176.8
2000 75.8% 0.3500% 26542.95
1999 62.0% 0.0930% 5764.326
1998 60.5% 0.1090% 6590.685
1997 43.9% 0.0000% 0
1996 37.3% 0.0000% 0
1995 52.4% 0.0000% 0
1994 46.3% 0.0000% 0
1993 62.9% 0.0000% 0
1992 50.8% 0.0000% 0
1991 63.3% 0.2490% 15770.42
1990 61.8% 0.2650% 16387.07
1989 56.4% 0.5290% 29852
1988 54.8% 0.0000% 0
1987 36.2% 0.0000% 0
BBB senior unsecured
10,000,000
Copyright 2018 CapitaLogic Limited
11. Example 10 Historical simulation 2
Default XCL 201229
EAD loss
Year LGD DR Loss LGD DR Loss
2016 68.7% 0.0000% 0 63.3% 0.1340% 5935.476 5935.476
2015 62.4% 0.0000% 0 63.4% 0.2910% 12914.17 12914.17
2014 53.9% 0.0590% 954.1362 60.9% 0.1410% 6012.508 6966.644
2013 55.0% 0.1200% 1980.612 79.3% 0.5820% 32302.75 34283.36
2012 56.7% 0.0710% 1208.093 66.3% 0.1430% 6631.725 7839.819
2011 58.7% 0.3550% 6250.911 63.3% 0.1590% 7049.297 13300.21
2010 49.3% 0.0750% 1109.453 62.5% 0.0000% 0 1109.453
2009 63.5% 0.9300% 17704.78 76.9% 1.7650% 95014.89 112719.7
2008 66.5% 1.0240% 20420.51 76.7% 2.3430% 125762.9 146183.4
2007 46.3% 0.0000% 0 43.8% 0.0000% 0 0
2006 45.0% 0.0000% 0 58.6% 0.1940% 7957.065 7957.065
2005 45.1% 0.1630% 2206.417 67.2% 0.0000% 0 2206.417
2004 47.9% 0.0000% 0 57.7% 0.3780% 15258.69 15258.69
2003 58.1% 0.0000% 0 62.2% 0.8790% 38258.12 38258.12
2002 70.5% 1.0140% 21437.58 78.6% 1.4000% 77041.72 98479.3
2001 78.8% 0.1800% 4253.04 80.2% 1.1590% 65054.09 69307.13
2000 75.8% 0.3500% 7962.885 79.3% 1.2690% 70397.78 78360.66
1999 62.0% 0.0930% 1729.298 73.1% 1.5030% 76894.83 78624.13
1998 60.5% 0.1090% 1977.206 55.0% 0.8960% 34502.9 36480.1
1997 43.9% 0.0000% 0 55.3% 0.1750% 6770.33 6770.33
1996 37.3% 0.0000% 0 56.3% 0.0000% 0 0
1995 52.4% 0.0000% 0 65.7% 0.2670% 12279.33 12279.33
1994 46.3% 0.0000% 0 70.4% 0.0000% 0 0
1993 62.9% 0.0000% 0 48.1% 0.6220% 20937.95 20937.95
1992 50.8% 0.0000% 0 50.6% 0.3370% 11935.36 11935.36
1991 63.3% 0.2490% 4731.125 58.2% 3.8480% 156711 161442.1
1990 61.8% 0.2650% 4916.121 74.5% 3.7660% 196312.5 201228.7
1989 56.4% 0.5290% 8955.6 64.3% 2.9570% 133055.2 142010.8
1988 54.8% 0.0000% 0 68.6% 1.3530% 64961.59 64961.59
1987 36.2% 0.0000% 0 53.5% 3.0240% 113246.7 113246.7
BBB senior unsecured BB subordinated
3,000,000 7,000,000
Copyright 2018 CapitaLogic Limited
12. Example 11 Historical simulation 3
Default XCL 530410
EAD loss
Year LGD DR Loss LGD DR Loss LGD DR Loss
2016 68.7% 0.0000% 0 63.3% 0.1340% 2543.776 75.5% 1.5310% 46236.2 48779.98
2015 62.4% 0.0000% 0 63.4% 0.2910% 5534.645 41.5% 2.2390% 37127.1 42661.74
2014 53.9% 0.0590% 954.1362 60.9% 0.1410% 2576.789 61.2% 0.4980% 12195.02 15725.95
2013 55.0% 0.1200% 1980.612 79.3% 0.5820% 13844.03 73.6% 0.9060% 26687.14 42511.78
2012 56.7% 0.0710% 1208.093 66.3% 0.1430% 2842.168 62.7% 0.5430% 13608.45 17658.71
2011 58.7% 0.3550% 6250.911 63.3% 0.1590% 3021.127 68.1% 0.3430% 9344.966 18617
2010 49.3% 0.0750% 1109.453 62.5% 0.0000% 0 66.3% 0.3830% 10162.52 11271.97
2009 63.5% 0.9300% 17704.78 76.9% 1.7650% 40720.67 54.7% 7.2150% 157841.1 216266.6
2008 66.5% 1.0240% 20420.51 76.7% 2.3430% 53898.37 70.5% 3.9890% 112531.3 186850.2
2007 46.3% 0.0000% 0 43.8% 0.0000% 0 42.8% 0.0000% 0 0
2006 45.0% 0.0000% 0 58.6% 0.1940% 3410.171 43.9% 1.0700% 18784.92 22195.09
2005 45.1% 0.1630% 2206.417 67.2% 0.0000% 0 48.8% 0.8150% 15892.5 18098.92
2004 47.9% 0.0000% 0 57.7% 0.3780% 6539.438 6.0% 0.7960% 1910.4 8449.838
2003 58.1% 0.0000% 0 62.2% 0.8790% 16396.34 87.7% 2.5810% 90528.06 106924.4
2002 70.5% 1.0140% 21437.58 78.6% 1.4000% 33017.88 76.6% 4.5730% 140116.7 194572.2
2001 78.8% 0.1800% 4253.04 80.2% 1.1590% 27880.32 84.1% 9.2400% 310678.4 342811.7
2000 75.8% 0.3500% 7962.885 79.3% 1.2690% 30170.48 68.1% 5.7440% 156547 194680.3
1999 62.0% 0.0930% 1729.298 73.1% 1.5030% 32954.93 64.4% 4.8950% 126011 160695.2
1998 60.5% 0.1090% 1977.206 55.0% 0.8960% 14786.96 81.8% 3.8750% 126807.1 143571.2
1997 43.9% 0.0000% 0 55.3% 0.1750% 2901.57 66.9% 1.9980% 53468.08 56369.65
1996 37.3% 0.0000% 0 56.3% 0.0000% 0 77.4% 1.5050% 46592.39 46592.39
1995 52.4% 0.0000% 0 65.7% 0.2670% 5262.57 58.5% 4.0150% 93883.55 99146.12
1994 46.3% 0.0000% 0 70.4% 0.0000% 0 62.0% 4.1910% 103923.4 103923.4
1993 62.9% 0.0000% 0 48.1% 0.6220% 8973.407 55.9% 4.3760% 97766.84 106740.2
1992 50.8% 0.0000% 0 50.6% 0.3370% 5115.155 62.0% 7.3450% 182029.7 187144.8
1991 63.3% 0.2490% 4731.125 58.2% 3.8480% 67161.84 75.6% 13.1990% 399053.3 470946.2
1990 61.8% 0.2650% 4916.121 74.5% 3.7660% 84133.95 80.5% 13.7070% 441359.9 530410
1989 56.4% 0.5290% 8955.6 64.3% 2.9570% 57023.68 73.2% 7.5490% 220995.5 286974.7
1988 54.8% 0.0000% 0 68.6% 1.3530% 27840.68 66.2% 5.9340% 157201.2 185041.8
1987 36.2% 0.0000% 0 53.5% 3.0240% 48534.29 53.1% 5.4370% 115514.5 164048.8
B subordinated
4,000,000
BBB senior unsecured BB subordinated senior
3,000,000 3,000,000
Copyright 2018 CapitaLogic Limited