SlideShare a Scribd company logo
1 of 136
1.
Student: Kiare Mays
Date: 06/15/20
Instructor: Valery Shemetov
Course: MTH154 – Quantitative
Reasoning (with MCR4)
Assignment: Section 5.2 Homework
(1) number of years
number of gallons
Per Capita Beer Consumption
(2)
(3) years
gallons
Per Capita Beer Consumption
(4) gallons.
year.
five years.
The decline in per capita beer consumption is shown in the
scatter plot.
(a) What is the slope of the linear trendline?
(b) Interpret the slope in real world terms by filling in the
blanks.
1975 1980 1985 1990 1995 2000 2005 2010
20.5
21
21.5
22
22.5
23
23.5
24
24.5
25
ga
llo
ns
(a) The slope of the linear trendline is .
(Type an integer or a decimal.)
(b) The (1) is changing by (2) (3) per (4)
years
281.75
− 0.13
Per Capita Beer Consumption
y = − 0.13x + 281.75
2.
3.
(1) Per Capita Entitlement Spending
number of 2011$
number of years
(2)
(3) years
2011$
Per Capita Entitlement Spending
(4) year.
decade.
2011$.
The amount the government spends per person on
social programs (entitlement spending) has been
steadily increasing in a certain country (all values
2011$):
(a) What is the slope of the linear trendline?
(b) Interpret the slope in real world terms by filling in the
blanks.
1950 1960 1970 1980 1990 2000 2010 2020
$0.00
$1,000.00
$2,000.00
$3,000.00
$4,000.00
$5,000.00
$6,000.00
$7,000.00
$8,000.00
20
11
$
(a) The slope of the linear trendline is .
(Type an integer or a decimal.)
(b) The (1) is changing by (2) (3) per (4)
− 210,276
107.6
(1) Average Strikeouts Per Team Per Game
number of strikeouts
number of years
(2)
(3) Average Strikeouts Per Team Per Game
years
strikeouts
(4) year.
decade.
strikeout.
The number of strikeouts in a baseball league has been on the
rise since 1980.
(a) What is the slope of the linear trendline?
(b) Interpret the slope in real world terms by filling in the
blanks.
1975 1980 1985 1990 1995 2000 2005 2010 2015
4
4.5
5
5.5
6
6.5
7
7.5
8
#
st
rik
eo
ut
s
(a) The slope of the linear trendline is .
(Type an integer or a decimal.)
(b) The (1) is changing by (2) (3) per (4)
0.0672
− 128.19
Government Entitlement Spending
y = 107.6x − 210,276
Average Strikeouts per Team per Game
y = 0.0672x − 128.19
4.
5.
(1)
Consider the graph to the right.
a. In words, describe the function shown on the graph.
b.Find the slope of the graph and express it as a rate of
change.
c. Briefly discuss the conditions under which a linear function
is a realistic model for the given situation.
0 1 2 3 4 5
0
1
2
3
4
5
Time (hours)
R
ai
n
D
ep
th
(i
nc
he
s)
a. Select the correct answer below.
A. According to the function, the rain depth increases by every
.4 inches 1 hour
B. According to the function, the rain depth decreases by
every .4 inches 1 hour
C. According to the function, the rain depth increases by every
.1 inch 4 hours
D. According to the function, the rain depth decreases by
every .1 inch 4 hours
b. Calculate the slope and represent it as a rate of change.
rate of change (1) =
(Type an integer or a fraction.)
c. Select the correct answer below.
A. It is a good model if the rate of the rainfall decreases over
time.
B. It is a good model if the rate of the rainfall does not remain
constant over time.
C. It is a good model if the rate of the rainfall remains constant
over time.
D. It is a good model if the rate of the rainfall increases over
time.
inch(es) per hour
hour(s) per inch
Plot the two given points and then sketch the line that contains
the points. Find the run and rise in going from the first point
listed to the second point listed. Find the slope of the line.
( , ) and ( , ) − 8 − 3 − 3 − 23
Choose the correct graph below.
A.
-12 12
-36
36
x
y
B.
-12 12
-36
36
x
y
C.
-12 12
-36
36
x
y
D.
-12 12
-36
36
x
y
The run of the line is . (Type an integer or a simplified
fraction.)
The rise of the line is . (Type an integer or a simplified
fraction.)
The slope of the line is . (Type an integer or a simplified
fraction.)
6.
7.
A person's annual salary increases by $ over -year period. Find
the average rate of change of the salary per
year.
11,000 an 11
The average rate of change is $ per year.
In response to rising concerns about identity theft, the number
of models of paper shredders a company manufactures
increased approximately steadily from models in to models in
. Find the average rate of change of the
number of shredder models manufactured per year between and
.
4 1996 38 2006
1996 2006
The average rate of change of the number of paper shredders
manufactured per year between and was
.
1996 2006
(Type an integer or decimal rounded to two decimal places as
needed.)
8. The number of country households that paid bills online was
million in 2006 and has increased by about million per
year. Let n be the number of households (in millions) that paid
bills online at t years since 2006. Complete parts a. and b.
16 4
a. Is there a linear relationship between t and n? Explain. If the
relationship is linear, find the slope and describe what it
means in this situation.
Choose the correct answer below, and if necessary, fill in the
answer box.
A. Yes. Since the rate of change of the number of country
households that paid bills online per
year is a constant million per year, the variables t and n are
linearly related. The slope is
. The number of households that pay bills online has decreased
by
million per year.
4
B. Yes. Since the rate of change of the number of country
households that paid bills online per
year is a constant million per year, the variables t and n are
linearly related. The slope is
. The number of households that pay bills online has increased
by
million per year.
4
C. No. Since the rate of change of the number of country
households that paid bills online per year
varries per year, the variables t and n are not linearly related.
b. Describe the Rule of Four as it applies to this situation.
i. Use an equation to describe the number of households (in
millions) that paid bills online t years since 2006.
n (Type an expression using t as the variable.)=
ii. Use a table of values of t and n to describe the situation.
Years
since 2006
t
Number of households
(millions)
n
0
1
2
3
4
(Type integers or decimals.)
iii. Use a graph to describe the situation. Choose the correct
graph below.
A.
0 5
0
100
t
n
B.
0 5
0
100
t
n
C.
0 5
0
100
t
n
D.
0 5
0
100
t
n
9.
10.
Let n be the number of oil refineries at t years since . A
reasonable model of the number of oil refineries is
n t .
2001
= − 3.42 + 135.55
a. What is the slope? What does it mean in this situation?
b. What is the n-intercept? What does it mean in this situation?
c. Predict the number of refineries in .2013
a. What is the slope?
m =
What does the slope mean in this situation?
A. It means the number of refineries in was about .2001 135.55
B. It means that the number of refineries are decreasing by
about per year.135.55
C. It means the number of refineries in was about .2001 3.42
D. It means that the number of refineries are decreasing by
about per year.3.42
b. What is the n-intercept?
(Type an ordered pair.)
What does the n-intercept mean in this situation?
A. It means that the number of refineries are decreasing by
about per year.3.42
B. It means the number of refineries in was about .2001 3.42
C. It means that the number of refineries are decreasing by
about per year.135.55
D. It means the number of refineries in was about .2001 135.55
c. Predict the number of refineries in .2013
The number of refineries will be about .
(Round to the nearest whole number as needed.)
Let F be the temperature (in degrees Fahrenheit) at t hours
after noon. The line in the figure shown below describes the
relationship between t and F.
0 1 2 3 4 5 6
0
10
20
30
40
50
60
Hours
D
eg
re
es
F
ah
re
nh
ei
t
t
F
Complete parts a. and b.
a. Is the rate of change of temperature per hour constant?
Explain.
A. Yes because there is a linear relationship
between t and F.
B. No because there is no linear
relationship between t and F.
b. What is the rate of change of temperature per hour?
F°
(Type an integer or decimal rounded to two decimal places
as needed.)
11.
12.
The number of strikeouts in a baseball league has been on
the rise since 1980.
(a) What is the y-intercept of the linear trendline?
(b) Interpret the y-intercept in real world terms.
1975 1980 1985 1990 1995 2000 2005 2010 2015
4
4.5
5
5.5
6
6.5
7
7.5
8
#
st
rik
eo
ut
s
(a) The y-intercept of the linear trendline is .
(Type an integer or a decimal.)
(b) Choose the correct answer below.
A. The Average Strikeouts Per Team Per Game in 0 CE was
about , which makes no sense in
real world terms.
4.5
B. The Average Strikeouts Per Team Per Game in 0 CE was ,
which makes no sense in
real world terms.
− 141.87
C. The Average Strikeouts Per Team Per Game in 1975 was
about .4.5
D. The Average Strikeouts Per Team Per Game in 1975 was ,
which makes no sense in
real world terms.
− 141.87
The amount the government spends per person on
social programs (entitlement spending) has been
steadily increasing in a certain country (all values
2011$):
(a) What is the y-intercept of the linear trendline?
(b) Interpret the y-intercept in real world terms.
1950 1960 1970 1980 1990 2000 2010 2020
$0.00
$1,000.00
$2,000.00
$3,000.00
$4,000.00
$5,000.00
$6,000.00
$7,000.00
$8,000.00
20
11
$
(a) The y-intercept of the linear trendline is .
(Type an integer or a decimal.)
(b) Choose the correct answer below.
A. The Per Capita Entitlement Spending was $1,000 (2011$) in
1950, which makes no sense
in real world terms.
−
B. The Per Capita Entitlement Spending was (2011$) in 1950,
which makes no
sense in real world terms.
− $208,025
C. The Per Capita Entitlement Spending was (2011$) in 0 CE,
which makes no sense
in real world terms.
$208,025
D. The Per Capita Entitlement Spending was (2011$) in 0 CE,
which makes no
sense in real world terms.
− $208,025
Average Strikeouts per Team per Game
y = 0.0741x − 141.87
Government Entitlement Spending
y = 106.48x − 208,025
13. Water is steadily pumped out of a flooded basement. Let v
be the volume of water (in thousands of gallons) that
remains in the basement t hours after the water began to be
pumped. A linear model is shown below.
-1 1 2 3 4 5 6 7 8 9
-4
4
8
12
16
20
24
28
32
Hours
Th
ou
sa
nd
s
of
g
al
lo
ns
t
Complete parts a) through d).
a) How much water is in the basement after hours of
pumping?
3
thousand gallons
b) After how many hours of pumping will thousand gallons
remain in the basement?
6
hours
c) How much water was in the basement before any water
was pumped out?
thousand gallons
d) After how many hours of pumping will all the water be
pumped out of the basement?
hours
14. Let g be the number of gallons of gasoline that remain in a
car's gasoline tank after the car has been driven d miles
since the tank was filled. Some pairs of values of d and g
are shown in the following table.
d
(miles)
g
(gallons)
20 12
40 10
60 8
80 6
100 4
120 2
Complete parts a. to e.
a. Create a scattergram of the data. Then draw a linear
model.
Choose the correct scattergram below.
A.
0 160
0
16
d
g
B.
0 160
0
16
d
g
C.
0 160
0
16
d
g
D.
0 160
0
16
d
g
b. Estimate how much gasoline is in the tank after the driver
has gone miles since last filling up.70
After the driver has gone miles since last filling up, there
will be gallons of gasoline in the tank.
70
c. Estimate the number of miles driven since the tank was
last filled if of gasoline in the tank.1 gallon remains
The driver drove miles since the tank was
last filled if of gasoline in the tank.1 gallon is
d. Find the d-intercept of the model. What does it mean in
this situation?
Select the correct choice below and, if necessary, fill in the
answer box to complete your choice.
(Type an ordered pair.)
A. The d-intercept of the model is
. The d-intercept
estimates the number miles after which
the gasoline tank will be empty.
B. The d-intercept of the model is
. The d-intercept
estimates the number of gallons of
gasoline in the tank at the start of the
trip.
e. Find the g-intercept of the model. What does it mean in
this situation?
Select the correct choice below and, if necessary, fill in the
answer box to complete your choice.
(Type an ordered pair.)
A. The g-intercept of the model is
g p
. The g-intercept
estimates the number of gallons of
gasoline in the tank at the start of the
trip.
B. The g-intercept of the model is
. The g-intercept
estimates the number miles after which
the gasoline tank will be empty.
15.
16.
17.
A person earns a starting salary of $ thousand at a company.
Each year, he receives a $ thousand raise. Let s be the
salary (in thousands of dollars) after he has worked at the
company for t years. Complete parts (a) through (e).
8 2
a. Complete the table to help find an equation for t and s. Show
the arithmetic that helps to identify the pattern.
(Do not include the $ symbol in your answers.)
Time at Company
(years)
t
Salary
(thousands of dollars)
s
0 +2 •
1 +2 •
2 +2 •
3 +2 •
4 +2 •
s (Type an expression using t as the variable.)=
b. Perform a unit analysis of the equation found in part (a).
Choose the correct answer below.
A. In the equation, the units on both sides are thousands of
dollars, so the equation is correct.
B. In the equation, the units on both sides are years, so the
equation is correct.
C. In the equation, the units on one side are thousands of dollars
and the units on the other side
are years, so the equation is correct.
c. Graph the equation by hand.
Choose the correct graph below.
A.
0 8
0
24
t
s
B.
0 8
0
24
t
s
C.
0 8
0
24
t
s
D.
0 8
0
24
t
s
d. What is the s-intercept? What does it mean in this situation?
Select the correct choice below and fill in the answer box to
complete your choice.
(Type an ordered pair.)
A. The s-intercept of the model is , and it represents the
person's salary when he
quits the job.
B. The s-intercept of the model is , and it represents the
person's salary when he
joined the company.
e. When will the person's salary be $ thousand?18
The person's salary will be $ thousand after years.18
(Type an integer or a decimal.)
You can not print this question until you complete the required
media.
You can not print this question until you complete the required
media.
1.
Student: Kiare Mays
Date: 06/15/20
Instructor: Valery Shemetov
Course: MTH154 – Quantitative
Reasoning (with MCR4)
Assignment: Section 5.4 Homework
The percentages of dentistry degrees earned by
women are shown in the table for various years.
Year Percent
1970 3
1980 15
1990 28
2000 41
2002 40
Let p be the percentage of dentistry degrees earned by women at
t years since 1970. For example, t = 0 represents 1970
and t = 10 represents 1980.
a. Create a scattergram of the data. Choose the correct
scattergram below.
A.
0 10 20 30 40
0
10
20
30
40
50
60
t
p
B.
0 10 20 30 40
0
10
20
30
40
50
60
t
p
C.
0 10 20 30 40
0
10
20
30
40
50
60
t
p
D.
0 10 20 30 40
0
10
20
30
40
50
60
t
p
b. Draw a line that comes close to the points in your
scattergram. Choose the correct scattergram below.
A.
0 10 20 30 40
0
10
20
30
40
50
60
t
p
B.
0 10 20 30 40
0
10
20
30
40
50
60
t
p
C.
0 10 20 30 40
0
10
20
30
40
50
60
t
p
D.
0 10 20 30 40
0
10
20
30
40
50
60
t
p
c. Predict the percentage of dentistry degrees that will be earned
by women in 2010.
The percentage of dentistry degrees earned by women in 2010
will be about %.
d. Estimate when women earned 20% of dentistry degrees.
Women earned 20% of dentistry degrees in .
2. If there are too many ticketed passengers for a flight, a
person can volunteer to be
"bumped" onto another flight. The voluntary bumping rates for
large U.S. airlines (number of
bumps per 10,000 passengers, January through September) are
shown in the table for
various years. Let r be the voluntary bumping rate (number of
bumps per 10,000
passengers) at t years since 2000.
Year Bumping Rate
2000 23
2001 21
2002 20
2003 15
2004 14
2005 12
a. Create a scattergram of the data. Choose the correct graph
below.
A.
0 5 10 15 20 25
0
1
2
3
4
5
Years since 2000
Bu
m
pi
ng
R
at
e
t
r
B.
0 1 2 3 4 5
0
5
10
15
20
25
Years since 2000
Bu
m
pi
ng
R
at
e
t
r
C.
0 1 2 3 4 5
0
5
10
15
20
25
Years since 2000
Bu
m
pi
ng
R
at
e
t
r
b. Draw a line that comes close to the points in your
scattergram.
Choose the correct graph below.
A.
0 5 10 15
0
5
10
15
20
25
Years since 2000
Bu
m
pi
ng
R
at
e
t
r
B.
0 5 10 15
0
5
10
15
20
25
Years since 2000
Bu
m
pi
ng
R
at
e
t
r
C.
0 5 10 15 20 25
0
5
10
15
Years since 2000
Bu
m
pi
ng
R
at
e
t
r
c. What is the r-intercept of the line in part b.?
(Round to the nearest integer. Type an ordered pair.)
What does it mean in this situation?
A. According to the model, the average bumping rate will be 0
per passengers in the year
20 .
10,000
23
B. According to the model, the average bumping rate per
passengers was decreasing by
in the year 2000.
10,000
23
C. According to the model, the average bumping rate was per
passengers in the year
2000.
23 10,000
d. Predict when the voluntary bumping rate will be bumps per
10,000 passengers using the line in part b.5
(Round to the nearest year.)
e. What is the t-intercept of the line in part b.?
(Round to the nearest integer. Type an ordered pair.)
What does it mean in this situation?
A. According to the model, the average bumping rate was per
passengers in the year
2000. This seems reasonable, since the airlines cannot eliminate
bumping completely.
10 10,000
B. According to the model, the average bumping rate will be 0
per passengers in the year
. Since this prediction implies that the airlines will eliminate
bumping completely, it is not
plausible, and therefore model breakdown has occurred.
10,000
2010
C. According to the model, the average bumping rate will be 0
per passengers in the year
. Since this prediction implies that the airlines will eliminate
bumping completely, it is not
plausible, and therefore model breakdown has occurred.
10
2010
3. The percentages of people who are satisfied
with the way things are in their country are
shown in the table on the right for various
years.
Year Percent Year Percent
1992 16 1996 40
1993 24 1997 45
1994 28 1998 52
1995 37 1999 51
Let p be the percentage of people at t years since 1990 who are
satisfied with the way things are.
a. Create a scattergram of the data. Choose the correct answer
below.
A.
0 3 6 9 12 15
0
15
30
45
60
75
90
t
p
B.
0 3 6 9 12 15
0
15
30
45
60
75
90
t
p
C.
0 3 6 9 12 15
0
15
30
45
60
75
90
t
p
D.
0 3 6 9 12 15
0
15
30
45
60
75
90
t
p
b. Draw a line that comes close to the data points. Choose the
correct answer below.
A.
0 3 6 9 12 15
0
15
30
45
60
75
90
t
p
B.
0 3 6 9 12 15
0
15
30
45
60
75
90
t
p
C.
0 3 6 9 12 15
0
15
30
45
60
75
90
t
p
D.
0 3 6 9 12 15
0
15
30
45
60
75
90
t
p
c. Use your line to estimate the percentage of people who were
satisfied in .2003
The percentage of people who were satisfied in is %.2003
d. Data for the years 2000-2004 are shown in the table
on the right.
Year Percent Year Percent
2000 52 2003 43
2001 48 2004 41
2002 46
Create a scattergram of the data for the years 1992-2004.
Choose the correct answer below.
A.
0 3 6 9 12 15
0
15
30
45
60
75
90
t
p
B.
0 3 6 9 12 15
0
15
30
45
60
75
90
t
p
C.
0 3 6 9 12 15
0
15
30
45
60
75
90
t
p
D.
0 3 6 9 12 15
0
15
30
45
60
75
90
t
p
e. Compute the error in the estimation for that you made in part
(c). (The error is the difference between the estimated
percentage and the actual percentage.)
2003
The error in the estimation for is %.2003
4.
5.
The windchill is a measure of how cold you feel as a result of
being exposed to wind. The table below provides some data
on windchills for various temperatures for a certain wind
speed.
Temperature (oF) Windchill (oF)
− 15 − 31
− 12 − 26
− 5 − 20
4 − 11
10 − 3
13 5
18 10
25 13
Let w be the windchill (in degrees Fahrenheit) corresponding
to a temperature of t degrees Fahrenheit.
(a) Without graphing, estimate the coordinates of the
t-intercept for a line that comes close to the data points.
Choose the correct answer below.
( ,0)13
( ,0)− 13
( ,0)10
( ,0)12
(b) Without graphing, estimate the coordinates of the
w-intercept for a line that comes close to the data
points.Choose the correct answer below.
(0, )12
(0, )− 11
(0, )− 13
(0, )− 20
Consider the scattergram of data and the graph of the
model y = mx + b in the indicated figure. Sketch the
graph of a linear model that describes the data better.
0 14
0
14
x
y
Choose the correct answer below.
A.
0 14
0
14
x
y
B.
0 14
0
14
x
y
C.
0 14
0
14
x
y
D.
0 14
0
14
x
y
6. The table lists College record times for the men's 400-meter
run.
Year 1900 1916 1928 1932 1941 1950 1961 1968 1988 1999
Record Time
(seconds) 54.6 54.2 53.8 52.9 52.7 52.6 51.5 50.35 49.71 49.64
a. Let r be the record time (in seconds) at t years since 1900.
Use a graphing calculator to draw a scattergram of the data.
Choose the correct answer below.
A.
0 120
40
60
B.
0 120
40
60
C.
0 120
40
60
D.
0 120
40
60
b. Find an equation of a linear model to describe the data.
Choose the equation below that best represents the data.
A. r = 0.062t + 55.192
B. t = − 0.062r + 55.192
C. r = − 0.05t + 57.173
D. r = − 0.062t + 55.192
c. Draw your line and the scattergram in the same viewing
window. Verify that the line passes through the two points you
chose in finding the equation in part (b) and that it comes close
to all of the data points. Choose the correct answer below.
A.
0 120
40
60
B.
0 120
40
60
C.
0 120
40
60
D.
0 120
40
60
7. The market shares (percentages of vehicle sales) of an
automobile company are shown in the table
to the right for various years. Use the table to answer parts (a)
through (e). Year
Market
Share (%)
1998 26
2000 23
2002 20
2004 19
2006 15
2008 14
a. Let s f(t) be the company's market share (in percent) at t
years since 1995. Find an equation of f using the data points
for the years 2000 and 2008. Does the model fit the data well?
=
f(t) =
(Round to three decimal places as needed.)
Does the model fit the data well?
Yes
No
b. Find f( ). What does it mean in this situation?4
f( )4 =
(Round to three decimal places as needed.)
Intepret the result.
According to the model, % of the market share belongs to the
automobile company in the year
.
(Round to the nearest year as needed.)
c. Find t when f(t) . What does it mean in this situation?= 6
t =
(Round to two decimal places as needed.)
Interpret the result.
According to the model, % of the market share belongs to the
automobile company in the year
.
(Round to the nearest year as needed.)
d. Find the t-intercept. What does it mean in this situation?
The t-intercept is .
(Type an ordered pair. Round to two decimal places as needed.)
Interpret the t-intercept.
According to the model, % of the market share belongs to the
automobile company in the year
.
(Round to the nearest year as needed.)
e. Find the s-intercept. What does it mean in this situation?
The s-intercept is .
(Type an ordered pair. Round to three decimal places as
needed.)
Intepret the s-intercept.
8.
According to the model, % of the market share belongs to the
automobile company in the year
.
(Round to the nearest year as needed.)
An equation models the percentage p of births outside marriage
in a
country at t years since 1900 (see table on the right.) Use the
equation to answer parts (a)
through (e).
p = 0.77t − 43.18 Year Percent of Births Outside Marriage
1970 10.7
1975 14.6
1980 18.4
1985 22.3
1990 26.1
1995 30.0
2000 33.8
2005 37.7
a. Rewrite the equation with the function name f. Choose the
correct answer below.p = 0.77t − 43.18
A. f(t) = 0.77p − 43.18 B. f(p) = 0.77p − 43.18
C. f(p) = t D. f(t) = 0.77t − 43.18
b. Find f( ). What does the result mean in this situation?114
f( ) (Type an integer or a decimal.)114 =
Interpret the result.
According to the model, about % of births in the year will be
outside marriage.
(Round to the nearest year as needed.)
c. Find the value of t so that f(t) . What does the result mean in
this situation?= 55
t (Round to two decimal places as needed.) =
Interpret the result.
According to the model, % of births around the year will be
outside marriage.
(Round to the nearest year as needed.)
d. According to the model, in what year will all births be
outside marriage?
All births will be outside marriage in the year .
(Round to the nearest year as needed.)
e. Estimate the percentage of births outside marriage in 1997.
The actual percentage is 32.4%. What is the error in the
estimate? (The error is the difference between the estimated
value and the actual value.)
According to the model, % of births were outside of marriage in
1997.
(Round to one decimal place as needed.)
Find the error.
The error is percentage point(s).
(Type an integer or a decimal. Use the answer from the previous
step to find this answer.)
9.
10.
11.
The number of commercial airline boardings on domestic
flights increased steadily during the 1990s. Let f(t) be the
number of commercial airline boardings on domestic flights
(in millions) for the year that is t years since 1990.
Year Number of Boardings(millions)
1991 452
1993 481
1995 548
1997 597
1999 634
2000 667
a. Use a graphing calculator to draw a scattergram of the
data. Choose the correct graph below.
A. B.
C. D.
The viewing window for all graphs is Xmin 0, Xmax 11,
Xscl 1, Ymin 430, Ymax 680, Yscl 25.
= =
= = = =
b. Find an equation of f. Does your model fit the data well?
Choose the correct answer below.
A. f(t) t= 24.32 + 421.33
B. f(t) t= 421.33 + 24.32
C. f(t) f= 421.33 − 24.32
D. f(t) f= 24.32 − 421.33
Does your model fit the data well?
no
yes
c. Use your model f to estimate the number of boardings in
.2004
The model predicts that the number of boardings in is
million.
2004
(Round to the nearest integer as needed.)
The actual number was million. What is the error in
your estimate?
694
The error is million.
(Round to the nearest integer as needed.)
The percentage of female workers who prefer a female boss
over a male boss increased approximately linearly from %
in 1975 to % in 2006. Predict when % of female workers will
prefer a female boss.
11
25 31
% of female workers will prefer a female boss in year .31
(Round to the nearest whole number as needed.)
You can not print this question until you complete the required
media.
12. You can not print this question until you complete the
required media.
1.
2.
3.
Student: Kiare Mays
Date: 06/15/20
Instructor: Valery Shemetov
Course: MTH154 – Quantitative
Reasoning (with MCR4)
Assignment: Section 5.3 Homework
The following situation involves a rate of change that is
constant. Write a statement that describes how one variable
changes with respect to the other, give the rate of change
numerically (with units), and use the rate of change rule to
answer any questions.
You run along a path at a constant speed of miles per hour.
How far do you travel in hours? in hours?5.6 1.9 3.8
Which statement describes this situation?
A. Time varies with respect to distance traveled with a rate of
change of mi/h.5.6
B. Time varies with respect to distance traveled with a rate of
change of h/mi.5.6
C. The distance traveled varies with respect to time with a rate
of change of mi/h.5.6
D. The distance traveled varies with respect to time with a rate
of change of h/mi.5.6
What is the distance traveled after hours?1.9
miles
(Type an integer or a decimal.)
What is the distance traveled after hours?3.8
miles
(Type an integer or a decimal.)
The following situation can be modeled by a linear function.
Write an equation for the linear function and use it to answer
the
given question.
The price of a particular model car is $ today and rises with
time at a constant rate of $ per year. How much will a
new car cost in years?
21,000 980
3.3
The equation used to model this situation is , where p is the
price of a car in dollars and t is time in years.
The price of a car after years will be $ .3.3
A $ washing machine in a laundromat is depreciated for tax
purposes at a rate of per year. Find a function for the
depreciated value of the washing machine as it varies with time.
When does the depreciated value reach $0?
1260 $90
The equation of the line in slope-intercept form is V .=
(Type your answer in slope-intercept form. Type an expression
using t as the variable. Do not include the $ symbol in your
answer.)
It takes years for the machine to depreciate to $ .0
4.
5.
Find the slope and the point containing the y-intercept. Then
graph the equation.
y x= − 7 − 2
What is the slope?
(Type an integer or a fraction.)
What is the point containing the y-intercept?
(Type an ordered pair.)
Use the graphing tool to graph the line. Use the slope and
y-intercept when drawing the line.
-20 -16 -12 -8 -4 4 8 12 16 20
-20
-16
-12
-8
-4
4
8
12
16
20
x
y
Use the slope and the point containing the y-intercept to
graph the line.
y x= 3 − 8
What is the slope?
(Type an integer or a fraction.)
What is the point containing the y-intercept?
(Type an ordered pair.)
Use the graphing tool to graph the line. Use the slope and
y-intercept when drawing the line.
-10 -8 -6 -4 -2 2 4 6 8 10
-10
-8
-6
-4
-2
2
4
6
8
10
x
y
6.
7.
8.
(1) dependent
independent
(2) dependent
independent
(3) is not
is
A group of climbers begin climbing at an elevation of
feet and ascend at a steady rate of vertical feet per
hour. This situation can be modeled by a linear function.
Identify the independent and dependent variables. Draw a
graph of the function, then use the graph to find their
elevation after hours. Is a linear model reasonable for this
situation?
7500
1500
2
The number of hours is the (1) variable.
The elevation in feet is the (2) variable.
Use the graphing tool to graph the line.
The elevation after hours is feet.2
A linear model (3) reasonable.
0 1 2 3 4 5 6
2000
4000
6000
8000
10,000
12,000
14,000
16,000
Number of Hours
El
ev
at
io
n
(fe
et
)
Find the y-intercept and graph the equation by
hand. Use a graphing calculator to verify your answer.
y = 3x − 2
Use the graphing tool to graph the line. Use the y-intercept
and another point when drawing the line.
-10 -8 -6 -4 -2 2 4 6 8 10
-10
-8
-6
-4
-2
2
4
6
8
10
x
y
Find an equation of the line that contains the points listed in the
following table.
x y
0 0
1 − 6
2 − 12
3 − 18
4 − 24
The equation of the line is y . =
(Use integers or fractions for any numbers in the equation.)
9.
10.
11.
12.
13.
The graph of an equation is shown to the right.
a. Create a table of ordered-pair solutions of this equation.
b. Find an equation of the line. [Hint: Recognize a pattern
from the table you created in part (a).]
a. x y
− 2
− 1
0
1
2
b. What is an equation of this line?
y (Simplify your answer.)=
-10 -8 -6 -4 -2 2 4 6 8 10
-10
-8
-6
-4
-2
2
4
6
8
10
x
y
Determine the slope and the y-intercept. Use the slope and
the y-intercept to graph the equation. Use a graphing
calculator to verify your work.
y x= 4 − 2
The slope is m .=
(Simplify your answer.)
The y-intercept is .
(Type an ordered pair. Simplify your answer.)
Use the graphing tool to graph the equation. Use the slope
and y-intercept when drawing the line.
-10 -8 -6 -4 -2 2 4 6 8 10
-10
-8
-6
-4
-2
2
4
6
8
10
x
y
Let y be the value (in thousands of
dollars) of a car when it is x years old.
Some pairs of values of x and y are
listed in the table. Find an equation that
describes the relationship between x
and y.
Age (years), x Value (thousands of
dollars), y
0 61
1 54
2 47
3 40
4 33
The equation that describes the relationship between x and y is
y .=
(Do not factor.)
You can not print this question until you complete the required
media.
You can not print this question until you complete the required
media.
1.
2.
3.
Student: Kiare Mays
Date: 06/15/20
Instructor: Valery Shemetov
Course: MTH154 – Quantitative
Reasoning (with MCR4)
Assignment: Section 6.1 Homework
You deposit $ into a savings account with an APR of %.
Complete parts (a) through (c) below.4000 5.7
(a) Compute the amount of interest you gain after 1 year.
$ (Round to the nearest dollar as needed.)
(b) To compute the amount of money in the savings account at
the end of 1 year, take the original value and add interest:
. This is equivalent to multiplying $ by what factor?$4000 +
5.7% • $4000 4000
(Round to three decimal places as needed.)
(c) Fill in the following table, one year at a time:
(Round to the nearest cent as needed.)
Year Beginning Interest End
1 $4000 $ $
2 $ $ $
3 $ $ $
4 $ $ $
5 $ $ $
Calculate the amount of money you'll have at the end of the
indicated time period, assuming that you earn simple interest.
You deposit $ in an account with an annual interest of % for
years.3900 3.2 5
The amount of money you'll have at the end of years is $ .5
(Type an integer or a decimal.)
Complete the table, for the following investments, which
shows the performance (interest and balance) over a
5-year period.
Suzanne deposits $ in an account that earns simple
interest at an annual rate of %. Derek deposits $
in an account that earns compound interest at an annual
rate of % and is compounded annually.
4000
4.4 4000
4.4
Year
Suzanne's
Annual
Interest
Suzanne's
Balance
Derek's
Annual
Interest
Derek's
Balance
1 $____ $____ $____ $____
2 $____ $____ $____ $____
3 $____ $____ $____ $____
4 $____ $____ $____ $____
5 $____ $____ $____ $____
Complete the following table.
(Round to the nearest dollar as needed.)
Year Suzanne's Annual Interest
Suzanne's
Balance
Derek's Annual
Interest Derek's Balance
1 $ $ $ $
2 $ $ $ $
3 $ $ $ $
4 $ $ $ $
5 $ $ $ $
4.
5.
6.
7.
Use the compound interest formula to determine the
accumulated balance after the stated period.
$ invested at an APR of % for years.6000 5 2
If interest is compounded annually, what is the amount of
money after years?2
$
(Do not round until the final answer. Then round to the nearest
cent as needed.)
Use the compound interest formula to compute the balance in
the following account after the stated period of time,
assuming interest is compounded annually.
$ invested at an APR of % for years.7000 4.2 21
The balance in the account after years is $ .21
(Round to the nearest cent as needed.)
You deposit $ into a savings account with an APR of %.
Complete parts (a) through (c) below.3500 1.4
(a) Compute the amount of interest you gain after 1 year.
$ (Round to the nearest dollar as needed.)
(b) To compute the amount of money in the savings account at
the end of 1 year, take the original value and add interest:
. This is equivalent to multiplying $ by what factor?$3500 +
1.4% • $3500 3500
(Round to three decimal places as needed.)
(c) To compute the amount of money in the account after 6
years you would multiply $ by what factor?3500
(Round to three decimal places as needed.)
You deposit $ into a savings account with an APR of %. Use
the table to complete parts (a) through (b) below.350 3.3
A B
1 Year Amount
2 0 $350
3 1 $361.55
4 2 $373.48
5 3 $385.81
6 4 $398.54
(a) What recursive formula would you enter in cell B3 that
could be filled down?
B2= * 0.033
B$2= * 1.033
B2= * 1.033
B$2 ^A3= * 1.033
(b) What closed formula would you enter in cell B3 that could
be filled down?
B$2 ^A$3= * 1.033
B$2= * 0.033
B$2= * 1.033
B$2 ^A3= * 1.033
8.
9.
10.
11.
12.
Describe the basic differences between linear growth and
exponential growth.
Choose the correct answer below.
A. Linear growth occurs when a quantity grows by different, but
proportional amounts, in each unit
of time, and exponential growth occurs when a quantity grows
by random amounts in each unit
of time.
B. Linear growth occurs when a quantity grows by the same
relative amount, that is, by the same
percentage, in each unit of time, and exponential growth occurs
when a quantity grows by the
same absolute amount in each unit of time.
C. Linear growth occurs when a quantity grows by the same
absolute amount in each unit of time,
and exponential growth occurs when a quantity grows by the
same relative amount, that is, by
the same percentage, in each unit of time.
D. Linear growth occurs when a quantity grows by random
amounts in each unit of time, and
exponential growth occurs when a quantity grows by different,
but proportional amounts, in
each unit of time.
The population of a town is increasing by people per year.
State whether this growth is linear or exponential. If the
population is today, what will the population be in years?
639
1800 five
Is the population growth linear or exponential?
exponential
linear
What will the population be in years?five
The price of a computer component is decreasing at a rate of %
per year. State whether this decrease is linear or
exponential. If the component costs $ today, what will it cost in
three years?
10
120
Is the decline in price linear or exponential?
linear
exponential
What will the component cost in three years?
$
(Round to the nearest cent as needed.)
You can not print this question until you complete the required
media.
You can not print this question until you complete the required
media.
1.
2.
Student: Kiare Mays
Date: 06/15/20
Instructor: Valery Shemetov
Course: MTH154 – Quantitative
Reasoning (with MCR4)
Assignment: Section 6.2 Homework
Given the exponential equation , complete parts (a) through (b)
below.y = 250 • e 0.0845 • x
(a) Represent as a decimal to 4 decimal places.e 0.0845
(Round to four decimal places as needed.)
(b) Rewrite the equation in the form .P = P • (1 + r)0
x
P = 250 • (1.0845)x
P = 250 • (1 + 8.82%)x
P = 250 • (0.0882)x
P = 250 • (1 + 8.45%)x
A population can be modeled by the exponential equation ,
where t years since 1990 and
y population. Complete parts (a) through (d) below.
y = 250,000 • e − 0.0757 • t =
=
(a) What is the continuous decay rate per year? (Hint: If the rate
k is a negative number, this implies a continuous decay
rate with the opposite sign of k.)
The population is decreasing at a continuous rate of % per year.
(Round to two decimal places as needed.)
(b) What is the annual decay rate (not continuous)? (Hint: If the
rate r is a negative number, this implies an annual decay
rate with the opposite sign of r.)
The population is decreasing at an annual rate of % per year.
(Round to two decimal places as needed.)
(c) Rewrite the equation in the form .P = P • (1 + r)0
t
A. P = 250,000 • (1 − 7.57%)t
B. P = 250,000 • (0.9243)t
C. P = 250,000 • ( − 0.729)t
D. P = 250,000 • (0.9271)t
(d) How many people will there be after 8 years?
people
(Round to the nearest whole number as needed.)
3. A population can be modeled by the exponential equation ,
where t years since 2010 and
y population. Complete parts (a) through (d) below.
y = 11,000 • e 0.2124 • t =
=
(a) What is the continuous growth rate per year?
% (Round to two decimal places as needed.)
(b) What is the annual growth rate (not continuous)?
% (Round to two decimal places as needed.)
(c) Rewrite the equation in the form .P = P • (1 + r)0
t
A. P = 11,000 • (1.2124)t
B. P = 11,000 • (0.2366)t
C. P = 11,000 • (1 + 21.24%)t
D. P = 11,000 • (1 + 23.66%)t
(d) How many people will there be after 8 years?
people (Round to the nearest whole number as needed.)
4. Consider the following case of exponential growth. Complete
parts a through c below.
The population of a town with an initial population of grows at
a rate of % per year.48,000 7.5
a. Create an exponential function of the form , (where r 0 for
growth and r 0 for decay) to model the
situation described.
Q = Q (1 + r)0 ×
t > <
Q ( )= × t
(Type integers or decimals.)
b. Create a table showing the value of the quantity Q for the
first 10 years of growth.
Year t= Population Year t= Population
0 48,000 6
1 7
2 8
3 9
4 10
5
(Round to the nearest whole number as needed.)
c. Make a graph of the exponential function. Choose the correct
graph below.
A.
0 10
40,000
110,000
Year
Po
pu
la
tio
n
B.
0 10
30,000
100,000
Year
Po
pu
la
tio
n
C.
0 10
40,000
100,000
Year
Po
pu
la
tio
n
D.
0 10
20,000
100,000
Year
Po
pu
la
tio
n
5. Consider the following case of exponential decay. Complete
parts (a) through (c) below.
A privately owned forest that had acres of old growth is being
clear cut at a rate of % per year.5,000,000 2
a. Create an exponential function of the form , (where r 0 for
growth and r 0 for decay) to model the
situation described.
Q = Q (1 + r)0 ×
t > <
Q ( )= × t
(Type integers or decimals.)
b. Create a table showing the value of the quantity Q for the
first 10 years of growth.
Year t= Acres Year t= Acres
0 5,000,000 6
1 7
2 8
3 9
4 10
5
(Round to the nearest whole number as needed.)
c. Make a graph of the exponential function. Choose the correct
graph below.
A.
0 10
4,000,000
5,000,000
Year
Ac
re
s
B.
0 10
0
1,000,000
Year
Ac
re
s
C.
0 10
4,000,000
5,000,000
Year
Ac
re
s
D.
0 10
4,000,000
5,000,000
Year
Ac
re
s
6. Answer the questions for the problem given below.
The average price of a home in a town was $ in 2007 but home
prices are rising by % per year.179,000 3
a. Find an exponential function of the form (where r 0) for
growth to model the situation described.Q = Q (1 + r)0 ×
t >
Q $ (1 )= × + t
(Type an integer or a decimal.)
b. Fill the table showing the value of the average price of a
home for the following five years.
Year t= Average price
0 $179,000
1 $
2 $
3 $
4 $
5 $
(Do not round until the final answer. Then round to the nearest
dollar as needed.)
7. Consider the following case of exponential growth. Complete
parts (a) through (c) below.
Your starting salary at a new job is $ per month, and you get
annual raises of % per year.1700 6
a. Create an exponential function of the form , (where r 0 for
growth and r 0 for decay) to model the
monthly salary situation described.
Q = Q (1 + r)0 ×
t > <
Q ( )= × t
(Type integers or decimals.)
b. Create a table showing the value of the quantity Q for the
first 10 years of growth.
Year t= Salary (per month) Year t= Salary (per month)
0 $1700 6 $
1 $ 7 $
2 $ 8 $
3 $ 9 $
4 $ 10 $
5 $
(Round to two decimal places as needed.)
c. Make a graph of the exponential function. Choose the correct
graph below.
A.
0 10
0
800
1,600
2,400
3,200
4,000
Year
Sa
la
ry
(d
ol
la
rs
) B.
0 10
0
800
1,600
2,400
3,200
4,000
Year
Sa
la
ry
(d
ol
la
rs
)
C.
0 10
0
800
1,600
2,400
3,200
4,000
Year
Sa
la
ry
(d
ol
la
rs
) D.
0 10
0
800
1,600
2,400
3,200
4,000
Year
Sa
la
ry
(d
ol
la
rs
)
8.
9.
Air pressure can be modeled by the exponential equation ,
where x altitude in 1000's of feet and
y air pressure in psi. Complete parts (a) through (e) below.
y = 14.1 • e − 0.0423 • x =
=
(a) What is the continuous decay rate per 1000 feet? (Hint: If
the rate k is a negative number, this implies a continuous
decay rate with the opposite sign of k.)
The air pressure is decreasing at a continuous rate of % per
1000 feet.
(Round to two decimal places as needed.)
(b) What is the decay rate every 1000 feet (not continuous)?
(Hint: If the rate r is a negative number, this implies an annual
decay rate with the opposite sign of r.)
The air pressure is decreasing at a rate of % per 1000 feet.
(Round to two decimal places as needed.)
(c) Rewrite the equation in the form .P = P • (1 + r)0
x
A. P = 14.1 • (0.9586)x
B. P = 14.1 • (1.0414)x
C. P = 14.1 • (1 − 4.23%)x
D. P = 14.1 • (0.9577)x
(d) What is the air pressure at 35,000 feet?
psi (Round to two decimal places as needed.)
(e) What is the air pressure at sea level?
psi (Round to one decimal place as needed.)
You can not print this question until you complete the required
media.
1.
2.
Student: Kiare Mays
Date: 06/15/20
Instructor: Valery Shemetov
Course: MTH154 – Quantitative
Reasoning (with MCR4)
Assignment: Section 6.3 Homework
Your mutual fund goes up % in the first year, then down % in
the 2nd year, and finally up again % in the 3rd year.
Complete parts a and b.
12.3 2.1 5.6
a) What is the average rate of return per year?
% (Do not round until the final answer. Then round to two
decimal places as needed.)
b) If the fund plummets % in the 4th year, what is the average
rate of return per year for the 4 years?31
% (Do not round until the final answer. Then round to two
decimal places as needed.)
You average mph for the first miles of a trip and then mph for
the next miles. Complete parts a and b.44 20 55 20
a) What is the average speed over the miles?40
mph (Type an integer or a decimal rounded to one decimal
place.)
b) If you then average mph over the next miles what is the
average speed over the miles?75 20 60
mph (Type an integer or a decimal rounded to one decimal
place.)
3.
4.
5.
1: Types of means.
(1) arithmetic
geometric
harmonic
(2) arithmetic
geometric
harmonic
Determine whether to use the arithmetic mean, the geometric
mean, or the harmonic mean to complete parts a and b.
Click the icon to view the three types of means.1
a) You mix equal weights of ( kg/ ), ( kg/ ), and ( kg/ )
together. What is
the density of the resulting alloy? (Hint: Density is the rate of
weight to volume, kg/ .)
Gold 19,320 m3 Europium 5243 m3 Aluminum 2712 m3
m3
To find the density of the resulting alloy, the (1) mean should
be used and the density is
kg/ .m3
(Type an integer or a decimal rounded to one decimal place.)
b) If your veggie hot dog stand generates revenues of $ , $ ,
and $ at 3 events, what is your average
revenue per event?
19,320 5243 2712
To find the average revenue per event, the (2) mean should be
used and the average revenue is
$ .
(Round to the nearest cent as needed.)
The arithmetic mean, , is an average of n numbers.
a1 + a2 +⋯ + an
n
The geometric mean, , is the average of change in growth where
the rate of growth and/or decay
changes over time.
n
a1 • a2 •⋯ • an
The harmonic mean, , is the average of rates, as in travelling n
miles at one rate and n miles at
another rate.
n
1
a1
+
1
a2
+⋯ +
1
an
Suppose the rate of return for a particular stock during the past
two years was % and %. Compute the geometric mean
rate of return. (Note: A rate of return of % is recorded as , and a
rate of return of % is recorded as .)
5 35
5 0.05 35 0.35
The geometric mean rate of return is %.
(Round to one decimal place as needed.)
Suppose the rate of return for a particular stock during the past
two years was % and . Compute the geometric
mean rate of return.
10 − 40%
The geometric mean rate of return is %.
(Round to one decimal place as needed.)
6.
7.
(1) more
less
A company's stock price rose % in 2011, and in 2012, it
increased %.1.7 17.1
a. Compute the geometric mean rate of return for the two-year
period 2011 2012. (Hint: Denote an increase of % by
.)
− 17.1
0.171
b. If someone purchased $1,000 of the company's stock at the
start of 2011, what was its value at the end of 2012?
c. Over the same period, another company had a geometric mean
rate of return of %. If someone purchased $1,000
of the other company's stock, how would its value compare to
the value found in part (b)?
32.11
a. The geometric mean rate of return for the two-year period
2011 2012 was %.−
(Type an integer or decimal rounded to two decimal places as
needed.)
b. If someone purchased $1,000 of the company's stock at the
start of 2011, its value at the end of 2012 was
$ .
(Round to the nearest cent as needed.)
c. If someone purchased $1,000 of the other company's stock at
the start of 2011, its value at the end of 2012 was
$ , which is (1) than the value from part (b).
(Round to the nearest cent as needed.)
(1) more
less
A company's stock price rose % in 2011, and in 2012, it
increased %.3.9 75.8
a. Compute the geometric mean rate of return for the two-year
period 2011 2012. (Hint: Denote an increase of % by
.)
− 75.8
0.758
b. If someone purchased $1,000 of the company's stock at the
start of 2011, what was its value at the end of 2012?
c. Over the same period, another company had a geometric mean
rate of return of %. If someone purchased $1,000 of
the other company's stock, how would its value compare to the
value found in part (b)?
10.3
a. The geometric mean rate of return for the two-year period
2011 2012 was %.−
(Type an integer or decimal rounded to two decimal places as
needed.)
b. If someone purchased $1,000 of the company's stock at the
start of 2011, its value at the end of 2012 was
$ .
(Round to the nearest cent as needed.)
c. If someone purchased $1,000 of the other company's stock at
the start of 2011, its value at the end of 2012 was
$ , which is (1) than the value from part (b).
(Round to the nearest cent as needed.)
8.
2: Data table for total rate of return
3: Geometric mean rate of return for stock market indices
The data in the accompanying table represent the total rates of
return (in percentages) for three stock exchanges over the
four-year period from 2009 to 2012. Calculate the geometric
mean rate of return for each of the three stock exchanges.
Click the icon to view data table for total rate of return for
stock market indices.2
Click the icon to view data table for total rate of return for
platinum, gold, and silver.3
a. Compute the geometric mean rate of return per year for the
stock indices from 2009 through 2012.
For stock exchange A, the geometric mean rate of return for the
four-year period 2009-2012 was %.
(Type an integer or decimal rounded to two decimal places as
needed.)
For stock exchange B, the geometric mean rate of return for the
four-year period 2009-2012 was %.
(Type an integer or decimal rounded to two decimal places as
needed.)
For stock exchange C, the geometric mean rate of return for the
four-year period 2009-2012 was %.
(Type an integer or decimal rounded to two decimal places as
needed.)
b. What conclusions can you reach concerning the geometric
mean rates of return per year of the three market indices?
A. Stock exchange B had a higher return than exchange C and a
much higher return than
exchange A.
B. Stock exchange C had a much higher return than exchanges
A or B.
C. Stock exchange A had a much higher return than exchanges
B or C.
D. Stock exchange A had a higher return than exchange C and a
much higher return than
exchange B.
c. Compare the results of (b) to those of the results of the
precious metals. Choose the correct answer below.
A. All three stock indices had lower returns than any of the
precious metals.
B. Silver had a much higher return than any of the three stock
indices. Both gold and platinum had
a worse return than stock index C, but a better return than
indices A and B.
C. Silver had a worse return than stock index C, but a better
return than indices A and B. Gold had
a better return than index B, but a worse return than indices A
and C. Platinum had a worse
return than all three stock indices.
D. All three stock indices had higher returns than any of the
precious metals.
Year A B C
2012 8.61 12.77 15.85
2011 4.57 0.00 − 2.25
2010 11.00 11.54 16.18
2009 18.99 23.35 43.15
Metal Geometric mean rate of return
Platinum %14.85
Gold %16.54
Silver %20.96
9.
4: Data table for total rate of return
5: Geometric mean rate of return for stock market indices
In 2009 2012, the value of precious metals changed rapidly. The
data in the accompanying table represents the total rate of
return (in percentage) for platinum, gold, and silver from 2009
–
through 2012. Complete parts (a) through (c) below.
Click the icon to view data table for total rate of return for
platinum, gold, and silver.4
Click the icon to view the geometric mean rate of return for
stock market indices.5
a. Compute the geometric mean rate of return per year for
platinum, gold, and silver from 2009 through 2012.
The geometric mean rate of return for platinum during this time
period was %.
(Type an integer or decimal rounded to two decimal places as
needed.)
The geometric mean rate of return for gold during this time
period was %.
(Type an integer or decimal rounded to two decimal places as
needed.)
The geometric mean rate of return for silver during this time
period was %.
(Type an integer or decimal rounded to two decimal places as
needed.)
b. What conclusions can you reach concerning the geometric
mean rates of return of the three precious metals?
A. Platinum had a higher return than silver and a much higher
return than gold.
B. Platinum had a much higher return than silver and gold.
C. Silver had a much higher return than gold and platinum.
D. Gold had a higher return than silver and a much higher return
than platinum.
c. Compare the results of (b) to those of the results of the stock
indices. Choose the correct answer below.
A. Silver had a much higher return than any of the three stock
indices. Both gold and platinum had
a worse return than stock index C, but a better return than
indices A and B.
B. All three metals had lower returns than any of the stock
indices.
C. Silver had a worse return than stock index C, but a better
return than indices A and B. Gold had
a better return than index B, but a worse return than indices A
and C. Platinum had a worse
return than all three stock indices.
D. All three metals had higher returns than any of the stock
indices.
Year Platinum Gold Silver
2012 5.8 0.2 56.6
2011 − 23.9 9.6 − 9.1
2010 23.3 30.6 14.8
2009 55.1 23.5 46.3
Stock indices Geometric mean rate of return
A %9.96
B %11.28
C %22.49
10.
11.
12.
13.
The half-life of a certain element is days, meaning every days
the amount is cut in half. Complete parts (a)
through (d) below.
15.5 15.5
(a) Fill in the following table.
Days Grams
0 40
15.5
31.0
46.5
(Round to two decimal places as needed.)
(b) What is the average percent change per day over the first
days?15.5
% (Round to two decimal places as needed.)
(c) Write down an equation for the amount of the element left
after d days in the form: A = A • (1 + r)0
d
A = 40 • (1 − 4.37%)d
A = 40 • (1 + 4.37%)d
A = 40 • (0.0437)d
A = 40 • (1.0437)d
(d) How much is left after 3 days?
grams (Round to one decimal place as needed.)
The average cost of gas dropped from a high of $ per gallon on
June 1, 2015 to a low of $ on February 1, 2016.
Complete parts (a) through (c) below.
2.81 1.65
(a) What is the average percent change in gas price per month?
% (Round to one decimal place as needed.)
(b) What is the decay factor associated to this rate?
(Round to three decimal places as needed.)
(c) Write down an equation for the price of gas m months after
June 1, 2015 in the form: P = P • (1 + r)0
m
A. P = 2.81 • (1 − 0.936)m
B. P = 2.81 • (1.064)m
C. P = 2.81 • (0.064)m
D. P = 2.81 • (0.936)m
You can not print this question until you complete the required
media.
You can not print this question until you complete the required
media.
1.
2.
3.
4.
Student: Kiare Mays
Date: 06/15/20
Instructor: Valery Shemetov
Course: MTH154 – Quantitative
Reasoning (with MCR4)
Assignment: Section 7.1 Homework
A certain town's population is growing according to the
following equation. Answer parts (a) through (c).
P = 7,800 • (1.068)t
(a) To find how long it will take for the population, P, to ,
substitute for P.triple
(Type an integer or a decimal.)
(b) We are looking at the time, t, which solves the equation: .
Fill in the following table.3 = (1.068)t
t 1.068 t
14
15
16
17
18
19
(Type integers or decimals rounded to four decimal places as
needed.)
(c) The time it takes to is closest to what integer value of t in
the table above?triple
The time it takes to is closest to t .triple =
Solve for x.
3x = 27
The solution is x .=
(Simplify your answer. Type an integer or a fraction. Use a
comma to separate answers as needed.)
Solve for x.
log x = 610
x =
Solve for x.
log x = 4.610
x =
(Round to two decimal places as needed.)
5. Evaluate logarithms without using a calculator by rewriting
them in exponential form. Answer parts (a) through (d).
(a) Rewrite y as an exponential. Select the correct choice below
and fill in the answer box within your choice.log 497 =
A. 49 = 7
B. 749 =
C. 7 = 49
(b) Solve the equation y.log 497 =
log 497 =
(Type an integer or a decimal rounded to two decimal places as
needed.)
(c) Rewrite y as an exponential. Select the correct choice below
and fill in the answer box within your choice.log 17 =
A. 1 = 7
B. 7 = 1
C. 71 =
(d) Solve the equation y.log 17 =
log 17 =
(Type an integer or a decimal rounded to two decimal places as
needed.)
6. Evaluate logarithms without using a calculator by rewriting
them in exponential form. Answer parts (a) through (d).
(a) Rewrite y as an exponential. Select the correct choice below
and fill in the answer box within your choice.ln e − 6 =
A. − 6e =
B. 2 = e − 6
C. e = e − 6
(b) Solve the equation y.ln e − 6 =
ln e − 6 =
(Type an integer or a decimal.)
(c) Rewrite y as an exponential. Select the correct choice below
and fill in the answer box within your choice.ln e 19 =
A. 2 = e 19
B. 19e =
C.
e = e 19
(d) Solve the equation y.ln e 19 =
ln e 19 =
(Type an integer or a decimal.)
7. Evaluate logarithms without using a calculator by rewriting
them in exponential form. Answer parts (a) through (d).
(a) Rewrite y as an exponential. Select the correct choice below
and fill in the answer box within your choice.log 0.0001 =
A. 103 =
B. 10 = 0.0001
C. 0.0001 = 10
(b) Solve the equation y.log 0.0001 =
log 0.0001 =
(Type an integer or a decimal.)
(c) Rewrite y as an exponential. Select the correct choice below
and fill in the answer box within your
choice.
log 1,000,000 =
A. 10 = 1,000,000
B. 1,000,000 = 10
C. 101,000,000 =
(d) Solve the equation y.log 1,000,000 =
log 1,000,000 =
(Type an integer or a decimal.)
8.
9.
Evaluate logarithms using properties of logarithms. Answer
parts (a) through (f).
(a) Rewrite the following as a power of 10.
10 • 103 5 = 10
(Simplify your answer.)
(b) Solve the equation y.log 103 • 105 =
log 103 • 105 =
(Simplify your answer.)
(c) Rewrite the following as a power of 10.
10 ÷ 103 5 = 10
(Simplify your answer.)
(d) Solve the equation y.log 103 ÷ 105 =
log 103 ÷ 105 =
(Simplify your answer.)
(e) Rewrite the following as a power of 10.
103
5
= 10
(Simplify your answer.)
(f) Solve the equation y.log 103 5 =
log 103 5 =
(Simplify your answer.)
Using the approximation , find each of the following without a
calculator.log 610 ≈ 0.778
a. b. c. d. log 1036 log 10600 log 10
1
36 log 100.6
a. log 1036 =
(Simplify your answer. Type an integer or decimal rounded to
three decimal places as needed.)
b. log 10600 =
(Simplify your answer. Type an integer or decimal rounded to
three decimal places as needed.)
c. log 10
1
36 =
(Simplify your answer. Type an integer or decimal rounded to
three decimal places as needed.)
d. log 100.6 =
(Simplify your answer. Type an integer or decimal rounded to
three decimal places as needed.)
10. Evaluate the following expressions.
a. 10 104 × 7 b. 10 109 × − 5 c.
109
103
d.
104
10 − 2
a. (Simplify your answer. Type your answer using exponential
notation.)10 104 × 7 =
b. (Simplify your answer. Type your answer using exponential
notation.)10 109 × − 5 =
c. (Simplify your answer. Type your answer using exponential
notation.)
109
103
=
d. (Simplify your answer. Type your answer using exponential
notation.)
104
10 − 2
=
1.
Student: Kiare Mays
Date: 06/15/20
Instructor: Valery Shemetov
Course: MTH154 – Quantitative
Reasoning (with MCR4)
Assignment: Section 5.1 Homework
The distance you drive is proportional to the amount of gas
used. Driving miles uses gallons of gas. Complete parts
(a) through (c).
112 4
(a) Fill in the following table.
( )Gas gal ( )Distance mi
0
4
8
12
(Type integers or decimals.)
(b) Represent the relationship between distance driven, D, and
gas used, G, with an equation.
D G= •
(Type an integer or a decimal.)
(c) What is the graph of the equation that represents the
relationship between driven, D, and gas used, G?
A.
100 20
200
0
400
Gas (gal)
D
is
ta
nc
e
(m
i)
B.
100 20
200
0
400
Gas (gal)
D
is
ta
nc
e
(m
i)
C.
100 20
200
0
400
Gas (gal)
D
is
ta
nc
e
(m
i)
D.
100 20
200
0
400
Gas (gal)
D
is
ta
nc
e
(m
i)
2. The cost of an airline ticket is proportional to the distance
traveled at a rate of $ per miles flown. Complete parts (a)
through (c).
36 100
(a) Fill in the following table.
( )Distance mi ( )Cost $
0
50
100
150
(Type integers or decimals. Do not include the $ symbol in your
answers.)
(b) Represent the relationship between cost, C, and distance
flown, D, with an equation.
C D= •
(Type an integer or a decimal. Do not include the $ symbol in
your answer.)
(c) What is the graph of the equation that represents the
relationship between cost, C, and distance flown, D?
A.
750 150
30
0
60
Distance (mi)
C
os
t (
$)
B.
750 150
30
0
60
Distance (mi)
C
os
t (
$)
C.
750 150
30
0
60
Distance (mi)
C
os
t (
$)
D.
750 150
30
0
60
Distance (mi)
C
os
t (
$)
3.
4.
Your monthly electric bill is proportional to the number of
kilowatt-hours (kwh) of energy used at a rate of cents per kwh.
Complete parts (a) through (c).
4.3
(a) Fill in the following table.
( )Energy kwh ( )Cost $
0
600
1,200
1,800
(Type integers or decimals rounded to the nearest hundredth as
needed. Do not include the $ symbol in your answers.)
(b) Represent the relationship between cost ($), C, and energy
used (kwh), E, with an equation.
C E= •
(Type an integer or a decimal. Do not include the $ symbol in
your answer.)
(c) What is the graph of the equation that represents the
relationship between cost ($), C, and energy used (kwh), E?
A.
10000 2000
50
0
100
Energy (kwh)
C
os
t (
$)
B.
10000 2000
50
0
100
Energy (kwh)
C
os
t (
$)
C.
10000 2000
50
0
100
Energy (kwh)
C
os
t (
$)
D.
10000 2000
50
0
100
Energy (kwh)
C
os
t (
$)
Plot the ordered pair ( , ) on the rectangular coordinate
plane.
2 8
Plot ( , ).2 8
-10 -8 -6 -4 -2 2 4 6 8 10
-10
-8
-6
-4
-2
2
4
6
8
10
x
y
5.
6.
Plot the point in the rectangular coordinate system.( − 8, − 2)
Plot .( − 8, − 2)
-10 -8 -6 -4 -2 2 4 6 8 10
-10
-8
-6
-4
-2
2
4
6
8
10
The distance you drive is proportional to the amount of gas
used. Driving miles uses gallons of gas. Assume you
have already driven miles. Complete parts (a) through (c).
144 4
100
(a) Fill in the following table for total distance driven.
( )Gas gal ( )Distance mi
0
4
8
12
(Type integers or decimals.)
(b) Represent the relationship between distance driven, D, and
gas used, G, with an equation.
D G= • +
(Type integers or decimals.)
(c) What is the graph of the equation that represents the
relationship between distance driven, D, and gas used, G?
A.
100 20
300
0
600
Gas (gal)
D
is
ta
nc
e
(m
i)
B.
100 20
300
0
600
Gas (gal)
D
is
ta
nc
e
(m
i)
C.
100 20
300
0
600
Gas (gal)
D
is
ta
nc
e
(m
i)
D.
100 20
300
0
600
Gas (gal)
D
is
ta
nc
e
(m
i)
7. The cost of an airline ticket is proportional to the distance
traveled at a rate of $ per miles flown. Assume that there is
a base charge of $ . Complete parts (a) through (c).
42 150
25
(a) Fill in the following table for total cost.
( )Distance mi ( )Cost $
0
150
300
450
(Type integers or decimals. Do not include the $ symbol in your
answers.)
(b) Represent the relationship between cost, C, and distance
flown, D, with an equation.
C D= • +
(Type integers or decimals. Do not include the $ symbol in your
answers.)
(c) What is the graph of the equation that represents the
relationship between cost, C, and distance flown, D?
A.
2250 450
80
0
160
Distance (mi)
C
os
t (
$)
B.
2250 450
80
0
160
Distance (mi)
C
os
t (
$)
C.
2250 450
80
0
160
Distance (mi)
C
os
t (
$)
D.
2250 450
80
0
160
Distance (mi)
C
os
t (
$)
8.
9.
10.
Your monthly electric bill is proportional to the number of
kilowatt-hours (kwh) of energy used at a rate of cents per kwh.
There is a monthly base charge of $ . Complete parts (a)
through (c).
4.5
17.50
(a) Fill in the following table for total monthly cost.
( )Energy kwh ( )Cost $
0
600
1200
1800
(Type integers or decimals. Do not include the $ symbol in your
answers.)
(b) Represent the relationship between cost ($), C, and energy
used (kwh), E, with an equation.
C E= • +
(Type integers or decimals. Do not include the $ symbol in your
answers.)
(c) What is the graph of the equation that represents the
relationship between cost ($), C, and energy used (kwh), E?
A.
10000 2000
50
0
100
Energy (kwh)
C
os
t (
$)
B.
10000 2000
50
0
100
Energy (kwh)
C
os
t (
$)
C.
10000 2000
50
0
100
Energy (kwh)
C
os
t (
$)
D.
10000 2000
50
0
100
Energy (kwh)
C
os
t (
$)
Determine which ordered pairs satisfy the given equation.
x + 5y = 19 ( )4,3 ( )− 1,4 ( )0, − 3
Select all ordered pairs that satisfy the given equation.
A. ( )0, − 3
B. ( )4,3
C. ( )− 1,4
D. None of the ordered pairs satisfy the equation.
Determine which ordered pairs satisfy the given equation.
5x − 4y = 9
9
5 ,0 ( )5,4 ( )0, − 4
Select all ordered pairs that satisfy the given equation.
A.
9
5 ,0
B. ( )5,4
C. ( )0, − 4
D. None of the ordered pairs satisfy the equation.

More Related Content

Similar to 1.Student Kiare MaysDate 061520Instructor Valer.docx

QEP Post Math Part 2 — Answers Questions 1-15 on a separate 10.docx
QEP Post Math Part 2 — Answers Questions 1-15 on a separate 10.docxQEP Post Math Part 2 — Answers Questions 1-15 on a separate 10.docx
QEP Post Math Part 2 — Answers Questions 1-15 on a separate 10.docxamrit47
 
{NAME}{DATE}IDS 210HM – Culture Through Literature The Story .docx
{NAME}{DATE}IDS 210HM – Culture Through Literature The Story .docx{NAME}{DATE}IDS 210HM – Culture Through Literature The Story .docx
{NAME}{DATE}IDS 210HM – Culture Through Literature The Story .docxgerardkortney
 
CXC MATHEMATICS MULTIPLE CHOICE
CXC MATHEMATICS MULTIPLE CHOICECXC MATHEMATICS MULTIPLE CHOICE
CXC MATHEMATICS MULTIPLE CHOICEMadanaDookieram
 
Common Final Exam ECON 201 OL2 Spring 2014 I. MULTIP.docx
Common Final Exam ECON 201 OL2 Spring 2014   I. MULTIP.docxCommon Final Exam ECON 201 OL2 Spring 2014   I. MULTIP.docx
Common Final Exam ECON 201 OL2 Spring 2014 I. MULTIP.docxmonicafrancis71118
 
1. (Points 5)   The GDP is the value of all final goods and.docx
1. (Points 5)   The GDP is the value of all final goods and.docx1. (Points 5)   The GDP is the value of all final goods and.docx
1. (Points 5)   The GDP is the value of all final goods and.docxdorishigh
 
ma hyderabad economics 2014
ma hyderabad economics 2014 ma hyderabad economics 2014
ma hyderabad economics 2014 Naresh Sehdev
 
Microeconomics Tutorials #4 continue
Microeconomics Tutorials #4 continueMicroeconomics Tutorials #4 continue
Microeconomics Tutorials #4 continueNermeen Abdullah
 
Demand and supply questions
Demand and supply questionsDemand and supply questions
Demand and supply questionsnurulzai
 
nid coaching classes in hyderabad,Sample Paper for NIFT PG Management Gat
nid coaching classes in hyderabad,Sample Paper for NIFT PG Management Gatnid coaching classes in hyderabad,Sample Paper for NIFT PG Management Gat
nid coaching classes in hyderabad,Sample Paper for NIFT PG Management GatTakshshila
 
In January 2013, Mitzu Co. pays $2,650,000 for a tract of land wit.docx
In January 2013, Mitzu Co. pays $2,650,000 for a tract of land wit.docxIn January 2013, Mitzu Co. pays $2,650,000 for a tract of land wit.docx
In January 2013, Mitzu Co. pays $2,650,000 for a tract of land wit.docxbradburgess22840
 
5. quantitative methods in business 2007 guwahati university
5. quantitative methods in business 2007 guwahati university5. quantitative methods in business 2007 guwahati university
5. quantitative methods in business 2007 guwahati universityKumar Nirmal Prasad
 
Part 1 Multiple choice questionsQuestions 1-10 are worth 3 p.docx
Part 1 Multiple choice questionsQuestions 1-10 are worth 3 p.docxPart 1 Multiple choice questionsQuestions 1-10 are worth 3 p.docx
Part 1 Multiple choice questionsQuestions 1-10 are worth 3 p.docxherbertwilson5999
 
M.a economics - 2021 complete questions sourav sir's classes 8583070415
M.a   economics - 2021 complete questions sourav sir's classes 8583070415M.a   economics - 2021 complete questions sourav sir's classes 8583070415
M.a economics - 2021 complete questions sourav sir's classes 8583070415SOURAV DAS
 
ECON 301 Intermediate MacroSpring 2019 Problem Set #1Du.docx
ECON 301 Intermediate MacroSpring 2019 Problem Set #1Du.docxECON 301 Intermediate MacroSpring 2019 Problem Set #1Du.docx
ECON 301 Intermediate MacroSpring 2019 Problem Set #1Du.docxtidwellveronique
 
Short Answer Type your answer below each question. Show your work.docx
Short Answer Type your answer below each question. Show your work.docxShort Answer Type your answer below each question. Show your work.docx
Short Answer Type your answer below each question. Show your work.docxbjohn46
 
Continuing Cookie Chronicle 1Continuing Cookie Chronicle(Not.docx
Continuing Cookie Chronicle 1Continuing Cookie Chronicle(Not.docxContinuing Cookie Chronicle 1Continuing Cookie Chronicle(Not.docx
Continuing Cookie Chronicle 1Continuing Cookie Chronicle(Not.docxmaxinesmith73660
 
Homework 51)a) the IS curve ln Yt= ln Y(t+1) – (1Ɵ)rtso th.docx
Homework 51)a) the IS curve ln Yt= ln Y(t+1) – (1Ɵ)rtso th.docxHomework 51)a) the IS curve ln Yt= ln Y(t+1) – (1Ɵ)rtso th.docx
Homework 51)a) the IS curve ln Yt= ln Y(t+1) – (1Ɵ)rtso th.docxadampcarr67227
 
BC-301-PI-Past-Papers.pdf for sample new students
BC-301-PI-Past-Papers.pdf for sample  new studentsBC-301-PI-Past-Papers.pdf for sample  new students
BC-301-PI-Past-Papers.pdf for sample new studentsbuddagujjar131
 
8 bcd math summer packet (hadzovic &amp; shammas)
8 bcd math summer packet (hadzovic &amp; shammas)8 bcd math summer packet (hadzovic &amp; shammas)
8 bcd math summer packet (hadzovic &amp; shammas)Frances O'Neill
 
Assignment_01_F2015 stats
Assignment_01_F2015 statsAssignment_01_F2015 stats
Assignment_01_F2015 statsYogi Sarumaha
 

Similar to 1.Student Kiare MaysDate 061520Instructor Valer.docx (20)

QEP Post Math Part 2 — Answers Questions 1-15 on a separate 10.docx
QEP Post Math Part 2 — Answers Questions 1-15 on a separate 10.docxQEP Post Math Part 2 — Answers Questions 1-15 on a separate 10.docx
QEP Post Math Part 2 — Answers Questions 1-15 on a separate 10.docx
 
{NAME}{DATE}IDS 210HM – Culture Through Literature The Story .docx
{NAME}{DATE}IDS 210HM – Culture Through Literature The Story .docx{NAME}{DATE}IDS 210HM – Culture Through Literature The Story .docx
{NAME}{DATE}IDS 210HM – Culture Through Literature The Story .docx
 
CXC MATHEMATICS MULTIPLE CHOICE
CXC MATHEMATICS MULTIPLE CHOICECXC MATHEMATICS MULTIPLE CHOICE
CXC MATHEMATICS MULTIPLE CHOICE
 
Common Final Exam ECON 201 OL2 Spring 2014 I. MULTIP.docx
Common Final Exam ECON 201 OL2 Spring 2014   I. MULTIP.docxCommon Final Exam ECON 201 OL2 Spring 2014   I. MULTIP.docx
Common Final Exam ECON 201 OL2 Spring 2014 I. MULTIP.docx
 
1. (Points 5)   The GDP is the value of all final goods and.docx
1. (Points 5)   The GDP is the value of all final goods and.docx1. (Points 5)   The GDP is the value of all final goods and.docx
1. (Points 5)   The GDP is the value of all final goods and.docx
 
ma hyderabad economics 2014
ma hyderabad economics 2014 ma hyderabad economics 2014
ma hyderabad economics 2014
 
Microeconomics Tutorials #4 continue
Microeconomics Tutorials #4 continueMicroeconomics Tutorials #4 continue
Microeconomics Tutorials #4 continue
 
Demand and supply questions
Demand and supply questionsDemand and supply questions
Demand and supply questions
 
nid coaching classes in hyderabad,Sample Paper for NIFT PG Management Gat
nid coaching classes in hyderabad,Sample Paper for NIFT PG Management Gatnid coaching classes in hyderabad,Sample Paper for NIFT PG Management Gat
nid coaching classes in hyderabad,Sample Paper for NIFT PG Management Gat
 
In January 2013, Mitzu Co. pays $2,650,000 for a tract of land wit.docx
In January 2013, Mitzu Co. pays $2,650,000 for a tract of land wit.docxIn January 2013, Mitzu Co. pays $2,650,000 for a tract of land wit.docx
In January 2013, Mitzu Co. pays $2,650,000 for a tract of land wit.docx
 
5. quantitative methods in business 2007 guwahati university
5. quantitative methods in business 2007 guwahati university5. quantitative methods in business 2007 guwahati university
5. quantitative methods in business 2007 guwahati university
 
Part 1 Multiple choice questionsQuestions 1-10 are worth 3 p.docx
Part 1 Multiple choice questionsQuestions 1-10 are worth 3 p.docxPart 1 Multiple choice questionsQuestions 1-10 are worth 3 p.docx
Part 1 Multiple choice questionsQuestions 1-10 are worth 3 p.docx
 
M.a economics - 2021 complete questions sourav sir's classes 8583070415
M.a   economics - 2021 complete questions sourav sir's classes 8583070415M.a   economics - 2021 complete questions sourav sir's classes 8583070415
M.a economics - 2021 complete questions sourav sir's classes 8583070415
 
ECON 301 Intermediate MacroSpring 2019 Problem Set #1Du.docx
ECON 301 Intermediate MacroSpring 2019 Problem Set #1Du.docxECON 301 Intermediate MacroSpring 2019 Problem Set #1Du.docx
ECON 301 Intermediate MacroSpring 2019 Problem Set #1Du.docx
 
Short Answer Type your answer below each question. Show your work.docx
Short Answer Type your answer below each question. Show your work.docxShort Answer Type your answer below each question. Show your work.docx
Short Answer Type your answer below each question. Show your work.docx
 
Continuing Cookie Chronicle 1Continuing Cookie Chronicle(Not.docx
Continuing Cookie Chronicle 1Continuing Cookie Chronicle(Not.docxContinuing Cookie Chronicle 1Continuing Cookie Chronicle(Not.docx
Continuing Cookie Chronicle 1Continuing Cookie Chronicle(Not.docx
 
Homework 51)a) the IS curve ln Yt= ln Y(t+1) – (1Ɵ)rtso th.docx
Homework 51)a) the IS curve ln Yt= ln Y(t+1) – (1Ɵ)rtso th.docxHomework 51)a) the IS curve ln Yt= ln Y(t+1) – (1Ɵ)rtso th.docx
Homework 51)a) the IS curve ln Yt= ln Y(t+1) – (1Ɵ)rtso th.docx
 
BC-301-PI-Past-Papers.pdf for sample new students
BC-301-PI-Past-Papers.pdf for sample  new studentsBC-301-PI-Past-Papers.pdf for sample  new students
BC-301-PI-Past-Papers.pdf for sample new students
 
8 bcd math summer packet (hadzovic &amp; shammas)
8 bcd math summer packet (hadzovic &amp; shammas)8 bcd math summer packet (hadzovic &amp; shammas)
8 bcd math summer packet (hadzovic &amp; shammas)
 
Assignment_01_F2015 stats
Assignment_01_F2015 statsAssignment_01_F2015 stats
Assignment_01_F2015 stats
 

More from croysierkathey

1.  Discuss the organization and the family role in every one of the.docx
1.  Discuss the organization and the family role in every one of the.docx1.  Discuss the organization and the family role in every one of the.docx
1.  Discuss the organization and the family role in every one of the.docxcroysierkathey
 
1.  Compare and contrast DEmilios Capitalism and Gay Identity .docx
1.  Compare and contrast DEmilios Capitalism and Gay Identity .docx1.  Compare and contrast DEmilios Capitalism and Gay Identity .docx
1.  Compare and contrast DEmilios Capitalism and Gay Identity .docxcroysierkathey
 
1.Purpose the purpose of this essay is to spread awareness .docx
1.Purpose the purpose of this essay is to spread awareness .docx1.Purpose the purpose of this essay is to spread awareness .docx
1.Purpose the purpose of this essay is to spread awareness .docxcroysierkathey
 
1.  Tell us why it is your favorite film.2.  Talk about the .docx
1.  Tell us why it is your favorite film.2.  Talk about the .docx1.  Tell us why it is your favorite film.2.  Talk about the .docx
1.  Tell us why it is your favorite film.2.  Talk about the .docxcroysierkathey
 
1.What are the main issues facing Fargo and Town Manager Susan.docx
1.What are the main issues facing Fargo and Town Manager Susan.docx1.What are the main issues facing Fargo and Town Manager Susan.docx
1.What are the main issues facing Fargo and Town Manager Susan.docxcroysierkathey
 
1.Writing Practice in Reading a PhotographAttached Files.docx
1.Writing Practice in Reading a PhotographAttached Files.docx1.Writing Practice in Reading a PhotographAttached Files.docx
1.Writing Practice in Reading a PhotographAttached Files.docxcroysierkathey
 
1.Some say that analytics in general dehumanize managerial activitie.docx
1.Some say that analytics in general dehumanize managerial activitie.docx1.Some say that analytics in general dehumanize managerial activitie.docx
1.Some say that analytics in general dehumanize managerial activitie.docxcroysierkathey
 
1.What is the psychological term for the symptoms James experiences .docx
1.What is the psychological term for the symptoms James experiences .docx1.What is the psychological term for the symptoms James experiences .docx
1.What is the psychological term for the symptoms James experiences .docxcroysierkathey
 
1.Write at least 500 words discussing the benefits of using R with H.docx
1.Write at least 500 words discussing the benefits of using R with H.docx1.Write at least 500 words discussing the benefits of using R with H.docx
1.Write at least 500 words discussing the benefits of using R with H.docxcroysierkathey
 
1.What is Starbucks’ ROA for 2012, 2011, and 2010 Why might focusin.docx
1.What is Starbucks’ ROA for 2012, 2011, and 2010 Why might focusin.docx1.What is Starbucks’ ROA for 2012, 2011, and 2010 Why might focusin.docx
1.What is Starbucks’ ROA for 2012, 2011, and 2010 Why might focusin.docxcroysierkathey
 
1.  Discuss the cultural development of the Japanese and the Jewis.docx
1.  Discuss the cultural development of the Japanese and the Jewis.docx1.  Discuss the cultural development of the Japanese and the Jewis.docx
1.  Discuss the cultural development of the Japanese and the Jewis.docxcroysierkathey
 
1.  Discuss at least 2  contextual factors(family, peers,  school,.docx
1.  Discuss at least 2  contextual factors(family, peers,  school,.docx1.  Discuss at least 2  contextual factors(family, peers,  school,.docx
1.  Discuss at least 2  contextual factors(family, peers,  school,.docxcroysierkathey
 
1.Write at least 500 words in APA format discussing how to use senti.docx
1.Write at least 500 words in APA format discussing how to use senti.docx1.Write at least 500 words in APA format discussing how to use senti.docx
1.Write at least 500 words in APA format discussing how to use senti.docxcroysierkathey
 
1.The following clause was added to the Food and Drug Actthe S.docx
1.The following clause was added to the Food and Drug Actthe S.docx1.The following clause was added to the Food and Drug Actthe S.docx
1.The following clause was added to the Food and Drug Actthe S.docxcroysierkathey
 
1.What are social determinants of health  Explain how social determ.docx
1.What are social determinants of health  Explain how social determ.docx1.What are social determinants of health  Explain how social determ.docx
1.What are social determinants of health  Explain how social determ.docxcroysierkathey
 
1.This week, we’ve been introduced to the humanities and have ta.docx
1.This week, we’ve been introduced to the humanities and have ta.docx1.This week, we’ve been introduced to the humanities and have ta.docx
1.This week, we’ve been introduced to the humanities and have ta.docxcroysierkathey
 
1.What are barriers to listening2.Communicators identif.docx
1.What are barriers to listening2.Communicators identif.docx1.What are barriers to listening2.Communicators identif.docx
1.What are barriers to listening2.Communicators identif.docxcroysierkathey
 
1.Timeline description and details There are multiple way.docx
1.Timeline description and details There are multiple way.docx1.Timeline description and details There are multiple way.docx
1.Timeline description and details There are multiple way.docxcroysierkathey
 
1.The PresidentArticle II of the Constitution establishe.docx
1.The PresidentArticle II of the Constitution establishe.docx1.The PresidentArticle II of the Constitution establishe.docx
1.The PresidentArticle II of the Constitution establishe.docxcroysierkathey
 
1.What other potential root causes might influence patient fal.docx
1.What other potential root causes might influence patient fal.docx1.What other potential root causes might influence patient fal.docx
1.What other potential root causes might influence patient fal.docxcroysierkathey
 

More from croysierkathey (20)

1.  Discuss the organization and the family role in every one of the.docx
1.  Discuss the organization and the family role in every one of the.docx1.  Discuss the organization and the family role in every one of the.docx
1.  Discuss the organization and the family role in every one of the.docx
 
1.  Compare and contrast DEmilios Capitalism and Gay Identity .docx
1.  Compare and contrast DEmilios Capitalism and Gay Identity .docx1.  Compare and contrast DEmilios Capitalism and Gay Identity .docx
1.  Compare and contrast DEmilios Capitalism and Gay Identity .docx
 
1.Purpose the purpose of this essay is to spread awareness .docx
1.Purpose the purpose of this essay is to spread awareness .docx1.Purpose the purpose of this essay is to spread awareness .docx
1.Purpose the purpose of this essay is to spread awareness .docx
 
1.  Tell us why it is your favorite film.2.  Talk about the .docx
1.  Tell us why it is your favorite film.2.  Talk about the .docx1.  Tell us why it is your favorite film.2.  Talk about the .docx
1.  Tell us why it is your favorite film.2.  Talk about the .docx
 
1.What are the main issues facing Fargo and Town Manager Susan.docx
1.What are the main issues facing Fargo and Town Manager Susan.docx1.What are the main issues facing Fargo and Town Manager Susan.docx
1.What are the main issues facing Fargo and Town Manager Susan.docx
 
1.Writing Practice in Reading a PhotographAttached Files.docx
1.Writing Practice in Reading a PhotographAttached Files.docx1.Writing Practice in Reading a PhotographAttached Files.docx
1.Writing Practice in Reading a PhotographAttached Files.docx
 
1.Some say that analytics in general dehumanize managerial activitie.docx
1.Some say that analytics in general dehumanize managerial activitie.docx1.Some say that analytics in general dehumanize managerial activitie.docx
1.Some say that analytics in general dehumanize managerial activitie.docx
 
1.What is the psychological term for the symptoms James experiences .docx
1.What is the psychological term for the symptoms James experiences .docx1.What is the psychological term for the symptoms James experiences .docx
1.What is the psychological term for the symptoms James experiences .docx
 
1.Write at least 500 words discussing the benefits of using R with H.docx
1.Write at least 500 words discussing the benefits of using R with H.docx1.Write at least 500 words discussing the benefits of using R with H.docx
1.Write at least 500 words discussing the benefits of using R with H.docx
 
1.What is Starbucks’ ROA for 2012, 2011, and 2010 Why might focusin.docx
1.What is Starbucks’ ROA for 2012, 2011, and 2010 Why might focusin.docx1.What is Starbucks’ ROA for 2012, 2011, and 2010 Why might focusin.docx
1.What is Starbucks’ ROA for 2012, 2011, and 2010 Why might focusin.docx
 
1.  Discuss the cultural development of the Japanese and the Jewis.docx
1.  Discuss the cultural development of the Japanese and the Jewis.docx1.  Discuss the cultural development of the Japanese and the Jewis.docx
1.  Discuss the cultural development of the Japanese and the Jewis.docx
 
1.  Discuss at least 2  contextual factors(family, peers,  school,.docx
1.  Discuss at least 2  contextual factors(family, peers,  school,.docx1.  Discuss at least 2  contextual factors(family, peers,  school,.docx
1.  Discuss at least 2  contextual factors(family, peers,  school,.docx
 
1.Write at least 500 words in APA format discussing how to use senti.docx
1.Write at least 500 words in APA format discussing how to use senti.docx1.Write at least 500 words in APA format discussing how to use senti.docx
1.Write at least 500 words in APA format discussing how to use senti.docx
 
1.The following clause was added to the Food and Drug Actthe S.docx
1.The following clause was added to the Food and Drug Actthe S.docx1.The following clause was added to the Food and Drug Actthe S.docx
1.The following clause was added to the Food and Drug Actthe S.docx
 
1.What are social determinants of health  Explain how social determ.docx
1.What are social determinants of health  Explain how social determ.docx1.What are social determinants of health  Explain how social determ.docx
1.What are social determinants of health  Explain how social determ.docx
 
1.This week, we’ve been introduced to the humanities and have ta.docx
1.This week, we’ve been introduced to the humanities and have ta.docx1.This week, we’ve been introduced to the humanities and have ta.docx
1.This week, we’ve been introduced to the humanities and have ta.docx
 
1.What are barriers to listening2.Communicators identif.docx
1.What are barriers to listening2.Communicators identif.docx1.What are barriers to listening2.Communicators identif.docx
1.What are barriers to listening2.Communicators identif.docx
 
1.Timeline description and details There are multiple way.docx
1.Timeline description and details There are multiple way.docx1.Timeline description and details There are multiple way.docx
1.Timeline description and details There are multiple way.docx
 
1.The PresidentArticle II of the Constitution establishe.docx
1.The PresidentArticle II of the Constitution establishe.docx1.The PresidentArticle II of the Constitution establishe.docx
1.The PresidentArticle II of the Constitution establishe.docx
 
1.What other potential root causes might influence patient fal.docx
1.What other potential root causes might influence patient fal.docx1.What other potential root causes might influence patient fal.docx
1.What other potential root causes might influence patient fal.docx
 

Recently uploaded

Visit to a blind student's school🧑‍🦯🧑‍🦯(community medicine)
Visit to a blind student's school🧑‍🦯🧑‍🦯(community medicine)Visit to a blind student's school🧑‍🦯🧑‍🦯(community medicine)
Visit to a blind student's school🧑‍🦯🧑‍🦯(community medicine)lakshayb543
 
Incoming and Outgoing Shipments in 3 STEPS Using Odoo 17
Incoming and Outgoing Shipments in 3 STEPS Using Odoo 17Incoming and Outgoing Shipments in 3 STEPS Using Odoo 17
Incoming and Outgoing Shipments in 3 STEPS Using Odoo 17Celine George
 
Proudly South Africa powerpoint Thorisha.pptx
Proudly South Africa powerpoint Thorisha.pptxProudly South Africa powerpoint Thorisha.pptx
Proudly South Africa powerpoint Thorisha.pptxthorishapillay1
 
Earth Day Presentation wow hello nice great
Earth Day Presentation wow hello nice greatEarth Day Presentation wow hello nice great
Earth Day Presentation wow hello nice greatYousafMalik24
 
Difference Between Search & Browse Methods in Odoo 17
Difference Between Search & Browse Methods in Odoo 17Difference Between Search & Browse Methods in Odoo 17
Difference Between Search & Browse Methods in Odoo 17Celine George
 
Barangay Council for the Protection of Children (BCPC) Orientation.pptx
Barangay Council for the Protection of Children (BCPC) Orientation.pptxBarangay Council for the Protection of Children (BCPC) Orientation.pptx
Barangay Council for the Protection of Children (BCPC) Orientation.pptxCarlos105
 
4.18.24 Movement Legacies, Reflection, and Review.pptx
4.18.24 Movement Legacies, Reflection, and Review.pptx4.18.24 Movement Legacies, Reflection, and Review.pptx
4.18.24 Movement Legacies, Reflection, and Review.pptxmary850239
 
Judging the Relevance and worth of ideas part 2.pptx
Judging the Relevance  and worth of ideas part 2.pptxJudging the Relevance  and worth of ideas part 2.pptx
Judging the Relevance and worth of ideas part 2.pptxSherlyMaeNeri
 
What is Model Inheritance in Odoo 17 ERP
What is Model Inheritance in Odoo 17 ERPWhat is Model Inheritance in Odoo 17 ERP
What is Model Inheritance in Odoo 17 ERPCeline George
 
Karra SKD Conference Presentation Revised.pptx
Karra SKD Conference Presentation Revised.pptxKarra SKD Conference Presentation Revised.pptx
Karra SKD Conference Presentation Revised.pptxAshokKarra1
 
Choosing the Right CBSE School A Comprehensive Guide for Parents
Choosing the Right CBSE School A Comprehensive Guide for ParentsChoosing the Right CBSE School A Comprehensive Guide for Parents
Choosing the Right CBSE School A Comprehensive Guide for Parentsnavabharathschool99
 
ISYU TUNGKOL SA SEKSWLADIDA (ISSUE ABOUT SEXUALITY
ISYU TUNGKOL SA SEKSWLADIDA (ISSUE ABOUT SEXUALITYISYU TUNGKOL SA SEKSWLADIDA (ISSUE ABOUT SEXUALITY
ISYU TUNGKOL SA SEKSWLADIDA (ISSUE ABOUT SEXUALITYKayeClaireEstoconing
 
Keynote by Prof. Wurzer at Nordex about IP-design
Keynote by Prof. Wurzer at Nordex about IP-designKeynote by Prof. Wurzer at Nordex about IP-design
Keynote by Prof. Wurzer at Nordex about IP-designMIPLM
 

Recently uploaded (20)

Visit to a blind student's school🧑‍🦯🧑‍🦯(community medicine)
Visit to a blind student's school🧑‍🦯🧑‍🦯(community medicine)Visit to a blind student's school🧑‍🦯🧑‍🦯(community medicine)
Visit to a blind student's school🧑‍🦯🧑‍🦯(community medicine)
 
Raw materials used in Herbal Cosmetics.pptx
Raw materials used in Herbal Cosmetics.pptxRaw materials used in Herbal Cosmetics.pptx
Raw materials used in Herbal Cosmetics.pptx
 
Incoming and Outgoing Shipments in 3 STEPS Using Odoo 17
Incoming and Outgoing Shipments in 3 STEPS Using Odoo 17Incoming and Outgoing Shipments in 3 STEPS Using Odoo 17
Incoming and Outgoing Shipments in 3 STEPS Using Odoo 17
 
Proudly South Africa powerpoint Thorisha.pptx
Proudly South Africa powerpoint Thorisha.pptxProudly South Africa powerpoint Thorisha.pptx
Proudly South Africa powerpoint Thorisha.pptx
 
Model Call Girl in Tilak Nagar Delhi reach out to us at 🔝9953056974🔝
Model Call Girl in Tilak Nagar Delhi reach out to us at 🔝9953056974🔝Model Call Girl in Tilak Nagar Delhi reach out to us at 🔝9953056974🔝
Model Call Girl in Tilak Nagar Delhi reach out to us at 🔝9953056974🔝
 
Earth Day Presentation wow hello nice great
Earth Day Presentation wow hello nice greatEarth Day Presentation wow hello nice great
Earth Day Presentation wow hello nice great
 
Difference Between Search & Browse Methods in Odoo 17
Difference Between Search & Browse Methods in Odoo 17Difference Between Search & Browse Methods in Odoo 17
Difference Between Search & Browse Methods in Odoo 17
 
Barangay Council for the Protection of Children (BCPC) Orientation.pptx
Barangay Council for the Protection of Children (BCPC) Orientation.pptxBarangay Council for the Protection of Children (BCPC) Orientation.pptx
Barangay Council for the Protection of Children (BCPC) Orientation.pptx
 
OS-operating systems- ch04 (Threads) ...
OS-operating systems- ch04 (Threads) ...OS-operating systems- ch04 (Threads) ...
OS-operating systems- ch04 (Threads) ...
 
YOUVE GOT EMAIL_FINALS_EL_DORADO_2024.pptx
YOUVE GOT EMAIL_FINALS_EL_DORADO_2024.pptxYOUVE GOT EMAIL_FINALS_EL_DORADO_2024.pptx
YOUVE GOT EMAIL_FINALS_EL_DORADO_2024.pptx
 
4.18.24 Movement Legacies, Reflection, and Review.pptx
4.18.24 Movement Legacies, Reflection, and Review.pptx4.18.24 Movement Legacies, Reflection, and Review.pptx
4.18.24 Movement Legacies, Reflection, and Review.pptx
 
Judging the Relevance and worth of ideas part 2.pptx
Judging the Relevance  and worth of ideas part 2.pptxJudging the Relevance  and worth of ideas part 2.pptx
Judging the Relevance and worth of ideas part 2.pptx
 
What is Model Inheritance in Odoo 17 ERP
What is Model Inheritance in Odoo 17 ERPWhat is Model Inheritance in Odoo 17 ERP
What is Model Inheritance in Odoo 17 ERP
 
Karra SKD Conference Presentation Revised.pptx
Karra SKD Conference Presentation Revised.pptxKarra SKD Conference Presentation Revised.pptx
Karra SKD Conference Presentation Revised.pptx
 
YOUVE_GOT_EMAIL_PRELIMS_EL_DORADO_2024.pptx
YOUVE_GOT_EMAIL_PRELIMS_EL_DORADO_2024.pptxYOUVE_GOT_EMAIL_PRELIMS_EL_DORADO_2024.pptx
YOUVE_GOT_EMAIL_PRELIMS_EL_DORADO_2024.pptx
 
Choosing the Right CBSE School A Comprehensive Guide for Parents
Choosing the Right CBSE School A Comprehensive Guide for ParentsChoosing the Right CBSE School A Comprehensive Guide for Parents
Choosing the Right CBSE School A Comprehensive Guide for Parents
 
LEFT_ON_C'N_ PRELIMS_EL_DORADO_2024.pptx
LEFT_ON_C'N_ PRELIMS_EL_DORADO_2024.pptxLEFT_ON_C'N_ PRELIMS_EL_DORADO_2024.pptx
LEFT_ON_C'N_ PRELIMS_EL_DORADO_2024.pptx
 
ISYU TUNGKOL SA SEKSWLADIDA (ISSUE ABOUT SEXUALITY
ISYU TUNGKOL SA SEKSWLADIDA (ISSUE ABOUT SEXUALITYISYU TUNGKOL SA SEKSWLADIDA (ISSUE ABOUT SEXUALITY
ISYU TUNGKOL SA SEKSWLADIDA (ISSUE ABOUT SEXUALITY
 
Keynote by Prof. Wurzer at Nordex about IP-design
Keynote by Prof. Wurzer at Nordex about IP-designKeynote by Prof. Wurzer at Nordex about IP-design
Keynote by Prof. Wurzer at Nordex about IP-design
 
FINALS_OF_LEFT_ON_C'N_EL_DORADO_2024.pptx
FINALS_OF_LEFT_ON_C'N_EL_DORADO_2024.pptxFINALS_OF_LEFT_ON_C'N_EL_DORADO_2024.pptx
FINALS_OF_LEFT_ON_C'N_EL_DORADO_2024.pptx
 

1.Student Kiare MaysDate 061520Instructor Valer.docx

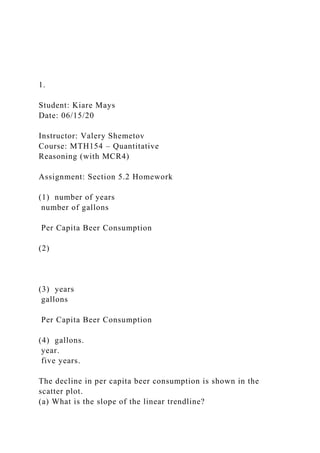
  • 1. 1. Student: Kiare Mays Date: 06/15/20 Instructor: Valery Shemetov Course: MTH154 – Quantitative Reasoning (with MCR4) Assignment: Section 5.2 Homework (1) number of years number of gallons Per Capita Beer Consumption (2) (3) years gallons Per Capita Beer Consumption (4) gallons. year. five years. The decline in per capita beer consumption is shown in the scatter plot. (a) What is the slope of the linear trendline?
  • 2. (b) Interpret the slope in real world terms by filling in the blanks. 1975 1980 1985 1990 1995 2000 2005 2010 20.5 21 21.5 22 22.5 23 23.5 24 24.5 25 ga llo ns (a) The slope of the linear trendline is . (Type an integer or a decimal.) (b) The (1) is changing by (2) (3) per (4) years 281.75 − 0.13 Per Capita Beer Consumption
  • 3. y = − 0.13x + 281.75 2. 3. (1) Per Capita Entitlement Spending number of 2011$ number of years (2) (3) years 2011$ Per Capita Entitlement Spending (4) year. decade. 2011$. The amount the government spends per person on social programs (entitlement spending) has been steadily increasing in a certain country (all values 2011$): (a) What is the slope of the linear trendline? (b) Interpret the slope in real world terms by filling in the blanks. 1950 1960 1970 1980 1990 2000 2010 2020 $0.00 $1,000.00
  • 4. $2,000.00 $3,000.00 $4,000.00 $5,000.00 $6,000.00 $7,000.00 $8,000.00 20 11 $ (a) The slope of the linear trendline is . (Type an integer or a decimal.) (b) The (1) is changing by (2) (3) per (4) − 210,276 107.6 (1) Average Strikeouts Per Team Per Game number of strikeouts number of years (2)
  • 5. (3) Average Strikeouts Per Team Per Game years strikeouts (4) year. decade. strikeout. The number of strikeouts in a baseball league has been on the rise since 1980. (a) What is the slope of the linear trendline? (b) Interpret the slope in real world terms by filling in the blanks. 1975 1980 1985 1990 1995 2000 2005 2010 2015 4 4.5 5 5.5 6 6.5 7 7.5 8 # st
  • 6. rik eo ut s (a) The slope of the linear trendline is . (Type an integer or a decimal.) (b) The (1) is changing by (2) (3) per (4) 0.0672 − 128.19 Government Entitlement Spending y = 107.6x − 210,276 Average Strikeouts per Team per Game y = 0.0672x − 128.19 4. 5. (1) Consider the graph to the right. a. In words, describe the function shown on the graph. b.Find the slope of the graph and express it as a rate of change.
  • 7. c. Briefly discuss the conditions under which a linear function is a realistic model for the given situation. 0 1 2 3 4 5 0 1 2 3 4 5 Time (hours) R ai n D ep th (i nc he s) a. Select the correct answer below. A. According to the function, the rain depth increases by every
  • 8. .4 inches 1 hour B. According to the function, the rain depth decreases by every .4 inches 1 hour C. According to the function, the rain depth increases by every .1 inch 4 hours D. According to the function, the rain depth decreases by every .1 inch 4 hours b. Calculate the slope and represent it as a rate of change. rate of change (1) = (Type an integer or a fraction.) c. Select the correct answer below. A. It is a good model if the rate of the rainfall decreases over time. B. It is a good model if the rate of the rainfall does not remain constant over time. C. It is a good model if the rate of the rainfall remains constant over time. D. It is a good model if the rate of the rainfall increases over time. inch(es) per hour hour(s) per inch Plot the two given points and then sketch the line that contains the points. Find the run and rise in going from the first point listed to the second point listed. Find the slope of the line. ( , ) and ( , ) − 8 − 3 − 3 − 23
  • 9. Choose the correct graph below. A. -12 12 -36 36 x y B. -12 12 -36 36 x y C. -12 12 -36 36 x
  • 10. y D. -12 12 -36 36 x y The run of the line is . (Type an integer or a simplified fraction.) The rise of the line is . (Type an integer or a simplified fraction.) The slope of the line is . (Type an integer or a simplified fraction.) 6. 7. A person's annual salary increases by $ over -year period. Find the average rate of change of the salary per year. 11,000 an 11 The average rate of change is $ per year.
  • 11. In response to rising concerns about identity theft, the number of models of paper shredders a company manufactures increased approximately steadily from models in to models in . Find the average rate of change of the number of shredder models manufactured per year between and . 4 1996 38 2006 1996 2006 The average rate of change of the number of paper shredders manufactured per year between and was . 1996 2006 (Type an integer or decimal rounded to two decimal places as needed.) 8. The number of country households that paid bills online was million in 2006 and has increased by about million per year. Let n be the number of households (in millions) that paid bills online at t years since 2006. Complete parts a. and b. 16 4 a. Is there a linear relationship between t and n? Explain. If the relationship is linear, find the slope and describe what it means in this situation. Choose the correct answer below, and if necessary, fill in the answer box.
  • 12. A. Yes. Since the rate of change of the number of country households that paid bills online per year is a constant million per year, the variables t and n are linearly related. The slope is . The number of households that pay bills online has decreased by million per year. 4 B. Yes. Since the rate of change of the number of country households that paid bills online per year is a constant million per year, the variables t and n are linearly related. The slope is . The number of households that pay bills online has increased by million per year. 4 C. No. Since the rate of change of the number of country households that paid bills online per year varries per year, the variables t and n are not linearly related. b. Describe the Rule of Four as it applies to this situation. i. Use an equation to describe the number of households (in millions) that paid bills online t years since 2006. n (Type an expression using t as the variable.)= ii. Use a table of values of t and n to describe the situation. Years
  • 13. since 2006 t Number of households (millions) n 0 1 2 3 4 (Type integers or decimals.) iii. Use a graph to describe the situation. Choose the correct graph below. A. 0 5 0 100 t n B. 0 5 0 100
  • 14. t n C. 0 5 0 100 t n D. 0 5 0 100 t n 9. 10. Let n be the number of oil refineries at t years since . A reasonable model of the number of oil refineries is n t .
  • 15. 2001 = − 3.42 + 135.55 a. What is the slope? What does it mean in this situation? b. What is the n-intercept? What does it mean in this situation? c. Predict the number of refineries in .2013 a. What is the slope? m = What does the slope mean in this situation? A. It means the number of refineries in was about .2001 135.55 B. It means that the number of refineries are decreasing by about per year.135.55 C. It means the number of refineries in was about .2001 3.42 D. It means that the number of refineries are decreasing by about per year.3.42 b. What is the n-intercept? (Type an ordered pair.) What does the n-intercept mean in this situation? A. It means that the number of refineries are decreasing by about per year.3.42 B. It means the number of refineries in was about .2001 3.42 C. It means that the number of refineries are decreasing by about per year.135.55 D. It means the number of refineries in was about .2001 135.55 c. Predict the number of refineries in .2013
  • 16. The number of refineries will be about . (Round to the nearest whole number as needed.) Let F be the temperature (in degrees Fahrenheit) at t hours after noon. The line in the figure shown below describes the relationship between t and F. 0 1 2 3 4 5 6 0 10 20 30 40 50 60 Hours D eg re es F ah re nh
  • 17. ei t t F Complete parts a. and b. a. Is the rate of change of temperature per hour constant? Explain. A. Yes because there is a linear relationship between t and F. B. No because there is no linear relationship between t and F. b. What is the rate of change of temperature per hour? F° (Type an integer or decimal rounded to two decimal places as needed.) 11. 12. The number of strikeouts in a baseball league has been on the rise since 1980. (a) What is the y-intercept of the linear trendline? (b) Interpret the y-intercept in real world terms. 1975 1980 1985 1990 1995 2000 2005 2010 2015
  • 18. 4 4.5 5 5.5 6 6.5 7 7.5 8 # st rik eo ut s (a) The y-intercept of the linear trendline is . (Type an integer or a decimal.) (b) Choose the correct answer below. A. The Average Strikeouts Per Team Per Game in 0 CE was about , which makes no sense in real world terms.
  • 19. 4.5 B. The Average Strikeouts Per Team Per Game in 0 CE was , which makes no sense in real world terms. − 141.87 C. The Average Strikeouts Per Team Per Game in 1975 was about .4.5 D. The Average Strikeouts Per Team Per Game in 1975 was , which makes no sense in real world terms. − 141.87 The amount the government spends per person on social programs (entitlement spending) has been steadily increasing in a certain country (all values 2011$): (a) What is the y-intercept of the linear trendline? (b) Interpret the y-intercept in real world terms. 1950 1960 1970 1980 1990 2000 2010 2020 $0.00 $1,000.00 $2,000.00 $3,000.00 $4,000.00 $5,000.00
  • 20. $6,000.00 $7,000.00 $8,000.00 20 11 $ (a) The y-intercept of the linear trendline is . (Type an integer or a decimal.) (b) Choose the correct answer below. A. The Per Capita Entitlement Spending was $1,000 (2011$) in 1950, which makes no sense in real world terms. − B. The Per Capita Entitlement Spending was (2011$) in 1950, which makes no sense in real world terms. − $208,025 C. The Per Capita Entitlement Spending was (2011$) in 0 CE, which makes no sense in real world terms. $208,025 D. The Per Capita Entitlement Spending was (2011$) in 0 CE, which makes no
  • 21. sense in real world terms. − $208,025 Average Strikeouts per Team per Game y = 0.0741x − 141.87 Government Entitlement Spending y = 106.48x − 208,025 13. Water is steadily pumped out of a flooded basement. Let v be the volume of water (in thousands of gallons) that remains in the basement t hours after the water began to be pumped. A linear model is shown below. -1 1 2 3 4 5 6 7 8 9 -4 4 8 12 16 20 24 28
  • 22. 32 Hours Th ou sa nd s of g al lo ns t Complete parts a) through d). a) How much water is in the basement after hours of pumping? 3 thousand gallons b) After how many hours of pumping will thousand gallons remain in the basement? 6 hours
  • 23. c) How much water was in the basement before any water was pumped out? thousand gallons d) After how many hours of pumping will all the water be pumped out of the basement? hours 14. Let g be the number of gallons of gasoline that remain in a car's gasoline tank after the car has been driven d miles since the tank was filled. Some pairs of values of d and g are shown in the following table. d (miles) g (gallons) 20 12 40 10 60 8 80 6 100 4 120 2 Complete parts a. to e. a. Create a scattergram of the data. Then draw a linear model.
  • 24. Choose the correct scattergram below. A. 0 160 0 16 d g B. 0 160 0 16 d g C. 0 160 0 16 d g
  • 25. D. 0 160 0 16 d g b. Estimate how much gasoline is in the tank after the driver has gone miles since last filling up.70 After the driver has gone miles since last filling up, there will be gallons of gasoline in the tank. 70 c. Estimate the number of miles driven since the tank was last filled if of gasoline in the tank.1 gallon remains The driver drove miles since the tank was last filled if of gasoline in the tank.1 gallon is d. Find the d-intercept of the model. What does it mean in this situation? Select the correct choice below and, if necessary, fill in the answer box to complete your choice. (Type an ordered pair.) A. The d-intercept of the model is . The d-intercept
  • 26. estimates the number miles after which the gasoline tank will be empty. B. The d-intercept of the model is . The d-intercept estimates the number of gallons of gasoline in the tank at the start of the trip. e. Find the g-intercept of the model. What does it mean in this situation? Select the correct choice below and, if necessary, fill in the answer box to complete your choice. (Type an ordered pair.) A. The g-intercept of the model is g p . The g-intercept estimates the number of gallons of gasoline in the tank at the start of the trip. B. The g-intercept of the model is . The g-intercept estimates the number miles after which the gasoline tank will be empty.
  • 27. 15. 16. 17. A person earns a starting salary of $ thousand at a company. Each year, he receives a $ thousand raise. Let s be the salary (in thousands of dollars) after he has worked at the company for t years. Complete parts (a) through (e). 8 2 a. Complete the table to help find an equation for t and s. Show the arithmetic that helps to identify the pattern. (Do not include the $ symbol in your answers.) Time at Company (years) t Salary (thousands of dollars) s 0 +2 • 1 +2 • 2 +2 • 3 +2 • 4 +2 • s (Type an expression using t as the variable.)= b. Perform a unit analysis of the equation found in part (a).
  • 28. Choose the correct answer below. A. In the equation, the units on both sides are thousands of dollars, so the equation is correct. B. In the equation, the units on both sides are years, so the equation is correct. C. In the equation, the units on one side are thousands of dollars and the units on the other side are years, so the equation is correct. c. Graph the equation by hand. Choose the correct graph below. A. 0 8 0 24 t s B. 0 8 0 24 t s
  • 29. C. 0 8 0 24 t s D. 0 8 0 24 t s d. What is the s-intercept? What does it mean in this situation? Select the correct choice below and fill in the answer box to complete your choice. (Type an ordered pair.) A. The s-intercept of the model is , and it represents the person's salary when he quits the job. B. The s-intercept of the model is , and it represents the person's salary when he
  • 30. joined the company. e. When will the person's salary be $ thousand?18 The person's salary will be $ thousand after years.18 (Type an integer or a decimal.) You can not print this question until you complete the required media. You can not print this question until you complete the required media. 1. Student: Kiare Mays Date: 06/15/20 Instructor: Valery Shemetov Course: MTH154 – Quantitative Reasoning (with MCR4) Assignment: Section 5.4 Homework The percentages of dentistry degrees earned by women are shown in the table for various years. Year Percent 1970 3 1980 15 1990 28 2000 41 2002 40
  • 31. Let p be the percentage of dentistry degrees earned by women at t years since 1970. For example, t = 0 represents 1970 and t = 10 represents 1980. a. Create a scattergram of the data. Choose the correct scattergram below. A. 0 10 20 30 40 0 10 20 30 40 50 60 t p B. 0 10 20 30 40 0 10 20 30 40 50 60
  • 32. t p C. 0 10 20 30 40 0 10 20 30 40 50 60 t p D. 0 10 20 30 40 0 10 20 30 40 50 60 t p
  • 33. b. Draw a line that comes close to the points in your scattergram. Choose the correct scattergram below. A. 0 10 20 30 40 0 10 20 30 40 50 60 t p B. 0 10 20 30 40 0 10 20 30 40 50 60 t p C.
  • 34. 0 10 20 30 40 0 10 20 30 40 50 60 t p D. 0 10 20 30 40 0 10 20 30 40 50 60 t p c. Predict the percentage of dentistry degrees that will be earned by women in 2010. The percentage of dentistry degrees earned by women in 2010 will be about %.
  • 35. d. Estimate when women earned 20% of dentistry degrees. Women earned 20% of dentistry degrees in . 2. If there are too many ticketed passengers for a flight, a person can volunteer to be "bumped" onto another flight. The voluntary bumping rates for large U.S. airlines (number of bumps per 10,000 passengers, January through September) are shown in the table for various years. Let r be the voluntary bumping rate (number of bumps per 10,000 passengers) at t years since 2000. Year Bumping Rate 2000 23 2001 21 2002 20 2003 15 2004 14 2005 12 a. Create a scattergram of the data. Choose the correct graph below. A. 0 5 10 15 20 25 0 1 2
  • 37. 25 Years since 2000 Bu m pi ng R at e t r C. 0 1 2 3 4 5 0 5 10 15 20 25 Years since 2000
  • 38. Bu m pi ng R at e t r b. Draw a line that comes close to the points in your scattergram. Choose the correct graph below. A. 0 5 10 15 0 5 10 15 20 25
  • 39. Years since 2000 Bu m pi ng R at e t r B. 0 5 10 15 0 5 10 15 20 25 Years since 2000 Bu m
  • 40. pi ng R at e t r C. 0 5 10 15 20 25 0 5 10 15 Years since 2000 Bu m pi ng R at e
  • 41. t r c. What is the r-intercept of the line in part b.? (Round to the nearest integer. Type an ordered pair.) What does it mean in this situation? A. According to the model, the average bumping rate will be 0 per passengers in the year 20 . 10,000 23 B. According to the model, the average bumping rate per passengers was decreasing by in the year 2000. 10,000 23 C. According to the model, the average bumping rate was per passengers in the year 2000. 23 10,000 d. Predict when the voluntary bumping rate will be bumps per 10,000 passengers using the line in part b.5 (Round to the nearest year.)
  • 42. e. What is the t-intercept of the line in part b.? (Round to the nearest integer. Type an ordered pair.) What does it mean in this situation? A. According to the model, the average bumping rate was per passengers in the year 2000. This seems reasonable, since the airlines cannot eliminate bumping completely. 10 10,000 B. According to the model, the average bumping rate will be 0 per passengers in the year . Since this prediction implies that the airlines will eliminate bumping completely, it is not plausible, and therefore model breakdown has occurred. 10,000 2010 C. According to the model, the average bumping rate will be 0 per passengers in the year . Since this prediction implies that the airlines will eliminate bumping completely, it is not plausible, and therefore model breakdown has occurred. 10 2010
  • 43. 3. The percentages of people who are satisfied with the way things are in their country are shown in the table on the right for various years. Year Percent Year Percent 1992 16 1996 40 1993 24 1997 45 1994 28 1998 52 1995 37 1999 51 Let p be the percentage of people at t years since 1990 who are satisfied with the way things are. a. Create a scattergram of the data. Choose the correct answer below. A. 0 3 6 9 12 15 0 15 30 45 60 75 90 t p B.
  • 44. 0 3 6 9 12 15 0 15 30 45 60 75 90 t p C. 0 3 6 9 12 15 0 15 30 45 60 75 90 t p D. 0 3 6 9 12 15 0 15
  • 45. 30 45 60 75 90 t p b. Draw a line that comes close to the data points. Choose the correct answer below. A. 0 3 6 9 12 15 0 15 30 45 60 75 90 t p B. 0 3 6 9 12 15 0 15 30
  • 46. 45 60 75 90 t p C. 0 3 6 9 12 15 0 15 30 45 60 75 90 t p D. 0 3 6 9 12 15 0 15 30 45 60 75 90
  • 47. t p c. Use your line to estimate the percentage of people who were satisfied in .2003 The percentage of people who were satisfied in is %.2003 d. Data for the years 2000-2004 are shown in the table on the right. Year Percent Year Percent 2000 52 2003 43 2001 48 2004 41 2002 46 Create a scattergram of the data for the years 1992-2004. Choose the correct answer below. A. 0 3 6 9 12 15 0 15 30 45 60 75 90 t p
  • 48. B. 0 3 6 9 12 15 0 15 30 45 60 75 90 t p C. 0 3 6 9 12 15 0 15 30 45 60 75 90 t p D. 0 3 6 9 12 15
  • 49. 0 15 30 45 60 75 90 t p e. Compute the error in the estimation for that you made in part (c). (The error is the difference between the estimated percentage and the actual percentage.) 2003 The error in the estimation for is %.2003 4. 5. The windchill is a measure of how cold you feel as a result of being exposed to wind. The table below provides some data on windchills for various temperatures for a certain wind speed. Temperature (oF) Windchill (oF) − 15 − 31 − 12 − 26 − 5 − 20
  • 50. 4 − 11 10 − 3 13 5 18 10 25 13 Let w be the windchill (in degrees Fahrenheit) corresponding to a temperature of t degrees Fahrenheit. (a) Without graphing, estimate the coordinates of the t-intercept for a line that comes close to the data points. Choose the correct answer below. ( ,0)13 ( ,0)− 13 ( ,0)10 ( ,0)12 (b) Without graphing, estimate the coordinates of the w-intercept for a line that comes close to the data points.Choose the correct answer below. (0, )12 (0, )− 11 (0, )− 13 (0, )− 20 Consider the scattergram of data and the graph of the model y = mx + b in the indicated figure. Sketch the graph of a linear model that describes the data better.
  • 51. 0 14 0 14 x y Choose the correct answer below. A. 0 14 0 14 x y B. 0 14 0 14 x y C.
  • 52. 0 14 0 14 x y D. 0 14 0 14 x y 6. The table lists College record times for the men's 400-meter run. Year 1900 1916 1928 1932 1941 1950 1961 1968 1988 1999 Record Time (seconds) 54.6 54.2 53.8 52.9 52.7 52.6 51.5 50.35 49.71 49.64 a. Let r be the record time (in seconds) at t years since 1900. Use a graphing calculator to draw a scattergram of the data. Choose the correct answer below. A.
  • 53. 0 120 40 60 B. 0 120 40 60 C. 0 120 40 60 D. 0 120 40 60 b. Find an equation of a linear model to describe the data. Choose the equation below that best represents the data. A. r = 0.062t + 55.192 B. t = − 0.062r + 55.192 C. r = − 0.05t + 57.173 D. r = − 0.062t + 55.192 c. Draw your line and the scattergram in the same viewing window. Verify that the line passes through the two points you
  • 54. chose in finding the equation in part (b) and that it comes close to all of the data points. Choose the correct answer below. A. 0 120 40 60 B. 0 120 40 60 C. 0 120 40 60 D. 0 120 40 60 7. The market shares (percentages of vehicle sales) of an automobile company are shown in the table to the right for various years. Use the table to answer parts (a)
  • 55. through (e). Year Market Share (%) 1998 26 2000 23 2002 20 2004 19 2006 15 2008 14 a. Let s f(t) be the company's market share (in percent) at t years since 1995. Find an equation of f using the data points for the years 2000 and 2008. Does the model fit the data well? = f(t) = (Round to three decimal places as needed.) Does the model fit the data well? Yes No b. Find f( ). What does it mean in this situation?4 f( )4 = (Round to three decimal places as needed.) Intepret the result.
  • 56. According to the model, % of the market share belongs to the automobile company in the year . (Round to the nearest year as needed.) c. Find t when f(t) . What does it mean in this situation?= 6 t = (Round to two decimal places as needed.) Interpret the result. According to the model, % of the market share belongs to the automobile company in the year . (Round to the nearest year as needed.) d. Find the t-intercept. What does it mean in this situation? The t-intercept is . (Type an ordered pair. Round to two decimal places as needed.) Interpret the t-intercept. According to the model, % of the market share belongs to the automobile company in the year . (Round to the nearest year as needed.) e. Find the s-intercept. What does it mean in this situation? The s-intercept is .
  • 57. (Type an ordered pair. Round to three decimal places as needed.) Intepret the s-intercept. 8. According to the model, % of the market share belongs to the automobile company in the year . (Round to the nearest year as needed.) An equation models the percentage p of births outside marriage in a country at t years since 1900 (see table on the right.) Use the equation to answer parts (a) through (e). p = 0.77t − 43.18 Year Percent of Births Outside Marriage 1970 10.7 1975 14.6 1980 18.4 1985 22.3 1990 26.1 1995 30.0 2000 33.8 2005 37.7 a. Rewrite the equation with the function name f. Choose the correct answer below.p = 0.77t − 43.18 A. f(t) = 0.77p − 43.18 B. f(p) = 0.77p − 43.18 C. f(p) = t D. f(t) = 0.77t − 43.18
  • 58. b. Find f( ). What does the result mean in this situation?114 f( ) (Type an integer or a decimal.)114 = Interpret the result. According to the model, about % of births in the year will be outside marriage. (Round to the nearest year as needed.) c. Find the value of t so that f(t) . What does the result mean in this situation?= 55 t (Round to two decimal places as needed.) = Interpret the result. According to the model, % of births around the year will be outside marriage. (Round to the nearest year as needed.) d. According to the model, in what year will all births be outside marriage? All births will be outside marriage in the year . (Round to the nearest year as needed.) e. Estimate the percentage of births outside marriage in 1997. The actual percentage is 32.4%. What is the error in the estimate? (The error is the difference between the estimated value and the actual value.) According to the model, % of births were outside of marriage in 1997. (Round to one decimal place as needed.)
  • 59. Find the error. The error is percentage point(s). (Type an integer or a decimal. Use the answer from the previous step to find this answer.) 9. 10. 11. The number of commercial airline boardings on domestic flights increased steadily during the 1990s. Let f(t) be the number of commercial airline boardings on domestic flights (in millions) for the year that is t years since 1990. Year Number of Boardings(millions) 1991 452 1993 481 1995 548 1997 597 1999 634 2000 667 a. Use a graphing calculator to draw a scattergram of the data. Choose the correct graph below. A. B. C. D. The viewing window for all graphs is Xmin 0, Xmax 11,
  • 60. Xscl 1, Ymin 430, Ymax 680, Yscl 25. = = = = = = b. Find an equation of f. Does your model fit the data well? Choose the correct answer below. A. f(t) t= 24.32 + 421.33 B. f(t) t= 421.33 + 24.32 C. f(t) f= 421.33 − 24.32 D. f(t) f= 24.32 − 421.33 Does your model fit the data well? no yes c. Use your model f to estimate the number of boardings in .2004 The model predicts that the number of boardings in is million. 2004 (Round to the nearest integer as needed.) The actual number was million. What is the error in your estimate? 694 The error is million. (Round to the nearest integer as needed.)
  • 61. The percentage of female workers who prefer a female boss over a male boss increased approximately linearly from % in 1975 to % in 2006. Predict when % of female workers will prefer a female boss. 11 25 31 % of female workers will prefer a female boss in year .31 (Round to the nearest whole number as needed.) You can not print this question until you complete the required media. 12. You can not print this question until you complete the required media. 1. 2. 3. Student: Kiare Mays Date: 06/15/20 Instructor: Valery Shemetov Course: MTH154 – Quantitative Reasoning (with MCR4)
  • 62. Assignment: Section 5.3 Homework The following situation involves a rate of change that is constant. Write a statement that describes how one variable changes with respect to the other, give the rate of change numerically (with units), and use the rate of change rule to answer any questions. You run along a path at a constant speed of miles per hour. How far do you travel in hours? in hours?5.6 1.9 3.8 Which statement describes this situation? A. Time varies with respect to distance traveled with a rate of change of mi/h.5.6 B. Time varies with respect to distance traveled with a rate of change of h/mi.5.6 C. The distance traveled varies with respect to time with a rate of change of mi/h.5.6 D. The distance traveled varies with respect to time with a rate of change of h/mi.5.6 What is the distance traveled after hours?1.9 miles (Type an integer or a decimal.) What is the distance traveled after hours?3.8 miles (Type an integer or a decimal.) The following situation can be modeled by a linear function. Write an equation for the linear function and use it to answer the given question.
  • 63. The price of a particular model car is $ today and rises with time at a constant rate of $ per year. How much will a new car cost in years? 21,000 980 3.3 The equation used to model this situation is , where p is the price of a car in dollars and t is time in years. The price of a car after years will be $ .3.3 A $ washing machine in a laundromat is depreciated for tax purposes at a rate of per year. Find a function for the depreciated value of the washing machine as it varies with time. When does the depreciated value reach $0? 1260 $90 The equation of the line in slope-intercept form is V .= (Type your answer in slope-intercept form. Type an expression using t as the variable. Do not include the $ symbol in your answer.) It takes years for the machine to depreciate to $ .0 4. 5. Find the slope and the point containing the y-intercept. Then graph the equation.
  • 64. y x= − 7 − 2 What is the slope? (Type an integer or a fraction.) What is the point containing the y-intercept? (Type an ordered pair.) Use the graphing tool to graph the line. Use the slope and y-intercept when drawing the line. -20 -16 -12 -8 -4 4 8 12 16 20 -20 -16 -12 -8 -4 4 8 12 16 20 x y
  • 65. Use the slope and the point containing the y-intercept to graph the line. y x= 3 − 8 What is the slope? (Type an integer or a fraction.) What is the point containing the y-intercept? (Type an ordered pair.) Use the graphing tool to graph the line. Use the slope and y-intercept when drawing the line. -10 -8 -6 -4 -2 2 4 6 8 10 -10 -8 -6 -4 -2 2 4 6 8 10
  • 66. x y 6. 7. 8. (1) dependent independent (2) dependent independent (3) is not is A group of climbers begin climbing at an elevation of feet and ascend at a steady rate of vertical feet per hour. This situation can be modeled by a linear function. Identify the independent and dependent variables. Draw a graph of the function, then use the graph to find their elevation after hours. Is a linear model reasonable for this situation? 7500 1500 2 The number of hours is the (1) variable.
  • 67. The elevation in feet is the (2) variable. Use the graphing tool to graph the line. The elevation after hours is feet.2 A linear model (3) reasonable. 0 1 2 3 4 5 6 2000 4000 6000 8000 10,000 12,000 14,000 16,000 Number of Hours El ev at io n (fe
  • 68. et ) Find the y-intercept and graph the equation by hand. Use a graphing calculator to verify your answer. y = 3x − 2 Use the graphing tool to graph the line. Use the y-intercept and another point when drawing the line. -10 -8 -6 -4 -2 2 4 6 8 10 -10 -8 -6 -4 -2 2 4 6 8 10 x
  • 69. y Find an equation of the line that contains the points listed in the following table. x y 0 0 1 − 6 2 − 12 3 − 18 4 − 24 The equation of the line is y . = (Use integers or fractions for any numbers in the equation.) 9. 10. 11. 12. 13. The graph of an equation is shown to the right. a. Create a table of ordered-pair solutions of this equation. b. Find an equation of the line. [Hint: Recognize a pattern from the table you created in part (a).] a. x y − 2 − 1
  • 70. 0 1 2 b. What is an equation of this line? y (Simplify your answer.)= -10 -8 -6 -4 -2 2 4 6 8 10 -10 -8 -6 -4 -2 2 4 6 8 10 x y Determine the slope and the y-intercept. Use the slope and the y-intercept to graph the equation. Use a graphing
  • 71. calculator to verify your work. y x= 4 − 2 The slope is m .= (Simplify your answer.) The y-intercept is . (Type an ordered pair. Simplify your answer.) Use the graphing tool to graph the equation. Use the slope and y-intercept when drawing the line. -10 -8 -6 -4 -2 2 4 6 8 10 -10 -8 -6 -4 -2 2 4 6 8 10 x
  • 72. y Let y be the value (in thousands of dollars) of a car when it is x years old. Some pairs of values of x and y are listed in the table. Find an equation that describes the relationship between x and y. Age (years), x Value (thousands of dollars), y 0 61 1 54 2 47 3 40 4 33 The equation that describes the relationship between x and y is y .= (Do not factor.) You can not print this question until you complete the required media. You can not print this question until you complete the required media. 1. 2.
  • 73. 3. Student: Kiare Mays Date: 06/15/20 Instructor: Valery Shemetov Course: MTH154 – Quantitative Reasoning (with MCR4) Assignment: Section 6.1 Homework You deposit $ into a savings account with an APR of %. Complete parts (a) through (c) below.4000 5.7 (a) Compute the amount of interest you gain after 1 year. $ (Round to the nearest dollar as needed.) (b) To compute the amount of money in the savings account at the end of 1 year, take the original value and add interest: . This is equivalent to multiplying $ by what factor?$4000 + 5.7% • $4000 4000 (Round to three decimal places as needed.) (c) Fill in the following table, one year at a time: (Round to the nearest cent as needed.) Year Beginning Interest End 1 $4000 $ $ 2 $ $ $ 3 $ $ $ 4 $ $ $ 5 $ $ $ Calculate the amount of money you'll have at the end of the
  • 74. indicated time period, assuming that you earn simple interest. You deposit $ in an account with an annual interest of % for years.3900 3.2 5 The amount of money you'll have at the end of years is $ .5 (Type an integer or a decimal.) Complete the table, for the following investments, which shows the performance (interest and balance) over a 5-year period. Suzanne deposits $ in an account that earns simple interest at an annual rate of %. Derek deposits $ in an account that earns compound interest at an annual rate of % and is compounded annually. 4000 4.4 4000 4.4 Year Suzanne's Annual Interest Suzanne's Balance Derek's Annual Interest Derek's
  • 75. Balance 1 $____ $____ $____ $____ 2 $____ $____ $____ $____ 3 $____ $____ $____ $____ 4 $____ $____ $____ $____ 5 $____ $____ $____ $____ Complete the following table. (Round to the nearest dollar as needed.) Year Suzanne's Annual Interest Suzanne's Balance Derek's Annual Interest Derek's Balance 1 $ $ $ $ 2 $ $ $ $ 3 $ $ $ $ 4 $ $ $ $ 5 $ $ $ $ 4. 5.
  • 76. 6. 7. Use the compound interest formula to determine the accumulated balance after the stated period. $ invested at an APR of % for years.6000 5 2 If interest is compounded annually, what is the amount of money after years?2 $ (Do not round until the final answer. Then round to the nearest cent as needed.) Use the compound interest formula to compute the balance in the following account after the stated period of time, assuming interest is compounded annually. $ invested at an APR of % for years.7000 4.2 21 The balance in the account after years is $ .21 (Round to the nearest cent as needed.) You deposit $ into a savings account with an APR of %. Complete parts (a) through (c) below.3500 1.4 (a) Compute the amount of interest you gain after 1 year. $ (Round to the nearest dollar as needed.) (b) To compute the amount of money in the savings account at the end of 1 year, take the original value and add interest: . This is equivalent to multiplying $ by what factor?$3500 + 1.4% • $3500 3500
  • 77. (Round to three decimal places as needed.) (c) To compute the amount of money in the account after 6 years you would multiply $ by what factor?3500 (Round to three decimal places as needed.) You deposit $ into a savings account with an APR of %. Use the table to complete parts (a) through (b) below.350 3.3 A B 1 Year Amount 2 0 $350 3 1 $361.55 4 2 $373.48 5 3 $385.81 6 4 $398.54 (a) What recursive formula would you enter in cell B3 that could be filled down? B2= * 0.033 B$2= * 1.033 B2= * 1.033 B$2 ^A3= * 1.033 (b) What closed formula would you enter in cell B3 that could be filled down? B$2 ^A$3= * 1.033 B$2= * 0.033
  • 78. B$2= * 1.033 B$2 ^A3= * 1.033 8. 9. 10. 11. 12. Describe the basic differences between linear growth and exponential growth. Choose the correct answer below. A. Linear growth occurs when a quantity grows by different, but proportional amounts, in each unit of time, and exponential growth occurs when a quantity grows by random amounts in each unit of time. B. Linear growth occurs when a quantity grows by the same relative amount, that is, by the same percentage, in each unit of time, and exponential growth occurs when a quantity grows by the same absolute amount in each unit of time. C. Linear growth occurs when a quantity grows by the same absolute amount in each unit of time,
  • 79. and exponential growth occurs when a quantity grows by the same relative amount, that is, by the same percentage, in each unit of time. D. Linear growth occurs when a quantity grows by random amounts in each unit of time, and exponential growth occurs when a quantity grows by different, but proportional amounts, in each unit of time. The population of a town is increasing by people per year. State whether this growth is linear or exponential. If the population is today, what will the population be in years? 639 1800 five Is the population growth linear or exponential? exponential linear What will the population be in years?five The price of a computer component is decreasing at a rate of % per year. State whether this decrease is linear or exponential. If the component costs $ today, what will it cost in three years? 10 120 Is the decline in price linear or exponential? linear
  • 80. exponential What will the component cost in three years? $ (Round to the nearest cent as needed.) You can not print this question until you complete the required media. You can not print this question until you complete the required media. 1. 2. Student: Kiare Mays Date: 06/15/20 Instructor: Valery Shemetov Course: MTH154 – Quantitative Reasoning (with MCR4) Assignment: Section 6.2 Homework Given the exponential equation , complete parts (a) through (b) below.y = 250 • e 0.0845 • x (a) Represent as a decimal to 4 decimal places.e 0.0845 (Round to four decimal places as needed.)
  • 81. (b) Rewrite the equation in the form .P = P • (1 + r)0 x P = 250 • (1.0845)x P = 250 • (1 + 8.82%)x P = 250 • (0.0882)x P = 250 • (1 + 8.45%)x A population can be modeled by the exponential equation , where t years since 1990 and y population. Complete parts (a) through (d) below. y = 250,000 • e − 0.0757 • t = = (a) What is the continuous decay rate per year? (Hint: If the rate k is a negative number, this implies a continuous decay rate with the opposite sign of k.) The population is decreasing at a continuous rate of % per year. (Round to two decimal places as needed.) (b) What is the annual decay rate (not continuous)? (Hint: If the rate r is a negative number, this implies an annual decay rate with the opposite sign of r.) The population is decreasing at an annual rate of % per year. (Round to two decimal places as needed.) (c) Rewrite the equation in the form .P = P • (1 + r)0 t A. P = 250,000 • (1 − 7.57%)t
  • 82. B. P = 250,000 • (0.9243)t C. P = 250,000 • ( − 0.729)t D. P = 250,000 • (0.9271)t (d) How many people will there be after 8 years? people (Round to the nearest whole number as needed.) 3. A population can be modeled by the exponential equation , where t years since 2010 and y population. Complete parts (a) through (d) below. y = 11,000 • e 0.2124 • t = = (a) What is the continuous growth rate per year? % (Round to two decimal places as needed.) (b) What is the annual growth rate (not continuous)? % (Round to two decimal places as needed.) (c) Rewrite the equation in the form .P = P • (1 + r)0 t A. P = 11,000 • (1.2124)t B. P = 11,000 • (0.2366)t
  • 83. C. P = 11,000 • (1 + 21.24%)t D. P = 11,000 • (1 + 23.66%)t (d) How many people will there be after 8 years? people (Round to the nearest whole number as needed.) 4. Consider the following case of exponential growth. Complete parts a through c below. The population of a town with an initial population of grows at a rate of % per year.48,000 7.5 a. Create an exponential function of the form , (where r 0 for growth and r 0 for decay) to model the situation described. Q = Q (1 + r)0 × t > < Q ( )= × t (Type integers or decimals.) b. Create a table showing the value of the quantity Q for the first 10 years of growth. Year t= Population Year t= Population 0 48,000 6 1 7 2 8 3 9 4 10
  • 84. 5 (Round to the nearest whole number as needed.) c. Make a graph of the exponential function. Choose the correct graph below. A. 0 10 40,000 110,000 Year Po pu la tio n B. 0 10 30,000 100,000 Year Po pu
  • 86. n 5. Consider the following case of exponential decay. Complete parts (a) through (c) below. A privately owned forest that had acres of old growth is being clear cut at a rate of % per year.5,000,000 2 a. Create an exponential function of the form , (where r 0 for growth and r 0 for decay) to model the situation described. Q = Q (1 + r)0 × t > < Q ( )= × t (Type integers or decimals.) b. Create a table showing the value of the quantity Q for the first 10 years of growth. Year t= Acres Year t= Acres 0 5,000,000 6 1 7 2 8 3 9 4 10 5 (Round to the nearest whole number as needed.) c. Make a graph of the exponential function. Choose the correct
  • 87. graph below. A. 0 10 4,000,000 5,000,000 Year Ac re s B. 0 10 0 1,000,000 Year Ac re s C. 0 10 4,000,000 5,000,000
  • 88. Year Ac re s D. 0 10 4,000,000 5,000,000 Year Ac re s 6. Answer the questions for the problem given below. The average price of a home in a town was $ in 2007 but home prices are rising by % per year.179,000 3 a. Find an exponential function of the form (where r 0) for growth to model the situation described.Q = Q (1 + r)0 × t > Q $ (1 )= × + t (Type an integer or a decimal.)
  • 89. b. Fill the table showing the value of the average price of a home for the following five years. Year t= Average price 0 $179,000 1 $ 2 $ 3 $ 4 $ 5 $ (Do not round until the final answer. Then round to the nearest dollar as needed.) 7. Consider the following case of exponential growth. Complete parts (a) through (c) below. Your starting salary at a new job is $ per month, and you get annual raises of % per year.1700 6 a. Create an exponential function of the form , (where r 0 for growth and r 0 for decay) to model the monthly salary situation described. Q = Q (1 + r)0 × t > < Q ( )= × t (Type integers or decimals.) b. Create a table showing the value of the quantity Q for the first 10 years of growth.
  • 90. Year t= Salary (per month) Year t= Salary (per month) 0 $1700 6 $ 1 $ 7 $ 2 $ 8 $ 3 $ 9 $ 4 $ 10 $ 5 $ (Round to two decimal places as needed.) c. Make a graph of the exponential function. Choose the correct graph below. A. 0 10 0 800 1,600 2,400 3,200 4,000 Year Sa la ry (d ol la rs
  • 93. 8. 9. Air pressure can be modeled by the exponential equation , where x altitude in 1000's of feet and y air pressure in psi. Complete parts (a) through (e) below. y = 14.1 • e − 0.0423 • x = = (a) What is the continuous decay rate per 1000 feet? (Hint: If the rate k is a negative number, this implies a continuous decay rate with the opposite sign of k.) The air pressure is decreasing at a continuous rate of % per 1000 feet. (Round to two decimal places as needed.) (b) What is the decay rate every 1000 feet (not continuous)? (Hint: If the rate r is a negative number, this implies an annual decay rate with the opposite sign of r.) The air pressure is decreasing at a rate of % per 1000 feet. (Round to two decimal places as needed.) (c) Rewrite the equation in the form .P = P • (1 + r)0 x A. P = 14.1 • (0.9586)x B. P = 14.1 • (1.0414)x
  • 94. C. P = 14.1 • (1 − 4.23%)x D. P = 14.1 • (0.9577)x (d) What is the air pressure at 35,000 feet? psi (Round to two decimal places as needed.) (e) What is the air pressure at sea level? psi (Round to one decimal place as needed.) You can not print this question until you complete the required media. 1. 2. Student: Kiare Mays Date: 06/15/20 Instructor: Valery Shemetov Course: MTH154 – Quantitative Reasoning (with MCR4) Assignment: Section 6.3 Homework Your mutual fund goes up % in the first year, then down % in the 2nd year, and finally up again % in the 3rd year. Complete parts a and b. 12.3 2.1 5.6
  • 95. a) What is the average rate of return per year? % (Do not round until the final answer. Then round to two decimal places as needed.) b) If the fund plummets % in the 4th year, what is the average rate of return per year for the 4 years?31 % (Do not round until the final answer. Then round to two decimal places as needed.) You average mph for the first miles of a trip and then mph for the next miles. Complete parts a and b.44 20 55 20 a) What is the average speed over the miles?40 mph (Type an integer or a decimal rounded to one decimal place.) b) If you then average mph over the next miles what is the average speed over the miles?75 20 60 mph (Type an integer or a decimal rounded to one decimal place.) 3. 4. 5. 1: Types of means.
  • 96. (1) arithmetic geometric harmonic (2) arithmetic geometric harmonic Determine whether to use the arithmetic mean, the geometric mean, or the harmonic mean to complete parts a and b. Click the icon to view the three types of means.1 a) You mix equal weights of ( kg/ ), ( kg/ ), and ( kg/ ) together. What is the density of the resulting alloy? (Hint: Density is the rate of weight to volume, kg/ .) Gold 19,320 m3 Europium 5243 m3 Aluminum 2712 m3 m3 To find the density of the resulting alloy, the (1) mean should be used and the density is kg/ .m3 (Type an integer or a decimal rounded to one decimal place.) b) If your veggie hot dog stand generates revenues of $ , $ , and $ at 3 events, what is your average revenue per event? 19,320 5243 2712 To find the average revenue per event, the (2) mean should be
  • 97. used and the average revenue is $ . (Round to the nearest cent as needed.) The arithmetic mean, , is an average of n numbers. a1 + a2 +⋯ + an n The geometric mean, , is the average of change in growth where the rate of growth and/or decay changes over time. n a1 • a2 •⋯ • an The harmonic mean, , is the average of rates, as in travelling n miles at one rate and n miles at another rate. n 1 a1 + 1 a2 +⋯ + 1 an Suppose the rate of return for a particular stock during the past
  • 98. two years was % and %. Compute the geometric mean rate of return. (Note: A rate of return of % is recorded as , and a rate of return of % is recorded as .) 5 35 5 0.05 35 0.35 The geometric mean rate of return is %. (Round to one decimal place as needed.) Suppose the rate of return for a particular stock during the past two years was % and . Compute the geometric mean rate of return. 10 − 40% The geometric mean rate of return is %. (Round to one decimal place as needed.) 6. 7. (1) more less A company's stock price rose % in 2011, and in 2012, it increased %.1.7 17.1 a. Compute the geometric mean rate of return for the two-year period 2011 2012. (Hint: Denote an increase of % by .) − 17.1
  • 99. 0.171 b. If someone purchased $1,000 of the company's stock at the start of 2011, what was its value at the end of 2012? c. Over the same period, another company had a geometric mean rate of return of %. If someone purchased $1,000 of the other company's stock, how would its value compare to the value found in part (b)? 32.11 a. The geometric mean rate of return for the two-year period 2011 2012 was %.− (Type an integer or decimal rounded to two decimal places as needed.) b. If someone purchased $1,000 of the company's stock at the start of 2011, its value at the end of 2012 was $ . (Round to the nearest cent as needed.) c. If someone purchased $1,000 of the other company's stock at the start of 2011, its value at the end of 2012 was $ , which is (1) than the value from part (b). (Round to the nearest cent as needed.) (1) more less A company's stock price rose % in 2011, and in 2012, it increased %.3.9 75.8 a. Compute the geometric mean rate of return for the two-year period 2011 2012. (Hint: Denote an increase of % by .)
  • 100. − 75.8 0.758 b. If someone purchased $1,000 of the company's stock at the start of 2011, what was its value at the end of 2012? c. Over the same period, another company had a geometric mean rate of return of %. If someone purchased $1,000 of the other company's stock, how would its value compare to the value found in part (b)? 10.3 a. The geometric mean rate of return for the two-year period 2011 2012 was %.− (Type an integer or decimal rounded to two decimal places as needed.) b. If someone purchased $1,000 of the company's stock at the start of 2011, its value at the end of 2012 was $ . (Round to the nearest cent as needed.) c. If someone purchased $1,000 of the other company's stock at the start of 2011, its value at the end of 2012 was $ , which is (1) than the value from part (b). (Round to the nearest cent as needed.) 8. 2: Data table for total rate of return 3: Geometric mean rate of return for stock market indices
  • 101. The data in the accompanying table represent the total rates of return (in percentages) for three stock exchanges over the four-year period from 2009 to 2012. Calculate the geometric mean rate of return for each of the three stock exchanges. Click the icon to view data table for total rate of return for stock market indices.2 Click the icon to view data table for total rate of return for platinum, gold, and silver.3 a. Compute the geometric mean rate of return per year for the stock indices from 2009 through 2012. For stock exchange A, the geometric mean rate of return for the four-year period 2009-2012 was %. (Type an integer or decimal rounded to two decimal places as needed.) For stock exchange B, the geometric mean rate of return for the four-year period 2009-2012 was %. (Type an integer or decimal rounded to two decimal places as needed.) For stock exchange C, the geometric mean rate of return for the four-year period 2009-2012 was %. (Type an integer or decimal rounded to two decimal places as needed.) b. What conclusions can you reach concerning the geometric mean rates of return per year of the three market indices? A. Stock exchange B had a higher return than exchange C and a much higher return than exchange A.
  • 102. B. Stock exchange C had a much higher return than exchanges A or B. C. Stock exchange A had a much higher return than exchanges B or C. D. Stock exchange A had a higher return than exchange C and a much higher return than exchange B. c. Compare the results of (b) to those of the results of the precious metals. Choose the correct answer below. A. All three stock indices had lower returns than any of the precious metals. B. Silver had a much higher return than any of the three stock indices. Both gold and platinum had a worse return than stock index C, but a better return than indices A and B. C. Silver had a worse return than stock index C, but a better return than indices A and B. Gold had a better return than index B, but a worse return than indices A and C. Platinum had a worse return than all three stock indices. D. All three stock indices had higher returns than any of the precious metals. Year A B C 2012 8.61 12.77 15.85 2011 4.57 0.00 − 2.25 2010 11.00 11.54 16.18 2009 18.99 23.35 43.15 Metal Geometric mean rate of return
  • 103. Platinum %14.85 Gold %16.54 Silver %20.96 9. 4: Data table for total rate of return 5: Geometric mean rate of return for stock market indices In 2009 2012, the value of precious metals changed rapidly. The data in the accompanying table represents the total rate of return (in percentage) for platinum, gold, and silver from 2009 – through 2012. Complete parts (a) through (c) below. Click the icon to view data table for total rate of return for platinum, gold, and silver.4 Click the icon to view the geometric mean rate of return for stock market indices.5 a. Compute the geometric mean rate of return per year for platinum, gold, and silver from 2009 through 2012. The geometric mean rate of return for platinum during this time period was %. (Type an integer or decimal rounded to two decimal places as needed.) The geometric mean rate of return for gold during this time period was %.
  • 104. (Type an integer or decimal rounded to two decimal places as needed.) The geometric mean rate of return for silver during this time period was %. (Type an integer or decimal rounded to two decimal places as needed.) b. What conclusions can you reach concerning the geometric mean rates of return of the three precious metals? A. Platinum had a higher return than silver and a much higher return than gold. B. Platinum had a much higher return than silver and gold. C. Silver had a much higher return than gold and platinum. D. Gold had a higher return than silver and a much higher return than platinum. c. Compare the results of (b) to those of the results of the stock indices. Choose the correct answer below. A. Silver had a much higher return than any of the three stock indices. Both gold and platinum had a worse return than stock index C, but a better return than indices A and B. B. All three metals had lower returns than any of the stock indices. C. Silver had a worse return than stock index C, but a better return than indices A and B. Gold had a better return than index B, but a worse return than indices A and C. Platinum had a worse return than all three stock indices. D. All three metals had higher returns than any of the stock
  • 105. indices. Year Platinum Gold Silver 2012 5.8 0.2 56.6 2011 − 23.9 9.6 − 9.1 2010 23.3 30.6 14.8 2009 55.1 23.5 46.3 Stock indices Geometric mean rate of return A %9.96 B %11.28 C %22.49 10. 11. 12. 13. The half-life of a certain element is days, meaning every days the amount is cut in half. Complete parts (a) through (d) below. 15.5 15.5 (a) Fill in the following table. Days Grams 0 40 15.5 31.0
  • 106. 46.5 (Round to two decimal places as needed.) (b) What is the average percent change per day over the first days?15.5 % (Round to two decimal places as needed.) (c) Write down an equation for the amount of the element left after d days in the form: A = A • (1 + r)0 d A = 40 • (1 − 4.37%)d A = 40 • (1 + 4.37%)d A = 40 • (0.0437)d A = 40 • (1.0437)d (d) How much is left after 3 days? grams (Round to one decimal place as needed.) The average cost of gas dropped from a high of $ per gallon on June 1, 2015 to a low of $ on February 1, 2016. Complete parts (a) through (c) below. 2.81 1.65 (a) What is the average percent change in gas price per month? % (Round to one decimal place as needed.)
  • 107. (b) What is the decay factor associated to this rate? (Round to three decimal places as needed.) (c) Write down an equation for the price of gas m months after June 1, 2015 in the form: P = P • (1 + r)0 m A. P = 2.81 • (1 − 0.936)m B. P = 2.81 • (1.064)m C. P = 2.81 • (0.064)m D. P = 2.81 • (0.936)m You can not print this question until you complete the required media. You can not print this question until you complete the required media. 1. 2. 3. 4. Student: Kiare Mays Date: 06/15/20
  • 108. Instructor: Valery Shemetov Course: MTH154 – Quantitative Reasoning (with MCR4) Assignment: Section 7.1 Homework A certain town's population is growing according to the following equation. Answer parts (a) through (c). P = 7,800 • (1.068)t (a) To find how long it will take for the population, P, to , substitute for P.triple (Type an integer or a decimal.) (b) We are looking at the time, t, which solves the equation: . Fill in the following table.3 = (1.068)t t 1.068 t 14 15 16 17 18 19 (Type integers or decimals rounded to four decimal places as needed.) (c) The time it takes to is closest to what integer value of t in the table above?triple The time it takes to is closest to t .triple = Solve for x.
  • 109. 3x = 27 The solution is x .= (Simplify your answer. Type an integer or a fraction. Use a comma to separate answers as needed.) Solve for x. log x = 610 x = Solve for x. log x = 4.610 x = (Round to two decimal places as needed.) 5. Evaluate logarithms without using a calculator by rewriting them in exponential form. Answer parts (a) through (d). (a) Rewrite y as an exponential. Select the correct choice below and fill in the answer box within your choice.log 497 = A. 49 = 7 B. 749 = C. 7 = 49 (b) Solve the equation y.log 497 =
  • 110. log 497 = (Type an integer or a decimal rounded to two decimal places as needed.) (c) Rewrite y as an exponential. Select the correct choice below and fill in the answer box within your choice.log 17 = A. 1 = 7 B. 7 = 1 C. 71 = (d) Solve the equation y.log 17 = log 17 = (Type an integer or a decimal rounded to two decimal places as needed.) 6. Evaluate logarithms without using a calculator by rewriting them in exponential form. Answer parts (a) through (d). (a) Rewrite y as an exponential. Select the correct choice below and fill in the answer box within your choice.ln e − 6 = A. − 6e = B. 2 = e − 6 C. e = e − 6 (b) Solve the equation y.ln e − 6 = ln e − 6 =
  • 111. (Type an integer or a decimal.) (c) Rewrite y as an exponential. Select the correct choice below and fill in the answer box within your choice.ln e 19 = A. 2 = e 19 B. 19e = C. e = e 19 (d) Solve the equation y.ln e 19 = ln e 19 = (Type an integer or a decimal.) 7. Evaluate logarithms without using a calculator by rewriting them in exponential form. Answer parts (a) through (d). (a) Rewrite y as an exponential. Select the correct choice below and fill in the answer box within your choice.log 0.0001 = A. 103 = B. 10 = 0.0001 C. 0.0001 = 10 (b) Solve the equation y.log 0.0001 = log 0.0001 = (Type an integer or a decimal.)
  • 112. (c) Rewrite y as an exponential. Select the correct choice below and fill in the answer box within your choice. log 1,000,000 = A. 10 = 1,000,000 B. 1,000,000 = 10 C. 101,000,000 = (d) Solve the equation y.log 1,000,000 = log 1,000,000 = (Type an integer or a decimal.) 8. 9. Evaluate logarithms using properties of logarithms. Answer parts (a) through (f). (a) Rewrite the following as a power of 10. 10 • 103 5 = 10 (Simplify your answer.) (b) Solve the equation y.log 103 • 105 = log 103 • 105 = (Simplify your answer.)
  • 113. (c) Rewrite the following as a power of 10. 10 ÷ 103 5 = 10 (Simplify your answer.) (d) Solve the equation y.log 103 ÷ 105 = log 103 ÷ 105 = (Simplify your answer.) (e) Rewrite the following as a power of 10. 103 5 = 10 (Simplify your answer.) (f) Solve the equation y.log 103 5 = log 103 5 = (Simplify your answer.) Using the approximation , find each of the following without a calculator.log 610 ≈ 0.778 a. b. c. d. log 1036 log 10600 log 10 1 36 log 100.6 a. log 1036 = (Simplify your answer. Type an integer or decimal rounded to three decimal places as needed.) b. log 10600 = (Simplify your answer. Type an integer or decimal rounded to
  • 114. three decimal places as needed.) c. log 10 1 36 = (Simplify your answer. Type an integer or decimal rounded to three decimal places as needed.) d. log 100.6 = (Simplify your answer. Type an integer or decimal rounded to three decimal places as needed.) 10. Evaluate the following expressions. a. 10 104 × 7 b. 10 109 × − 5 c. 109 103 d. 104 10 − 2 a. (Simplify your answer. Type your answer using exponential notation.)10 104 × 7 = b. (Simplify your answer. Type your answer using exponential notation.)10 109 × − 5 = c. (Simplify your answer. Type your answer using exponential notation.) 109
  • 115. 103 = d. (Simplify your answer. Type your answer using exponential notation.) 104 10 − 2 = 1. Student: Kiare Mays Date: 06/15/20 Instructor: Valery Shemetov Course: MTH154 – Quantitative Reasoning (with MCR4) Assignment: Section 5.1 Homework The distance you drive is proportional to the amount of gas used. Driving miles uses gallons of gas. Complete parts (a) through (c). 112 4 (a) Fill in the following table. ( )Gas gal ( )Distance mi 0
  • 116. 4 8 12 (Type integers or decimals.) (b) Represent the relationship between distance driven, D, and gas used, G, with an equation. D G= • (Type an integer or a decimal.) (c) What is the graph of the equation that represents the relationship between driven, D, and gas used, G? A. 100 20 200 0 400 Gas (gal) D is ta nc e (m
  • 119. 2. The cost of an airline ticket is proportional to the distance traveled at a rate of $ per miles flown. Complete parts (a) through (c). 36 100 (a) Fill in the following table. ( )Distance mi ( )Cost $ 0 50 100 150 (Type integers or decimals. Do not include the $ symbol in your answers.) (b) Represent the relationship between cost, C, and distance flown, D, with an equation. C D= • (Type an integer or a decimal. Do not include the $ symbol in your answer.) (c) What is the graph of the equation that represents the relationship between cost, C, and distance flown, D? A. 750 150 30 0
  • 120. 60 Distance (mi) C os t ( $) B. 750 150 30 0 60 Distance (mi) C os t ( $) C. 750 150 30 0
  • 121. 60 Distance (mi) C os t ( $) D. 750 150 30 0 60 Distance (mi) C os t ( $) 3. 4. Your monthly electric bill is proportional to the number of
  • 122. kilowatt-hours (kwh) of energy used at a rate of cents per kwh. Complete parts (a) through (c). 4.3 (a) Fill in the following table. ( )Energy kwh ( )Cost $ 0 600 1,200 1,800 (Type integers or decimals rounded to the nearest hundredth as needed. Do not include the $ symbol in your answers.) (b) Represent the relationship between cost ($), C, and energy used (kwh), E, with an equation. C E= • (Type an integer or a decimal. Do not include the $ symbol in your answer.) (c) What is the graph of the equation that represents the relationship between cost ($), C, and energy used (kwh), E? A. 10000 2000 50 0 100
  • 123. Energy (kwh) C os t ( $) B. 10000 2000 50 0 100 Energy (kwh) C os t ( $) C. 10000 2000 50 0 100
  • 124. Energy (kwh) C os t ( $) D. 10000 2000 50 0 100 Energy (kwh) C os t ( $) Plot the ordered pair ( , ) on the rectangular coordinate plane. 2 8 Plot ( , ).2 8 -10 -8 -6 -4 -2 2 4 6 8 10
  • 125. -10 -8 -6 -4 -2 2 4 6 8 10 x y 5. 6. Plot the point in the rectangular coordinate system.( − 8, − 2) Plot .( − 8, − 2) -10 -8 -6 -4 -2 2 4 6 8 10
  • 126. -10 -8 -6 -4 -2 2 4 6 8 10 The distance you drive is proportional to the amount of gas used. Driving miles uses gallons of gas. Assume you have already driven miles. Complete parts (a) through (c). 144 4 100 (a) Fill in the following table for total distance driven. ( )Gas gal ( )Distance mi 0 4 8 12 (Type integers or decimals.)
  • 127. (b) Represent the relationship between distance driven, D, and gas used, G, with an equation. D G= • + (Type integers or decimals.) (c) What is the graph of the equation that represents the relationship between distance driven, D, and gas used, G? A. 100 20 300 0 600 Gas (gal) D is ta nc e (m i) B. 100 20
  • 129. nc e (m i) D. 100 20 300 0 600 Gas (gal) D is ta nc e (m i) 7. The cost of an airline ticket is proportional to the distance traveled at a rate of $ per miles flown. Assume that there is a base charge of $ . Complete parts (a) through (c).
  • 130. 42 150 25 (a) Fill in the following table for total cost. ( )Distance mi ( )Cost $ 0 150 300 450 (Type integers or decimals. Do not include the $ symbol in your answers.) (b) Represent the relationship between cost, C, and distance flown, D, with an equation. C D= • + (Type integers or decimals. Do not include the $ symbol in your answers.) (c) What is the graph of the equation that represents the relationship between cost, C, and distance flown, D? A. 2250 450 80 0 160 Distance (mi)
  • 131. C os t ( $) B. 2250 450 80 0 160 Distance (mi) C os t ( $) C. 2250 450 80 0 160 Distance (mi)
  • 132. C os t ( $) D. 2250 450 80 0 160 Distance (mi) C os t ( $) 8. 9. 10. Your monthly electric bill is proportional to the number of kilowatt-hours (kwh) of energy used at a rate of cents per kwh. There is a monthly base charge of $ . Complete parts (a)
  • 133. through (c). 4.5 17.50 (a) Fill in the following table for total monthly cost. ( )Energy kwh ( )Cost $ 0 600 1200 1800 (Type integers or decimals. Do not include the $ symbol in your answers.) (b) Represent the relationship between cost ($), C, and energy used (kwh), E, with an equation. C E= • + (Type integers or decimals. Do not include the $ symbol in your answers.) (c) What is the graph of the equation that represents the relationship between cost ($), C, and energy used (kwh), E? A. 10000 2000 50 0 100
  • 134. Energy (kwh) C os t ( $) B. 10000 2000 50 0 100 Energy (kwh) C os t ( $) C. 10000 2000 50 0 100
  • 135. Energy (kwh) C os t ( $) D. 10000 2000 50 0 100 Energy (kwh) C os t ( $) Determine which ordered pairs satisfy the given equation. x + 5y = 19 ( )4,3 ( )− 1,4 ( )0, − 3 Select all ordered pairs that satisfy the given equation. A. ( )0, − 3 B. ( )4,3 C. ( )− 1,4
  • 136. D. None of the ordered pairs satisfy the equation. Determine which ordered pairs satisfy the given equation. 5x − 4y = 9 9 5 ,0 ( )5,4 ( )0, − 4 Select all ordered pairs that satisfy the given equation. A. 9 5 ,0 B. ( )5,4 C. ( )0, − 4 D. None of the ordered pairs satisfy the equation.